. 2020 Jan 16;11(1):139.
doi: 10.1038/s41467-019-13915-7.

Extreme intratumour heterogeneity and driver evolution in mismatch repair deficient gastro-oesophageal cancer

Affiliations

Extreme intratumour heterogeneity and driver evolution in mismatch repair deficient gastro-oesophageal cancer

Katharina von Loga et al. Nat Commun. .

Erratum in

Abstract

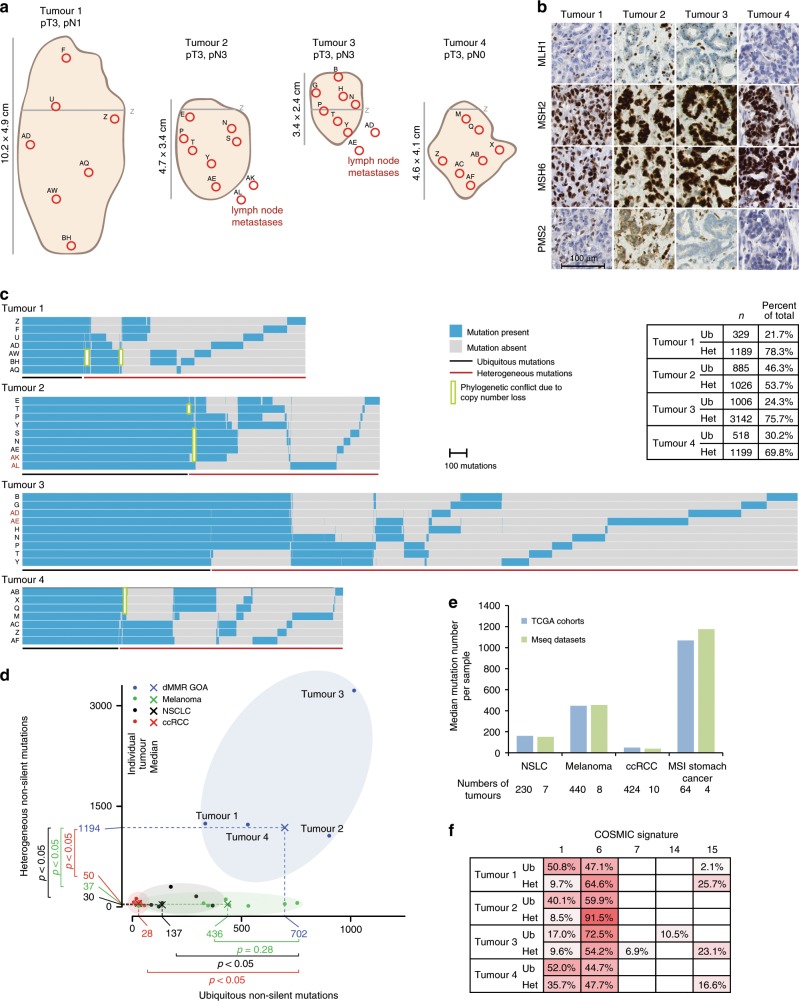
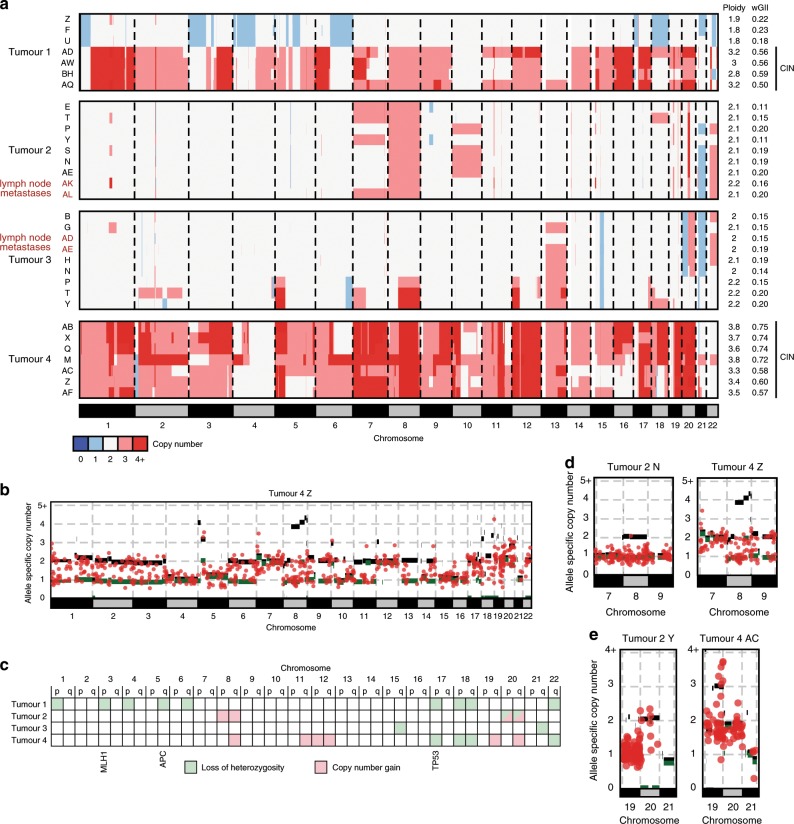
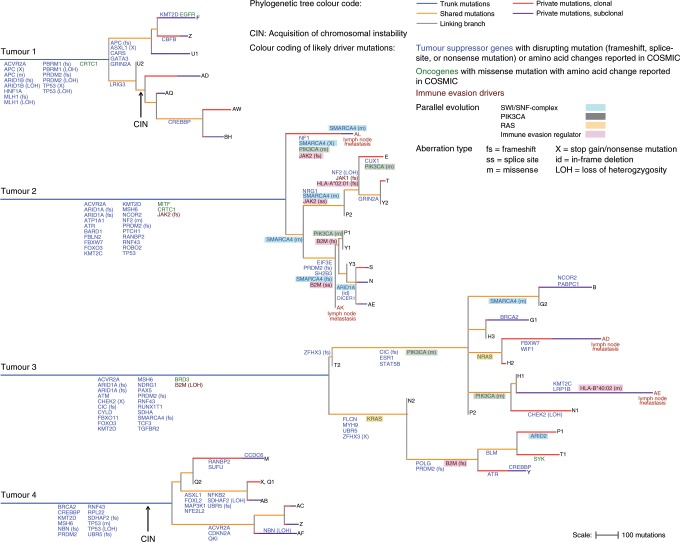
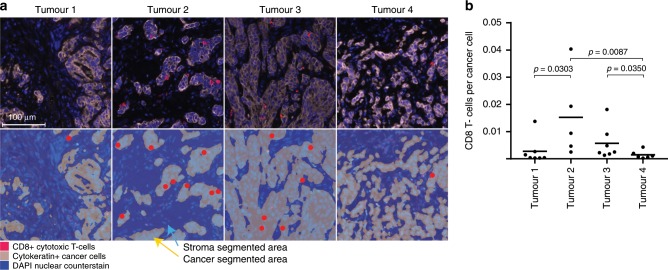
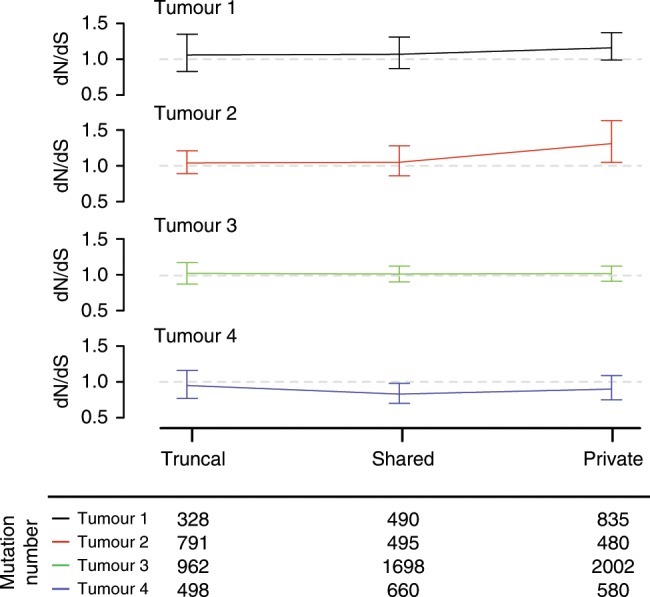
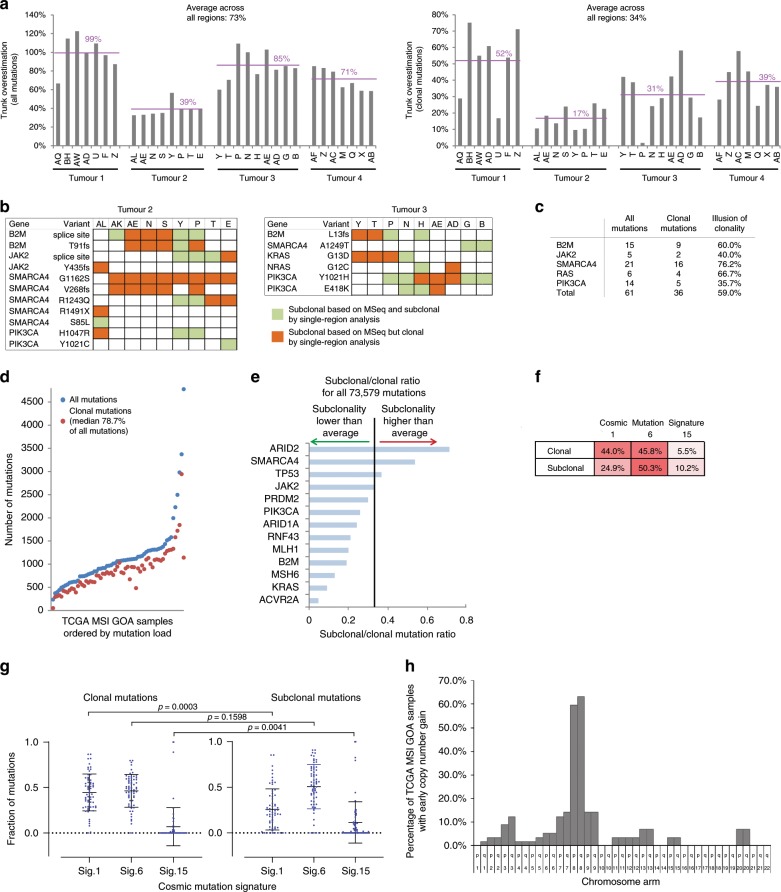
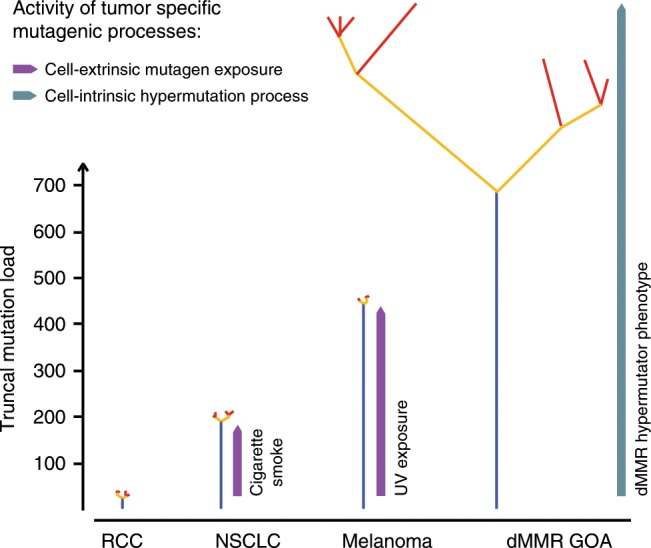
Mismatch repair deficient (dMMR) gastro-oesophageal adenocarcinomas (GOAs) show better outcomes than their MMR-proficient counterparts and high immunotherapy sensitivity. The hypermutator-phenotype of dMMR tumours theoretically enables high evolvability but their evolution has not been investigated. Here we apply multi-region exome sequencing (MSeq) to four treatment-naive dMMR GOAs. This reveals extreme intratumour heterogeneity (ITH), exceeding ITH in other cancer types >20-fold, but also long phylogenetic trunks which may explain the exquisite immunotherapy sensitivity of dMMR tumours. Subclonal driver mutations are common and parallel evolution occurs in RAS, PIK3CA, SWI/SNF-complex genes and in immune evasion regulators. MSeq data and evolution analysis of single region-data from 64 MSI GOAs show that chromosome 8 gains are early genetic events and that the hypermutator-phenotype remains active during progression. MSeq may be necessary for biomarker development in these heterogeneous cancers. Comparison with other MSeq-analysed tumour types reveals mutation rates and their timing to determine phylogenetic tree morphologies.


Conflict of interest statement

The authors declare no competing interests.

Figures

Fig. 1
Fig. 1. Intratumour heterogeneity of somatic mutations.
a Tumour size, location, TNM-stage and regions selected for sequencing. The grey line labelled (Z) marks the gastro-oesophageal junction. b Immunohistochemical staining of MLH1, MSH2, MSH6 and PMS2. c Heat maps showing the presence (blue) or absence (grey) of non-silent somatic mutations that were identified by MSeq across tumour regions. The table shows the number of heterogeneous (Het) and ubiquitous (Ub) mutations identified in each tumour and their percentage of the total non-silent mutation count of the tumour. d Comparison of ubiquitous and heterogeneous mutation counts across four different tumour types analysed by MSeq (dMMR GOA: mismatch repair deficient gastro-oesophageal adenocarcinoma, Melanoma, NSCLC: non-small cell lung cancer, ccRCC: clear cell renal cell carcinoma). The Mann–Whitney test was used to assess significant differences in mutation loads between dMMR GOA and other tumour types. e Median mutation loads of individual regions from MSeq datasets compared to the median single sample mutation loads from the Cancer Genome Atlas KIRC, SKCM, STAD and LUAD cohorts. f COSMIC mutational signature analysis of ubiquitous (Ub) and heterogeneous (Het) mutations in four dMMR GOAs. Non-silent and synonymous mutations were included in the analysis and only signatures which contributed to ≥5% of mutations in at least one sample are shown.
Fig. 2
Fig. 2. Intratumour heterogeneity of DNA copy number aberration.
a Genome-wide DNA copy number profiles of each tumour region. Profiles showing chromosomal instability (CIN) are labelled with a black bar on the right. b Example of an allele specific DNA copy number profile and superimposed copy numbers of somatic mutations from Tumour 4. This allows timing of CIN/genome duplication, demonstrating late acquisition, as large numbers of mutations are located on the major alleles for most gained chromosomes. c Ubiquitous loss of heterozygosity (LOH) or copy number gains identified in each of the four tumours. Tumour suppressor genes commonly mutated in dMMR GOAs and which are located on chromosomes showing ubiquitous LOH are labelled. d Examples of the allele specific copy number and copy number of corresponding somatic mutations for Chr8 and e for Chr20 which showed recurrent ubiquitous gains in our series.
Fig. 3
Fig. 3. Tumour phylogenetic trees.
Trees were reconstructed from non-silent and synonymous mutations and trunk and branch lengths are proportional to the number of mutations acquired. Trees are rooted at the germline DNA sequence, determined by exome sequencing of DNA from tumour adjacent normal tissue. Subclones that define the tips of the tree are labelled with the tumour region in which they were identified. Numbers were added where several subclones were identified by the phylogenetic deconvolution algorithm within a tumour region, with 1 defining the largest intra-regional subclone and 2, 3 increasingly smaller subclones. Private mutations were furthermore split into those that were clonal in the analysed region (present in >0.7 of the cancer cell fraction in that region) and those that were subclonal (present in ≤ 0.7 of the cancer cell fraction). Likely driver mutations and relevant loss of heterozygosity (LOH) events were mapped onto the branch of the trees where they likely occurred. Genes affected by more than one genetic aberration within a tumour are labelled with the genetic aberration type that occurred. Arrows labelled ‘CIN’ indicate the likely onset of chromosomal instability.
Fig. 4
Fig. 4. CD8+ T-cell infiltrates in dMMR GOAs.
a Representative images of CD8+ T-cell infiltrates in Tumours 1–4. Upper row: fluorescent composite IHC image showing cancer cells and CD8+ cytotoxic T-cells. Bottom row: segmentation of cancer areas (grey, yellow arrow) and stroma (blue, light blue arrow) allowed to only count the highlighted CD8+ T-cell in cancer areas. b The ratio of CD8+ T-cells divided by the number of cancer cells (cytokeratin-positive cells) for all regions of Tumours 1–4. Black bar: median; p-values (Spearman rank test) are shown for significant differences.
Fig. 5
Fig. 5. Non-synonymous to synonymous (dN/dS) mutation ratios.
dN/dS ratios for ubiquitous, shared and private mutations, adjusted for common mutation biases. Error bars show 95% CI’s. The total number of synonymous and non-synonymous mutations available in each category for the analysis are shown beneath the plot.
Fig. 6
Fig. 6. Clonal and subclonal mutation analysis.
a Comparison of the total non-silent mutation load per region and of the clonal mutation load per region (defined as present in a cancer cell fraction (CCF) of 0.7 or above) against the number of ubiquitous mutations that have been identified by MSeq. The percent difference to the ubiquitous mutation load is shown. b Subclonal driver gene mutations assessed by MSeq in Tumours 2 and 3. In green mutations that single-region analysis picks up as subclonal and in orange mutations that would have been falsely assigned as clonal by single-region analysis. c Illusion of clonality (in percent) for driver gene mutations. d Mutation load of TCGA MSI GOA samples, number of all mutations in blue and of clonal mutations in red. e Subclonal to clonal mutation ratio for driver gene mutations. The black line shows the average ratio across all somatic mutations. f Mean percentage of clonal and subclonal mutational signatures found in TCGA MSI GOA samples. g Subclonal and clonal mutational signatures for 64 TCGA MSI GOAs. Means and standard deviation are shown and p-values have been calculated with a Mann–Whitney test. h Percentage of the 64 TCGA samples that gained the indicated chromosome arm early, i.e. before a high number of mutations was acquired through MSI.
Fig. 7
Fig. 7. Comparison of phylogenetic tree morphologies across four cancer types analysed by MSeq.
Schematics of branched phylogenetic trees drawn with similar branching structures to those directly observed in each of the four tumour types,,. Trees were scaled so that trunk and branch lengths are proportional to the average number of ubiquitous and heterogeneous non-silent mutation loads of each tumour type (Fig. 1c). Phylogenetic tree colour code: blue: truncal mutations, yellow: shared mutations, red: private mutations.

References

    1. Ferlay J, et al. Cancer incidence and mortality worldwide: sources, methods and major patterns in GLOBOCAN 2012. Int. J. Cancer. 2015;136:E359–E386. - PubMed
    1. TCGA. Comprehensive molecular characterization of gastric adenocarcinoma. Nature513, 202–209 (2014). - PMC - PubMed
    1. Polom K, et al. Meta-analysis of microsatellite instability in relation to clinicopathological characteristics and overall survival in gastric cancer. Br. J. Surg. 2018;105:159–167. - PubMed
    1. Smyth Elizabeth Catherine, Hulkki Wilson Sanna, Nankivell Matthew Guy, Gonzalez de Castro David, Wotherspoon Andrew, Okines Alicia Frances Clare, Langley Ruth E, Stenning Sally Patricia, Cunningham David. Prognostic and predictive effect of microsatellite instability (MSI) in MAGIC. Journal of Clinical Oncology. 2015;33(3_suppl):62–62.
    1. Le DT, et al. Mismatch repair deficiency predicts response of solid tumors to PD-1 blockade. Science. 2017;357:409–413. - PMC - PubMed

Publication types

Supplementary concepts