. 2020 Jan 16;11(1):320.
doi: 10.1038/s41467-019-14098-x.

Epigenetic reprogramming at estrogen-receptor binding sites alters 3D chromatin landscape in endocrine-resistant breast cancer

Affiliations

Epigenetic reprogramming at estrogen-receptor binding sites alters 3D chromatin landscape in endocrine-resistant breast cancer

Joanna Achinger-Kawecka et al. Nat Commun. .

Abstract

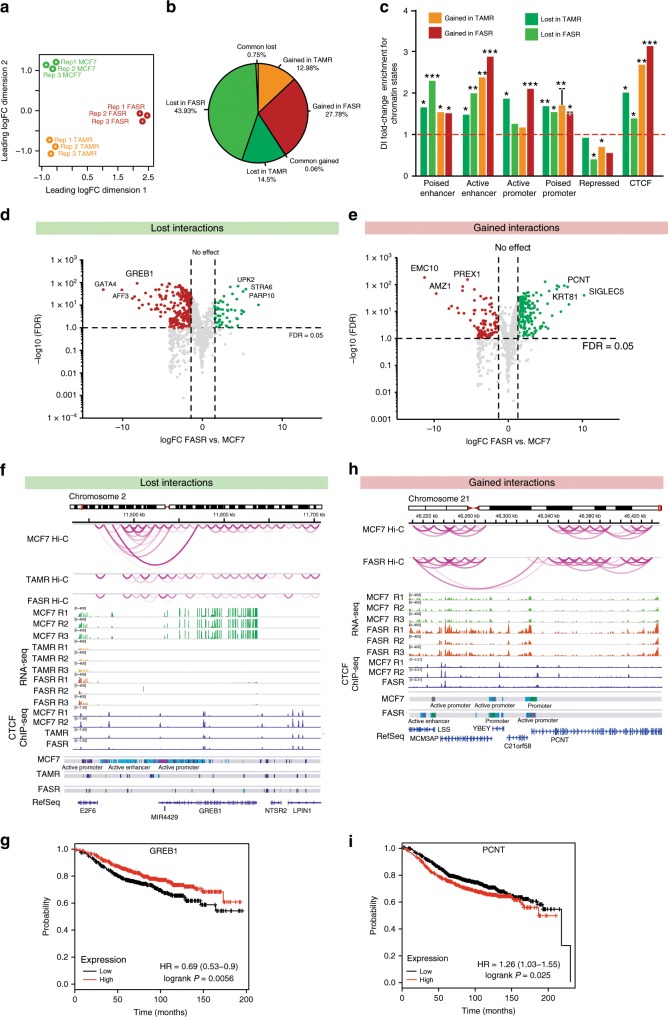
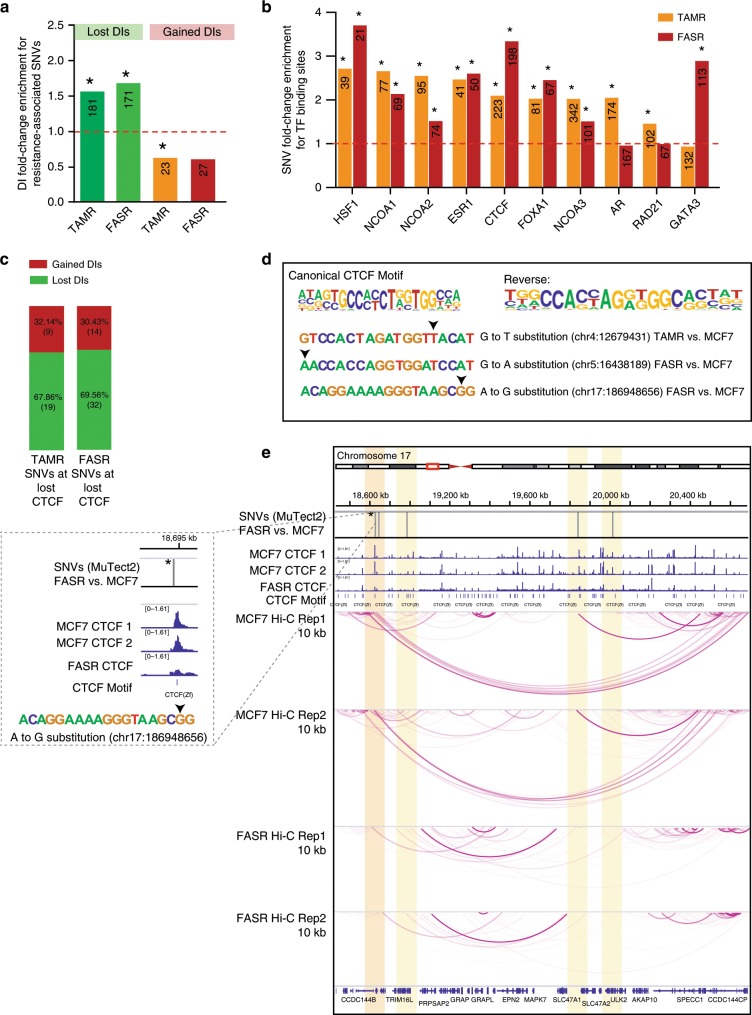
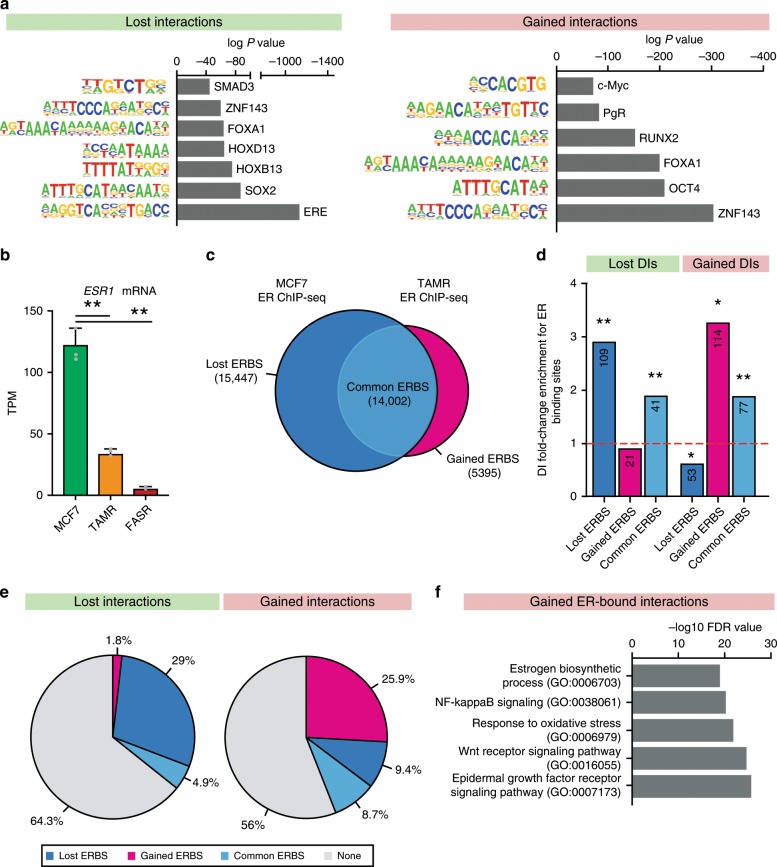
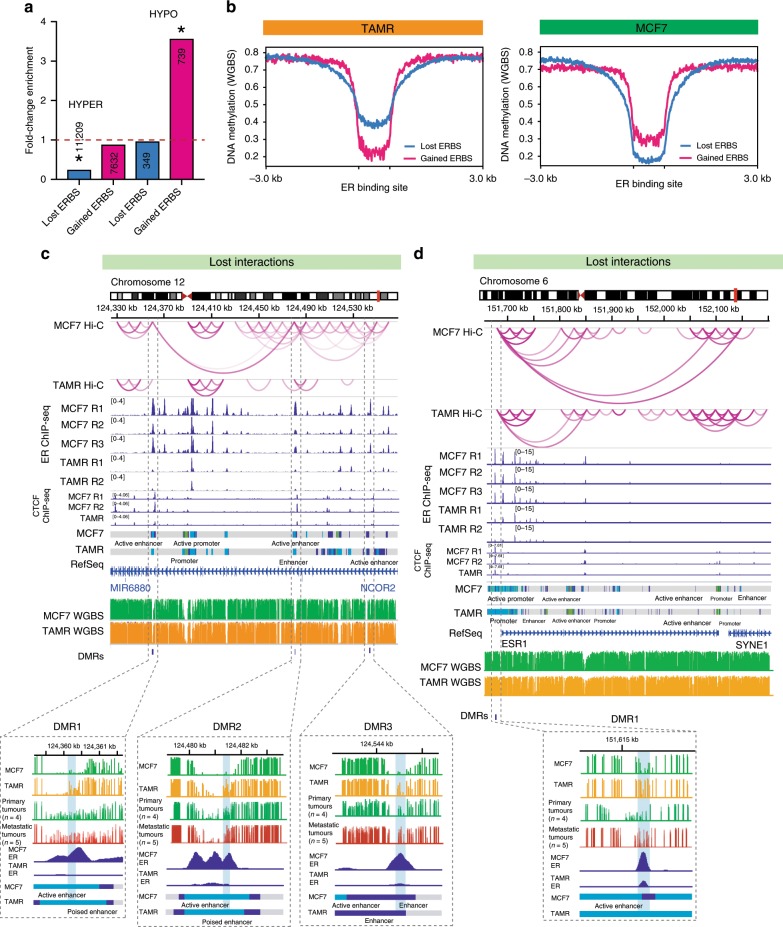
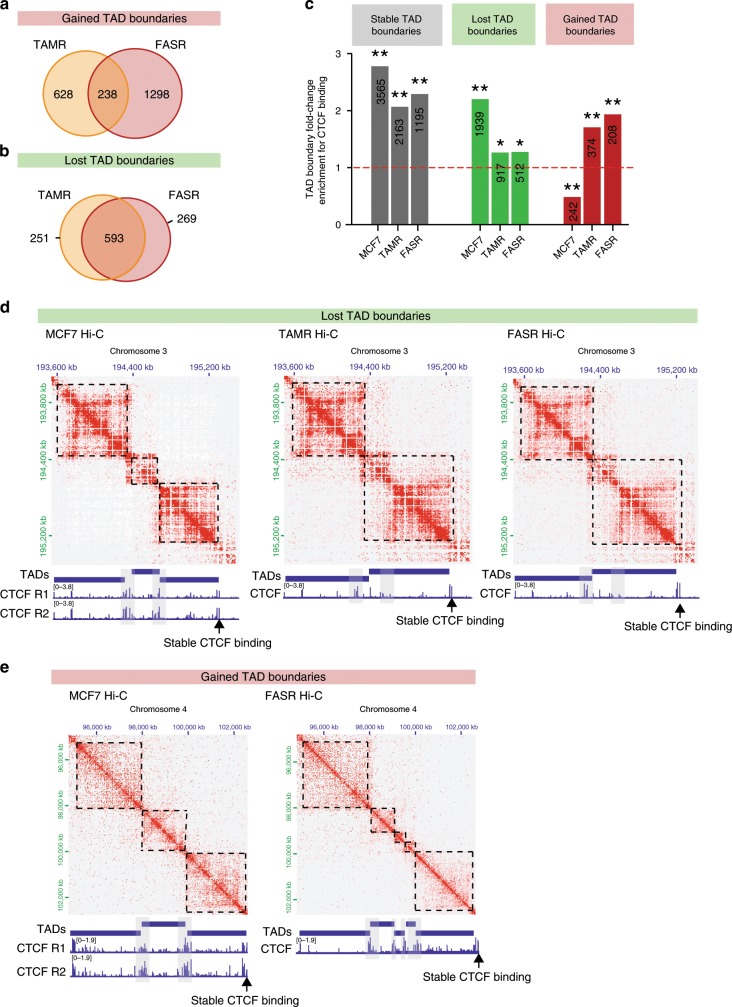
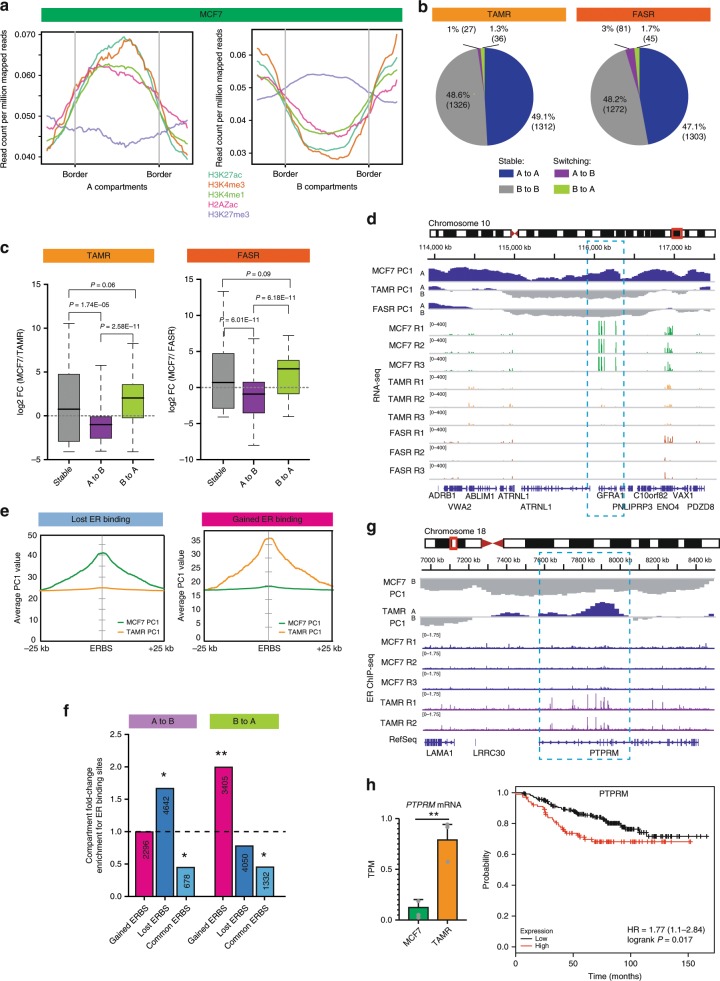
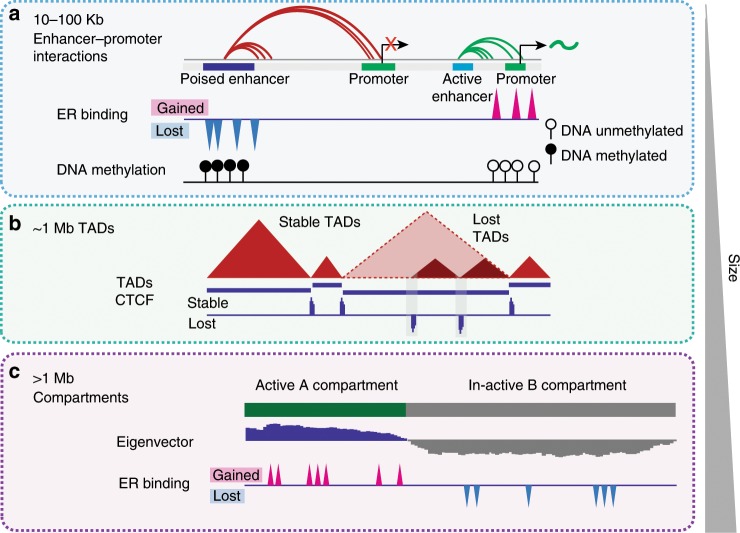
Endocrine therapy resistance frequently develops in estrogen receptor positive (ER+) breast cancer, but the underlying molecular mechanisms are largely unknown. Here, we show that 3-dimensional (3D) chromatin interactions both within and between topologically associating domains (TADs) frequently change in ER+ endocrine-resistant breast cancer cells and that the differential interactions are enriched for resistance-associated genetic variants at CTCF-bound anchors. Ectopic chromatin interactions are preferentially enriched at active enhancers and promoters and ER binding sites, and are associated with altered expression of ER-regulated genes, consistent with dynamic remodelling of ER pathways accompanying the development of endocrine resistance. We observe that loss of 3D chromatin interactions often occurs coincidently with hypermethylation and loss of ER binding. Alterations in active A and inactive B chromosomal compartments are also associated with decreased ER binding and atypical interactions and gene expression. Together, our results suggest that 3D epigenome remodelling is a key mechanism underlying endocrine resistance in ER+ breast cancer.


Conflict of interest statement

The authors declare no competing interests.

Figures

Fig. 1
Fig. 1. Differential enhancer−promoter interactions and gene deregulation.
a Multidimensional scaling plot (MDS) of the top 1000 interactions for each individual Hi-C replicate (MCF7, TAMR and FASR) at 20 kb resolution. b Pie chart showing overlapping anchor regions between differential interactions identified in TAMR vs. MCF7 diffHiC and FASR vs. MCF7 diffHiC analysis. c Differential interactions (DIs) enrichment for chromatin states based on ChromHMM segmentation and transcription factor binding at lost and gained differential interactions in TAMR and FASR cells as compared to MCF7 cells. Asterisks represent the significance of fold-change enrichment at observed vs. random regions (permutation test, SD, n = 2). ***P value < 0.001, **P value < 0.005, *P value < 0.05. d Volcano plot (−log10FDR vs. log2 fold change) of all genes present at anchors of lost differential interactions between FASR and MCF7 cells. Source data are provided as a Source Data file. e Volcano plot (−log10FDR vs. log2 fold change) of all genes present at anchors of gained differential interactions between FASR and MCF7 cells. Source data are provided as a Source Data file. f Representative example demonstrating the association between enhancer−promoter interactions lost in TAMR and FASR cells as compared to MCF7 cells and decreased expression of GREB1 gene. Numerous interactions between active enhancers and active promoter of GREB1 gene are present in MCF7 cells. In TAMR and FASR cells this region is occupied by poised enhancers and the long-range interaction present in MCF7 cells is lost. CTCF ChIP-seq track is shown. g Kaplan−Meier curves displaying relapse-free survival for 742 patients with ER+ tumours receiving endocrine treatment based on GREB1 gene expression. Patients with tumours with high expression of GREB1 are shown in red and those with low expression are shown in black. P value as indicated, log rank test. h Representative example demonstrating the association between enhancer−promoter interactions gained in FASR cells as compared to MCF7 cells and overexpression of PCNT gene. Long-range interactions between distant enhancer and promoter of PCNT gene are present in FASR cells and absent in MCF7 cells. CTCF ChIP-seq track is shown. i Kaplan−Meier curves displaying relapse-free survival for 742 patients with ER+ tumours receiving endocrine treatment based on PCNT gene expression. Patients with tumours with high expression of PCNT are shown in red and those with low expression are shown in black. P value as indicated, log rank test.
Fig. 2
Fig. 2. SNVs associate with loss of CTCF binding and loss of interactions.
a Differential interactions (DIs) enrichment for SNVs identified by MuTect2 in TAMR and FASR genomes as compared to MCF7 genome. Asterisks represent the significance of fold-change enrichment at observed vs. random regions (permutation test). *P value < 0.005. The numbers of DIs located within each specific region are presented in the respective column. b Endocrine-resistance-associated SNVs fold-change enrichment for transcription factor binding sites from ReMap v.2 2018. The numbers of SNVs located within each specific binding site are presented in the respective column (*P value < 0.005). c Proportion of resistance-associated SNVs associated with loss of CTCF binding at anchors of gained or lost differential interactions in endocrine-resistant cell lines as compared to MCF7 cells. d Three different resistance-associated SNVs affecting the CTCF binding motif at anchors of differential interactions in TAMR and FASR cells. Arrow points to a nucleotide substitution in the CTCF motif obtained from Homer. e MCF7 (top) and FASR (bottom) Hi-C interactions map at 10 kb resolution on chromosome 17 showing a differential interaction, which is lost in FASR cells and associated with an SNV (rs201722399) located within a CTCF binding motif (marked with black arrow) that is lost in FASR cells (highlighted in orange and in the zoomed-in view). Additional three resistance-associated SNVs are located within this region that overlap a CTCF binding site (highlighted in yellow).
Fig. 3
Fig. 3. Differential interactions occur at altered ER binding sites.
a Motifs enriched at anchors of lost (left panel) and gained (right panel) interactions between TAMR and MCF7 cells. Known motifs obtained from Homer database and compared to matched, randomised background regions. b ESR1 mRNA expression downregulated in TAMR cells and lost in FASR cells (**P value < 0.001, SD, n = 3). c Venn diagram showing lost and gained ER binding sites (ERBS) in TAMR cells as compared to parental MCF7 cells identified with diffBind. ChIP-seq data obtained from Ross-Innes et al.. d Differential interactions (DIs) enrichment for ER binding sites lost and gained between TAMR and MCF7 cells. Asterisks represent the significance of fold-change enrichment at observed vs. random regions (permutation test). **P value < 0.001, *P value < 0.005. The numbers of ER binding sites located within each specific region are presented in the respective column. e Proportion of the lost and gained differential interactions between TAMR and MCF7 cells that overlap ER binding sites. f Gene Ontology terms enriched at ER-bound differential interactions gained in TAMR cells as compared to MCF7 cells.
Fig. 4
Fig. 4. Methylation associates with loss of ER binding and loss of interactions.
a Fold-change enrichment of differentially methylated regions (DMRs), which are hyper- or hypomethylated in TAMR cells as compared to MCF7 cells for ER binding sites (ERBS). *P value < 0.001. b Average profile plot showing methylation in TAMR (left panel) and MCF7 (right panel) around ER binding sites (ERBS) gained (pink) or lost (blue) in TAMR cells as compared to MCF7 cells. c Representative example showing loss of ER-bound interaction in TAMR cells at NCOR2 gene associated with DNA hypermethylation. Three differentially methylated regions (DMRs) that are present at ER-enhancer regions are associated with loss of ER binding and loss of interactions in TAMR cells. DNA hypermethylation at the anchors of lost differential interaction, overlapping region of ER binding in MCF7 cells can be observed in metastatic ER+ breast cancer patient tumour samples (n = 5) as compared to primary tumours (n = 4). d Representative example showing loss of ER-bound interaction in TAMR cells at ESR1 gene associated with DNA hypermethylation. Differentially methylated region (DMRs) at the ER-enhancer is associated with loss of ER binding and loss of interactions in TAMR cells. DNA hypermethylation at the anchor of lost differential interaction, overlapping a region of ER binding in MCF7 cells can be observed in metastatic ER+ breast cancer patient tumour samples (n = 5) as compared to primary tumours (n = 4).
Fig. 5
Fig. 5. Loss of TAD boundaries associates with decreased CTCF insulation.
a Overlap between TAD boundaries that were gained in TAMR and FASR cells as compared to MCF7 cells. b Overlap between TAD boundaries that were lost in TAMR and FASR cells as compared to MCF7 cells. c CTCF binding enrichment at stable and altered TAD boundaries, compared to random, distance-matched regions in three cell types. Asterisks represent the significance of fold-change enrichment at observed vs. random regions (permutation test **P value < 0.001; *P value < 0.05). The numbers of CTCF binding sites located within each specific region are presented in the respective column. d Representative example of a lost TAD boundary in endocrine-resistant cells. Hi-C interaction heatmaps visualised in JuiceBox for chromosome 3 for MCF7, TAMR and FASR cells aligned with CTCF ChIP-seq showing segmentation into TADs. Arrow marks a TAD boundary present in MCF7 cells and marked by high CTCF binding, which is lost in TAMR and FASR cells. Loss of TAD boundary is associated with loss of CTCF insulation at this region in TAMR and FASR cells. Per replicate data are shown in Supplementary Fig. 5h. Stable CTCF binding at TAD boundaries is marked by arrow as control loci. e Representative example of a gained TAD boundary in endocrine-resistant cells. Hi-C interaction heatmaps visualised in JuiceBox for chromosome 4 for MCF7 and FASR cells aligned with CTCF ChIP-seq showing segmentation into TADs. Arrow marks a region where three large domains in MCF7 cells are split into multiple sub-TADs in FASR cells. Ectopic TAD boundaries are associated with increased CTCF insulation at these regions in FASR cells. Per replicate data are shown in Supplementary Fig. 5i. Stable CTCF binding at TAD boundaries is marked by arrow as control loci.
Fig. 6
Fig. 6. Compartment structure reflects expression and ER binding.
a Average histone modification profiles over A and B compartments in MCF7 cells showing clear separation in active (A-type) and in-active (B-type) chromatin. b Pie chart showing the compartment changes in TAMR (left) and FASR (right) genomes as compared to MCF7 cells. “A” and “B” denote the open and closed compartments, respectively. “A to A” represents compartments that are open in both cell types, “B to B” represents compartments that are closed in both cell types, “A to B” denotes compartments that are open in MCF7 cells, but become closed in TAMR or FASR cells and “B to A” denotes compartments that are closed in MCF7 cells, but become open in TAMR or FASR cells. c Distribution of MCF7 vs. TAMR (left) and MCF7 vs. FASR (right) log2 fold change in gene expression for genes that change compartment status (“A to B” and “B to A”) or remain within the same compartment type (“stable”) (*P < 0.05). P value: Wilcox rank-sum test, SD. Source data are provided as a Source Data file. d An example of a region on chromosome 10 showing the compartment profiles at 25 kb resolution of parental MCF7 and endocrine-resistant TAMR and FASR cells, and MCF7 and FASR RNA-seq, showing a change in expression of genes located at regions that switch from A-type compartment status to B-type compartment status. e Histogram plot of average PC1 values around lost (left panel) and gained (right panel) ER binding sites (ERBS) in MCF7 and TAMR cells. f Different compartment switching regions between MCF7 and TAMR cells enrichment for common and unique ER binding compared to random, distance-matched regions. Asterisks represent the significance of fold-change enrichment at observed vs. random regions (permutation test) **P value < 0.001. *P value < 0.05. The numbers of ER binding sites located within each specific region are presented in the respective column. g An example of a region on chromosome 18 encompassing the PTPRM gene showing the compartment switching from “B-type” in parental MCF7 cells to “A-type” in endocrine-resistant TAMR cells that is associated with gain of ER binding in TAMR cells as compared to MCF7 cells. h PTPRM gene expression is lost in TAMR cells as compared to MCF7 cells (Student’s t test P = 0.0021, SD, n = 3). Kaplan−Meier curves displaying relapse-free survival for 335 patients with ER+ tumours receiving endocrine treatment based on PTPRM gene expression. Patients with tumours with high expression of PTPRM are shown in red and those with low expression are shown in black. P value as indicated, log rank test. Source data are provided as a Source Data file.
Fig. 7
Fig. 7. Model of 3D epigenome alterations in endocrine resistant breast cancer.
a Proposed model of epigenetic reprogramming in endocrine-resistant cells at the level of local enhancer−promoter interactions. Increased DNA methylation at ER-bound enhancer regions is associated with loss of ER binding and loss of ER-bound enhancer−promoter chromatin interactions, which results in decreased expression of ER-regulated genes. Gain of ER binding is associated with DNA hypomethylation and gain of ER-bound enhancer−promoter interactions and increased gene expression. b Proposed model of alterations of topologically associated domains (TADs) in endocrine-resistant cells. Loss or gain of CTCF insulation at TAD boundaries results in merging of adjacent domains or creation of new TAD boundaries. c Proposed model of epigenetic reprogramming in endocrine-resistant cells at the higher-level segmentation into A-type and B-type compartments. Regional reprogramming of ER binding is associated with altered compartment structure and long-range deregulation of gene expression.

References

    1. Lim E, et al. Pushing estrogen receptor around in breast cancer. Endocr. Relat. Cancer. 2016;23:T227–T241. doi: 10.1530/ERC-16-0427. - DOI - PubMed
    1. Traboulsi T, El Ezzy M, Gleason JL, Mader S. Antiestrogens: structure−activity relationships and use in breast cancer treatment. J. Mol. Endocrinol. 2017;58:R15–R31. doi: 10.1530/JME-16-0024. - DOI - PMC - PubMed
    1. Patel HK, Bihani T. Selective estrogen receptor modulators (SERMs) and selective estrogen receptor degraders (SERDs) in cancer treatment. Pharm. Ther. 2018;186:1–24. doi: 10.1016/j.pharmthera.2017.12.012. - DOI - PubMed
    1. Early Breast Cancer Trialists’ Collaborative G, et al. Relevance of breast cancer hormone receptors and other factors to the efficacy of adjuvant tamoxifen: patient-level meta-analysis of randomised trials. Lancet. 2011;378:771–784. doi: 10.1016/S0140-6736(11)60993-8. - DOI - PMC - PubMed
    1. Hurtado A, Holmes KA, Ross-Innes CS, Schmidt D, Carroll JS. FOXA1 is a key determinant of estrogen receptor function and endocrine response. Nat. Genet. 2011;43:27–33. doi: 10.1038/ng.730. - DOI - PMC - PubMed

Publication types

MeSH terms