. 2020 Jan 16;11(1):332.
doi: 10.1038/s41467-019-14029-w.

A Wnt-mediated transformation of the bone marrow stromal cell identity orchestrates skeletal regeneration

Affiliations

A Wnt-mediated transformation of the bone marrow stromal cell identity orchestrates skeletal regeneration

Yuki Matsushita et al. Nat Commun. .

Abstract

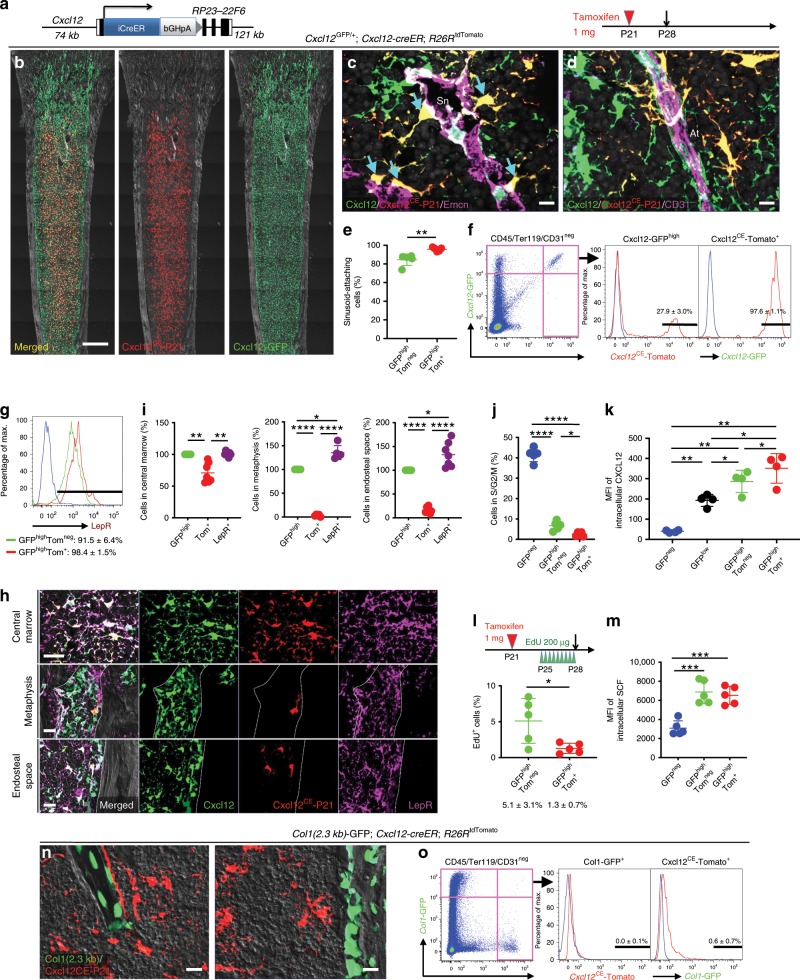
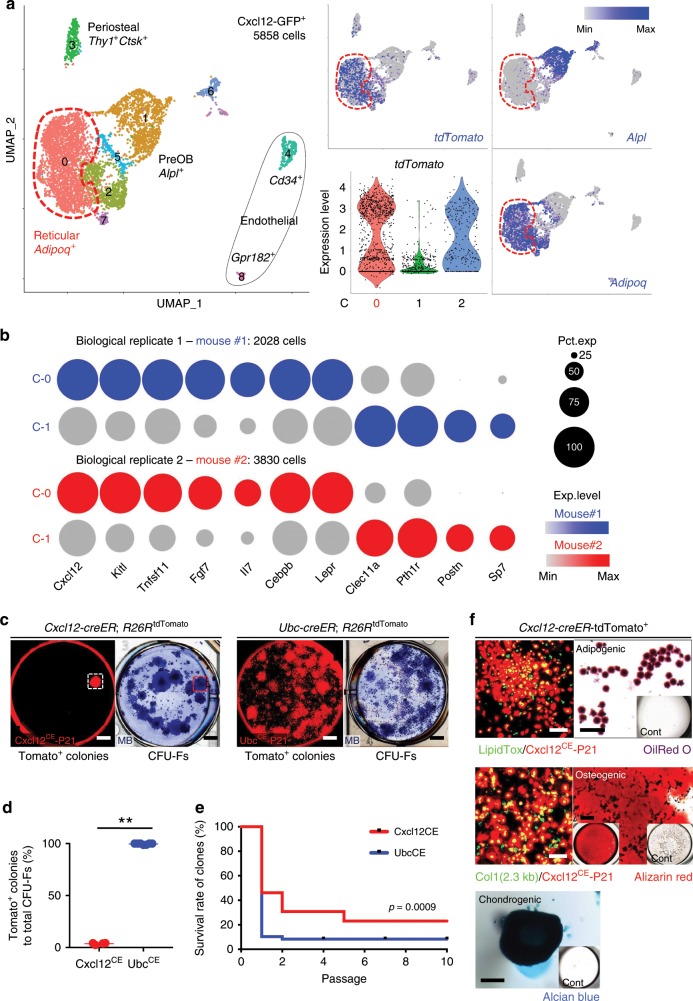
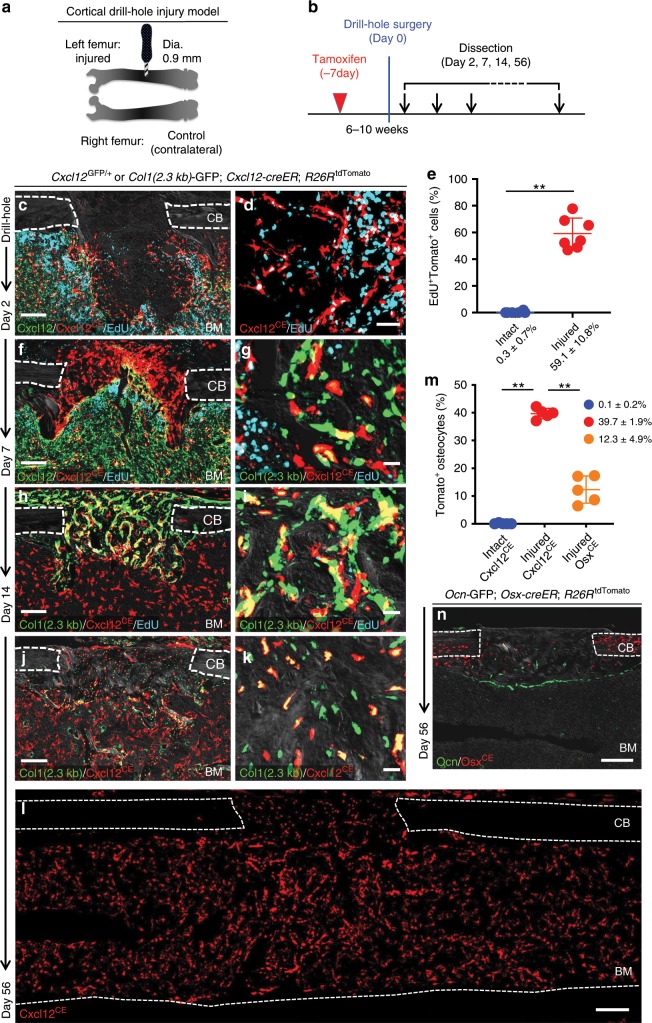
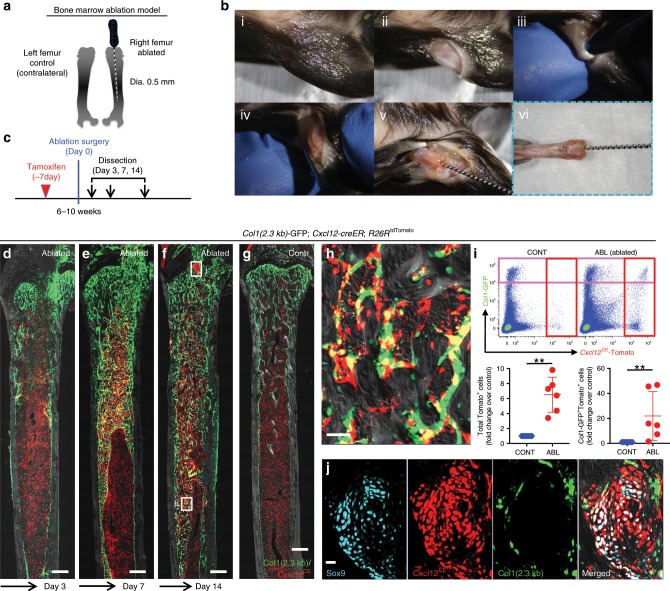
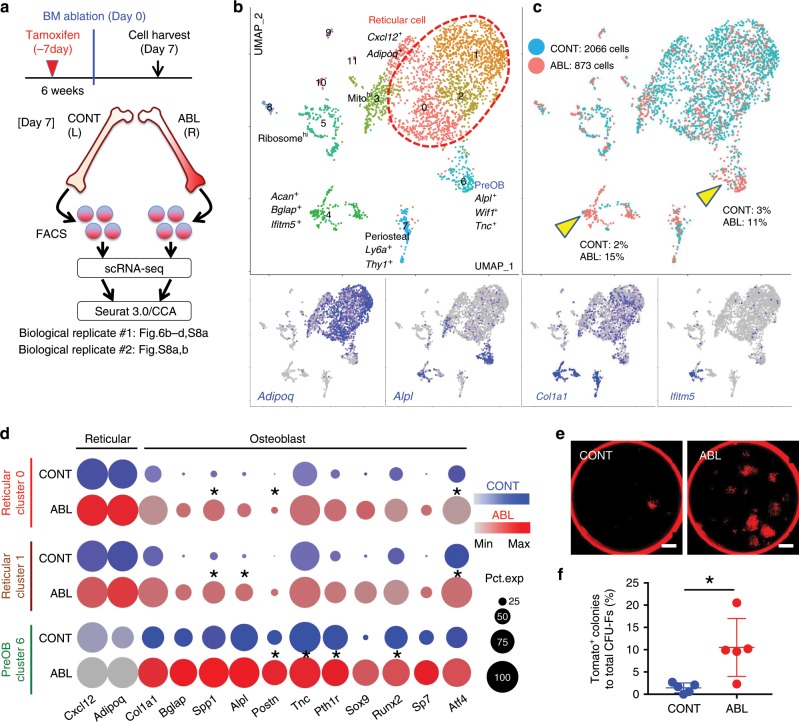
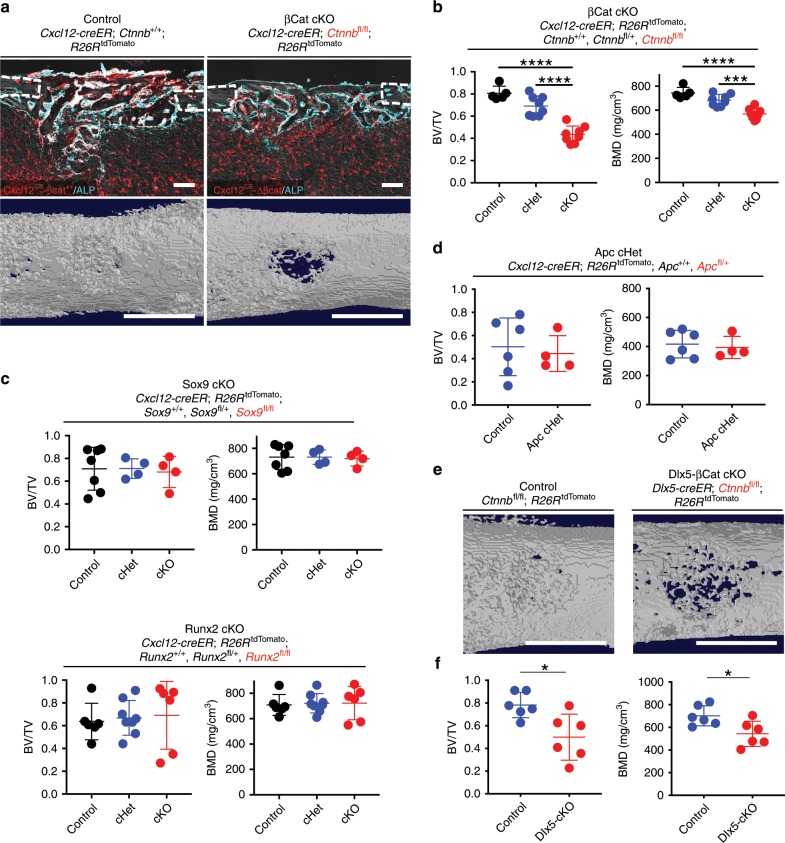
Bone marrow stromal cells (BMSCs) are versatile mesenchymal cell populations underpinning the major functions of the skeleton, a majority of which adjoin sinusoidal blood vessels and express C-X-C motif chemokine ligand 12 (CXCL12). However, how these cells are activated during regeneration and facilitate osteogenesis remains largely unknown. Cell-lineage analysis using Cxcl12-creER mice reveals that quiescent Cxcl12-creER+ perisinusoidal BMSCs differentiate into cortical bone osteoblasts solely during regeneration. A combined single cell RNA-seq analysis demonstrate that these cells convert their identity into a skeletal stem cell-like state in response to injury, associated with upregulation of osteoblast-signature genes and activation of canonical Wnt signaling components along the single-cell trajectory. β-catenin deficiency in these cells indeed causes insufficiency in cortical bone regeneration. Therefore, quiescent Cxcl12-creER+ BMSCs transform into osteoblast precursor cells in a manner mediated by canonical Wnt signaling, highlighting a unique mechanism by which dormant stromal cells are enlisted for skeletal regeneration.


Conflict of interest statement

The authors declare no competing interests.

Figures

Fig. 1
Fig. 1. Cxcl12-creER marks a quiescent subset of CXCL12+LepR+ BMSCs.
a Structure of Cxcl12-iCreER-bGHpA bacterial artificial chromosome (BAC) transgene. bo Short-chase analysis of Cxcl12-creER+ cells. b Cxcl12GFP/+; Cxcl12-creER; R26RtdTomato (pulsed at P21) distal femurs with growth plates on top. Gray: DIC. Scale bar: 500 µm. n = 3 mice. c, d Immunostaining for endomucin (Emcn, c) and CD31 (d). Sn: sinusoids, At: arterioles. Arrows: sinusoid-attaching GFPhightdTomato+ cells. Gray: DAPI. Scale bar: 10 µm. n = 5 mice. e Percentage of cells attaching Emcn+ sinusoids among GFPhightdTomatoneg (green) or GFPhightdTomato+ (red) cells. n = 5 mice. f Flow cytometry analysis of CD45/Ter119/CD31neg bone marrow cells. Blue lines: control cells. n = 5 mice. g Leptin receptor (LepR) expression based on flow cytometry analysis. Blue line: isotype control. n = 3 mice. h LepR staining. Gray: DAPI (Center), DIC (metaphysis and endosteal zone). Scale bar: 20 µm. i Quantification based on histology. Percentage of BMSCs expressing Cxcl12-GFP (green dots), Cxcl12CE-tdTomato (red dots) and LepR (purple dots). n = 7 fields from four mice (central marrow and endosteal surface), n= 5 fields from 4 mice (metaphysis). j Percentage of CD45/Ter119/CD31neg subpopulations in S/G2/M phase. n = 5 mice. k Intracellular CXCL12 protein levels of CD45/Ter119/CD31neg subpopulations. MFI: median fluorescence intensity. n = 4 mice. l EdU serial pulse assay of Cxcl12-creER+ cells. Cxcl12-creER; R26RtdTomato mice were pulsed with tamoxifen at P21, then with EdU every 8 h for 3 days prior to analysis. Percentage of EdU+ cells among GFPhightdTomatoneg (green) or GFPhightdTomato+ (red) cells. n = 5 mice. m Intracellular SCF protein levels of CD45/Ter119/CD31neg subpopulations. MFI median fluorescence intensity. n = 5 mice. n, o Col1(2.3 kb)-GFP; Cxcl12-creER; R26RtdTomato. n Left panel: trabecular bone. Right panel: endosteal space. Gray: DIC. Scale bar: 20 µm. n = 4 mice. o Flow cytometry analysis of CD45/Ter119/CD31neg cells harvested from Col1(2.3kb)-GFP; Cxcl12-creER; R26RtdTomato at P28 (pulsed at P21) bone marrow. Blue lines: control cells. n = 4 mice. ****p < 0.0001, ***p < 0.001, **p < 0.01, *p < 0.05, two-tailed, Mann–Whitney’s U test (e, l). Two-tailed, one-way ANOVA followed by Tukey’s post hoc test (ik, m). All data are presented as mean ± s.d. Source data are provided as a Source Data file.
Fig. 2
Fig. 2. Single-cell characterization of Cxcl12-creER+ BMSCs.
a Single-cell RNA-seq analysis, UMAP-based visualization of major classes of Cxcl12-GFP+ cells (Clusters 0–8). Red dotted contour: reticular cells (Cluster 0). Center panels: tdTomato expression, feature plot (top), violin plot (Clusters 0–2) (bottom). Right panels: feature plots. Blue: high expression. n = 5858 cells merged from two biological replicates (Mouse #1: 2028 cells, Mouse #2: 3830 cells). b Split-dot-based visualization of representative gene expression in Cluster 0 (C-0, reticular cells) and Cluster-1 (C-1, pre-osteoblasts). Upper: Mouse #1, Lower: Mouse #2. Circle size: percentage of cells expressing a given gene in a given cluster (0–100%), color density: expression level of a given gene. cf CFU-F assay. c Cxcl12CE-tdTomato+ (left) and UbcCE-tdTomato+ (right) bone marrow cells at P28 (pulsed at P21). Scale bar: 5 mm. d percentage of tdTomato+ colonies among total CFU-Fs. n = 4 (Cxcl12CE), n = 7 (UbcCE) mice. **p < 0.01, two-tailed, Mann–Whitney’s U test. Data are presented as mean ± s.d. e Survival curve of individual tdTomato+ clones over serial passages. n = 26 (Cxcl12CE), n = 48 (UbcCE) clones. Gehan–Breslow–Wilcoxon test. f In vitro trilineage differentiation assay of Cxcl12CE-tdTomato+ clones (Passage 2–7). Upper panels: Adipogenic conditions. LipidTOX staining (left). Green: LipidTOX-Alexa488, red: tdTomato. Oil red O staining (Right). Center panels: Osteogenic conditions. Green: Col1(2.3 kb)-GFP, red: tdTomato. Alizarin Red staining (right). Lower panel: Chondrogenic conditions, Alcian Blue staining. Insets: differentiation medium negative controls. Scale bar: 200 µm. n = 12 clones. Source data are provided as a Source Data file.
Fig. 3
Fig. 3. Cell-fate analysis reveals dormancy of Cxcl12-creER+ BMSCs.
al Long-chase analysis of Cxcl12-creER+ cells. ac Col1(2.3 kb)-GFP; Cxcl12-creER; R26RtdTomato distal femurs with growth plates on top, analyzed at 1Y. Pulsed at P3 (a), P21 (b), and 8 W (c). Yellow double arrows: tdTomatoneg area beneath growth plates, white brackets: tdTomato+ domain in marrow space. Scale bar: 500 µm. Gray: DIC. d Quantification of tdTomato+ reticular cells in marrow space at 1Y, based on distance from growth plate. Pulsed at P3 (blue line), P21 (green line) or 8 W (red line). n = 6 (P3, P21-pulsed), n = 5 (8W-pulsed) mice. e Cxcl12GFP/+; Cxcl12-creER; R26RtdTomato bone marrow at 1 y (pulsed at P21), central marrow space. Gray: DAPI. Scale bar: 20 µm. n = 3 mice. f Quantification of tdTomato+ reticular cells in marrow space during extended chase, pulsed at 8 W. n = 4 (9 W), n = 5 (3 M), n = 3 (6 M, 1 y, and 1 y 6 M) mice. g Col1(2.3 kb)-GFP; Cxcl12-creER; R26RtdTomato bone marrow at 1 y (pulsed at P21), endosteal space. Scale bar: 20 µm. n = 4 mice. h Percentage of Col1(2.3 kb)-GFP+tdTomato+ cells per total Col1(2.3 kb)-GFP+ cortical bone osteoblasts. (Left): flow cytometry. n = 4 (+1 W), n = 3 (+8 W) mice. (Right): labeled at P3, P21, 8 W, and 5 M, analyzed at 1 y 6 M. OB osteoblasts, OCY osteocytes. n = 3 per group. i Col1(2.3kb)-GFP; Cxcl12-creER; R26RtdTomato distal femurs at 9 W (pulsed at 8 W). 1 (endosteal area): boxed area on left panel. Gray: DIC. Scale bar: 500 µm (left), 20 µm (right). n = 3 mice. j Cxcl12-creER; R26RtdTomato distal femur bone marrow at 1Y (pulsed at 8 W). Lower left panel: central marrow space with Cxcl12GFP/+, right panels: endosteal space and trabecular bone with Col1(2.3kb)-GFP. Gray: DIC. Scale bar: 20 µm. n = 3 mice. k, l Percentage of Col1(2.3 kb)-GFP+tdTomato+ cells per total Col1(2.3 kb)-GFP+ cells by using flow cytometry (k). n = 3 (+2 days), n = 4 (+1 W), n = 7 (+4 W) and n = 6 (+8 W) mice. l Labeled at 8 W, analyzed at 9 W, 3 M, 6 M, 1 y, and 1 y 6 M. n = 3 (9 W, 3 M, 1 y, and 1 y 6 M), n = 4 (6 M) mice. ****p < 0.0001, ***p < 0.001, two tailed, one-way ANOVA followed by Tukey’s post hoc test (f, h, k, l). Two-tailed, Mann–Whitney’s U test (h). All data are presented as mean ± s.d. Source data are provided as a Source Data file.
Fig. 4
Fig. 4. Cortical bone regenerative responses of Cxcl12-creER+ BMSCs.
(an) Fates of Cxcl12-creER+ cells or Osx-creER+ cells during cortical bone regeneration after drill-hole injury. a Experimental schemes for drill-hole cortical injury model. b Timeline for tamoxifen injection, drill-hole injury and analysis. Cxcl12GFP/+; Cxcl12-creER; R26RtdTomato (c, f) or Col1(2.3 kb)-GFP; Cxcl12-creER; R26RtdTomato (gk) femur diaphyseal cortical bones (pulsed at 7 days before surgery) with periosteum on top. CB cortical bone, BM bone marrow. Gray: DIC. n = 5 mice per each group. c, d Injured area at 2 days after injury, femurs with EdU administration shortly before analysis. Scale bar: 200 µm (c), 50 µm (d). e Quantification of EdU+tdTomato+ cells. n = 6 (Intact), n = 7 (Injured). EdU was administered twice (6 and 3 h) prior to analysis. **p < 0.01, two-tailed Mann–Whitney’s U test. f, g Injured area at 7 days after injury, femurs with EdU administration shortly before analysis. Scale bar: 200 µm (f), 20 µm (g). h, i Injured area at 14 days after injury, femurs with EdU administration shortly before analysis. Scale bar: 200 µm (h), 20 µm (i). jl Injured cortical bone at 56 days after injury. Scale bar: 200 µm (h, l), 20 µm (i). m Number of tdTomato+ cells within intact and injured are of Cxcl12-creER; R26RtdTomato cortical bone (blue and red dots, respectively) or injured area of Osx-creER; R26RtdTomato cortical bone (orange dots). n = 5 mice per group. **p < 0.01, two-tailed, Mann–Whitney’s U test. n Injured cortical bone at 56 days after injury, Ocn-GFP; Osx-creER; R26RtdTomato femurs. All data are presented as mean ± s.d. Source data are provided as a Source Data file.
Fig. 5
Fig. 5. Cxcl12-creER+ BMSCs respond to bone marrow ablation-induced osteogenesis.
ac Experimental schemes and procedures of bone marrow ablation model. a Right femurs were operated, while left femurs were unoperated and used as internal control. (b, i–vi): Step-by-step demonstration of surgical procedures. c Timeline for tamoxifen injection, ablation surgery and analysis. dj Col1(2.3 kb)-GFP; Cxcl12-creER; R26RtdTomato distal femur bone marrow (pulsed at 7 days before surgery) with growth plates on top. Three days (d), 7 days (e), and 14 days after surgery (f, h). h Ablated area, boxed area in (f). Scale bar: 50 µm. g contralateral control side. Gray: DIC. Scale bar: 500 µm. n = 4 (Day 3), n = 3 (Day 7), n = 5 (Day 14), n = 3 (Conrol) mice. i Flow cytometry analysis of CD45/Ter119/CD31neg bone marrow cells. Lower panels: fold change of total tdTomato+ cells (left) or Col1-GFP+tdTomato+cells (right) in ablated side over contralateral control side. Scale bar: 20 µm. n = 6 mice. **p < 0.01, two-tailed, Mann–Whitney’s U test. Data are presented as mean ± s.d. j Regenerated cartilaginous tissue adjacent to growth plate. Gray: DIC. Source data are provided as a Source Data file.
Fig. 6
Fig. 6. Injury-induced identity conversion of Cxcl12-creER+ BMSCs.
ad Single-cell RNA-seq analyses of lineage-traced Cxcl12-creER+ cells. a Cxcl12CE-tdTomato+ cells were isolated from contralateral (CONT) and ablated (ABL) femurs separately at 7 days after marrow ablation. Two datasets were integrated by Seurat/CCA. b, c UMAP-based visualization of major classes of mesenchymal Cxcl12CE-tdTomato+ cells (Cluster 0–11). Left panel, red dotted contour: reticular (Clusters 0–2). Lower panels: feature plots. Blue: high expression. Right panel: cells colored by conditions (CONT, ABL). Biological replicate 1, n = 2939 cells (CONT: 2066 cells, ABL: 873 cells), pooled from n = 7 mice. d Split-dot-based visualization of representative gene expression. Clusters 0 and 1 (reticular) and Cluster 6 (pre-osteoblast) shown for reticular-signature genes (Cxcl12, Adipoq) and osteoblast-signature genes (Col1a1, Bglap, Spp1, Alpl, Postn, Tnc, Pth1r, Sox9, Runx2, Sp7, Atf4). *p < 0.0001, Wilcoxon rank sum test. Circle size: percentage of cells expressing a given gene in a given cluster (0–100%), Color density: expression level of a given gene. e, f CFU-F assay of Cxcl12CE-tdTomato+ bone marrow cells, harvested from contralateral (CONT, left) and ablated (ABL, right) femurs at Day 7 (pulsed at Day-7). Scale bars: 5 mm. g Percentage of tdTomato+ colonies among total CFU-Fs. n = 5 mice per group. *p < 0.05, two-tailed, Mann–Whitney’s U test. Data are presented as mean ± s.d. Source data are provided as a Source Data file.
Fig. 7
Fig. 7. Cxcl12-creER+ BMSCs transform into a skeletal stem cell-like state.
a Inducible partial cell ablation of Cxcl12-creER+ stromal cells using an inducible diphtheria toxin fragment A (DTA) allele. Flow cytometry-based verification of iDTA-mediated cell ablation of Cxcl12-creER+ stromal cells. n = 3 (tdT), n = 6 (DTA) mice. *p < 0.05, two-tailed, Mann–Whitney’s U test. b, c DTA-mediated ablation of Cxcl12-creER+ cells during cortical bone regeneration. Rosa26lsl-tdTomato/iDTA (Control) and Cxcl12-creER; Rosa26lsl-tdTomato/iDTA (DTA) femur diaphyseal cortical bones, 14 days after cortical drill-hole surgery (pulsed at 7 days before surgery). b Cortical bone injured areas. Upper panels: alkaline phosphatase (ALP) staining. Gray: DIC. Scale bar: 200 µm. Lower panels: 3D-µCT. Scale bar: 1 mm. c Bone volume/tissue volume (BV/TV, left) and bone mineral density (BMD, right) of the injured area. n = 6 (Control), n = 4 (DTA) mice. **p < 0.01, two-tailed, Mann–Whitney’s U test. di Single-cell RNA-seq analyses of lineage-traced Cxcl12-creER+ cells. Cxcl12CE-tdTomato+ cells were isolated from ablated (ABL) femurs at 14 days after marrow ablation. e UMAP-based visualization of major classes of mesenchymal Cxcl12CE-tdTomato+ cells (Clusters 0–9). Red dotted contour: reticular cells, green dotted contour: preosteoblasts. n = 1825 cells pooled from n = 7 mice. f Feature plots of skeletal stem cell marker genes. g Heatmap of representative pseudotime-dependent genes. h Pseudotime and single cell trajectory analysis by Monocle. i Most significant Gene Ontology (GO) terms (Biological Process) based on DAVID functional annotation of differentially expressed genes (DEGs). Black: general, red: Wnt signaling-related, blue: bone-related terms. All data are presented as mean ± s.d. Source data are provided as a Source Data file.
Fig. 8
Fig. 8. Wnt-mediated transformation orchestrates bone regeneration.
a, b Functional analysis of Wnt/β-Catenin signaling in Cxcl12-creER+ cells during cortical bone regeneration. Cxcl12-creER; Ctnnb+/+; R26RtdTomato (Control, left), Cxcl12-creER; Ctnnbfl/fl; R26RtdTomato (βcat cKO, right) femur diaphyseal cortical bones, 14 days after cortical drill-hole surgery (pulsed at 7 days before surgery). a Cortical bone injured areas. Upper panels: alkaline phosphatase (ALP) staining. Gray: DIC. Scale bar: 200 µm. Lower panels: 3D-µCT. Scale bar: 1 mm. b Bone volume/tissue volume (BV/TV, left) and bone mineral density (BMD, right) of the injured area. n = 4 (Control), n = 8 (Cxcl12-creER; Ctnnbfl/+; R26RtdTomato, βCat cHet) mice, n = 8 (βCat cKO) mice. c Functional analysis of Sox9 and Runx2 in Cxcl12-creER+ cells during cortical bone regeneration. Cxcl12-creER; Sox9+/+ or Runx2+/+;R26RtdTomato (Control, left), Cxcl12-creER; Sox9fl/+ or Runx2fl/+;R26RtdTomato (Sox9 cHet or Runx2 cHet, center) and Cxcl12-creER; Sox9fl/fl or Runx2fl/fl; R26RtdTomato (Sox9 cKO or Runx2 cKO, right) femur diaphyseal cortical bones, 14 days after cortical drill-hole surgery (pulsed at 7 days before surgery). BV/TV (left) and BMD (right) of the injured area. n = 7 (Sox9 Control), n = 4 (Sox9 cHet, cKO) mice. n = 6 (Runx2 Control, cKO), n = 8 (Runx2 cHet) mice. d Functional analysis of Apc in Cxcl12-creER+ cells during cortical bone regeneration. Cxcl12-creER; Apc+/+; R26RtdTomato (Control, left), Cxcl12-creER; Apcfl/+; R26RtdTomato (Apc cHet, right) femur diaphyseal cortical bones, 7 days after cortical drill-hole surgery (pulsed at 7 days before surgery). BV/TV (left) and BMD (right) of the injured area. n = 6 (Control), n = 4 (Apc cHet) mice. e, f Functional analysis of Wnt/β-Catenin signaling in Dlx5-creER+ cells during cortical bone regeneration. Ctnnbfl/fl; R26RtdTomato (Control, left), Dlx5-creER; Ctnnbfl/fl; R26RtdTomato (Dlx5-βcat cKO, right) femur diaphyseal cortical bones, 14 days after cortical drill-hole surgery (pulsed at 7 days before surgery). e 3D-µCT. Lower panels: BV/TV (left) and BMD (right) of the injured area. Scale bar: 1 mm. n = 6 mice per group. ****p < 0.0001, ***p < 0.001, *p < 0.05, two-tailed, one-way ANOVA followed by Tukey’s post hoc test (b, c). Two-tailed, Mann–Whitney’s U test (d, f). All data are presented as mean ± s.d. Source data are provided as a Source Data file.
Fig. 9
Fig. 9. A Wnt-mediated conversion of stromal cell identity orchestrates skeletal regeneration.
a Quiescent CXCL12+ bone marrow stromal cells (BMSCs) in perisinusoidal space are marked by Cxcl12-creER upon tamoxifen injection. These cells are preferentially localized in a non-endosteal location of the marrow space, associated with a reticular morphology, abundant cytokine expression and little colony-forming activities. These cells do not become cortical bone osteoblasts in homeostasis, but can be readily converted to marrow adipocytes. b A proposed diagram of the bone marrow stromal cell lineage. In homeostasis, CXCL12high reticular cells and COL1A1high osteoblasts represent two opposite differentiated states of the bone marrow stromal cell lineage. The transition between these two cell types is continuous, wherein intermediate-state cells represent a precursor cell population. c Wnt-mediated cellular plasticity of CXCL12+ reticular cells during injury responses. In homeostasis, Cxcl12-creER+ reticular cells are in a Wnt-inhibitory state by expressing potent Wnt inhibitors, such as Sfrp1, Sfrp2, and Sfrp4. During injury responses, Cxcl12-creER + reticular cells are brought into a reticular-osteoblast hybrid state by injury-induced cues, associated with upregulation of osteoblast-signatures and a critical canonical Wnt component, β-catenin. Subsequently, Wnt/β-catenin signaling induces cell identity conversion of Cxcl12-creER+ reticular cells into pre-osteoblasts, which are featured by a skeletal stem cell-like state with partial commitment to the osteoblast lineage. These cells can be recruited to cortical bone defect and functionally contribute to skeletal regeneration.

References

    1. Kfoury Y, Scadden DT. Mesenchymal cell contributions to the stem cell niche. Cell Stem Cell. 2015;16:239–253. doi: 10.1016/j.stem.2015.02.019. - DOI - PubMed
    1. Krebsbach PH, Kuznetsov SA, Bianco P, Robey PG. Bone marrow stromal cells: characterization and clinical application. Crit. Rev. Oral Biol. Med. 1999;10:165–181. doi: 10.1177/10454411990100020401. - DOI - PubMed
    1. Greenbaum A, et al. CXCL12 in early mesenchymal progenitors is required for haematopoietic stem-cell maintenance. Nature. 2013;495:227–230. doi: 10.1038/nature11926. - DOI - PMC - PubMed
    1. Asada Noboru, Kunisaki Yuya, Pierce Halley, Wang Zichen, Fernandez Nicolas F., Birbrair Alexander, Ma’ayan Avi, Frenette Paul S. Differential cytokine contributions of perivascular haematopoietic stem cell niches. Nature Cell Biology. 2017;19(3):214–223. doi: 10.1038/ncb3475. - DOI - PMC - PubMed
    1. Ding L, Saunders TL, Enikolopov G, Morrison SJ. Endothelial and perivascular cells maintain haematopoietic stem cells. Nature. 2012;481:457–462. doi: 10.1038/nature10783. - DOI - PMC - PubMed

Publication types

MeSH terms