. 2020 Jan 16;10(1):457.
doi: 10.1038/s41598-019-56555-z.

Microendoscopy detects altered muscular contractile dynamics in a mouse model of amyotrophic lateral sclerosis

Affiliations

Microendoscopy detects altered muscular contractile dynamics in a mouse model of amyotrophic lateral sclerosis

Xuefeng Chen et al. Sci Rep. .

Abstract

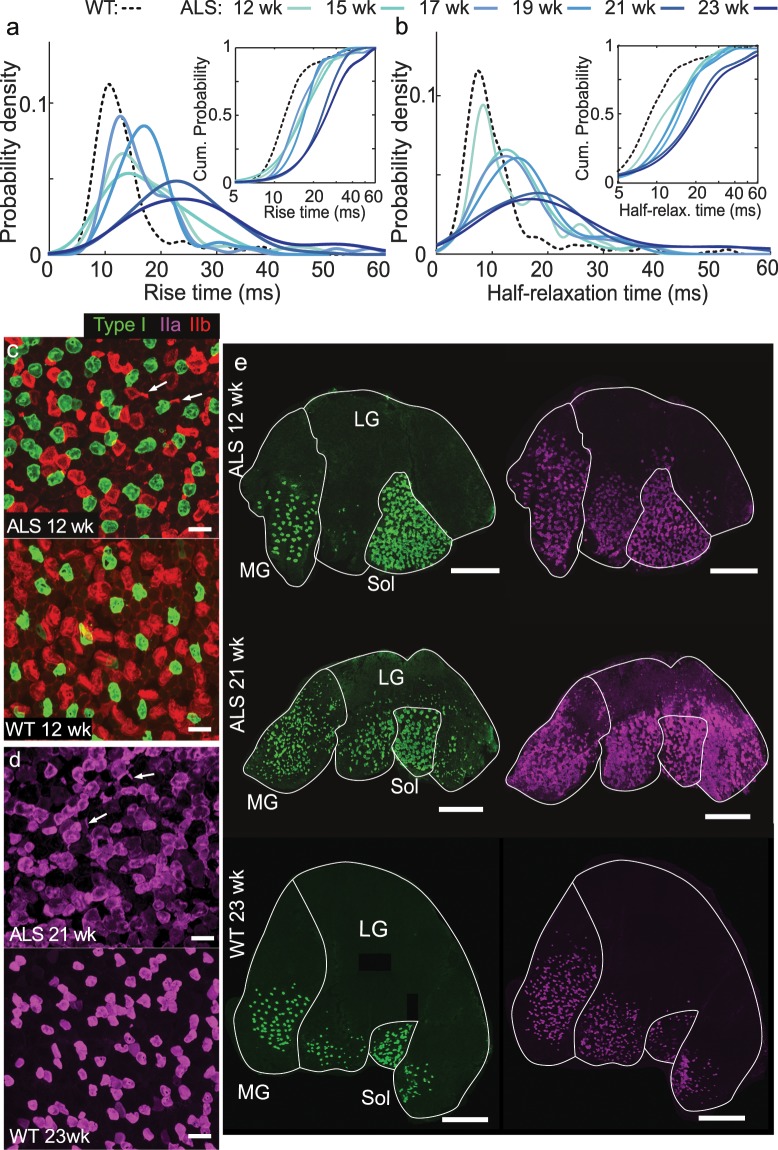
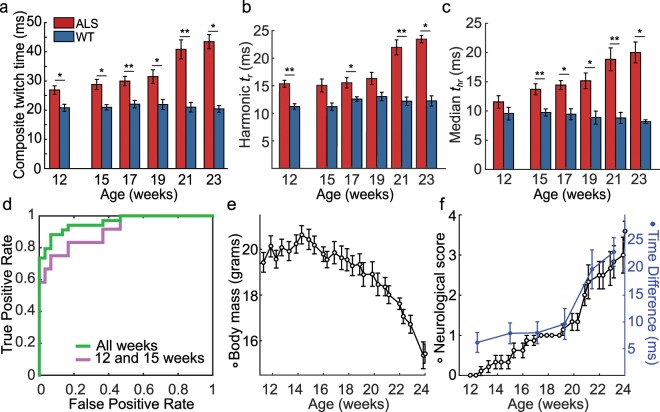
Amyotrophic lateral sclerosis (ALS) is a fatal disease involving motor neuron degeneration. Effective diagnosis of ALS and quantitative monitoring of its progression are crucial to the success of clinical trials. Second harmonic generation (SHG) microendoscopy is an emerging technology for imaging single motor unit contractions. To assess the potential value of microendoscopy for diagnosing and tracking ALS, we monitored motor unit dynamics in a B6.SOD1G93A mouse model of ALS for several weeks. Prior to overt symptoms, muscle twitch rise and relaxation time constants both increased, consistent with a loss of fast-fatigable motor units. These effects became more pronounced with disease progression, consistent with the death of fast fatigue-resistant motor units and superior survival of slow motor units. From these measurements we constructed a physiological metric that reflects the changing distributions of measured motor unit time constants and effectively diagnoses mice before symptomatic onset and tracks disease state. These results indicate that SHG microendoscopy provides a means for developing a quantitative, physiologic characterization of ALS progression.


Conflict of interest statement

G.N.S., S.L.D. and M.J.S. have co-founded Enspectra Health, Inc. to disseminate the imaging technology described here and have a financial interest in the company.

Figures

Figure 1
Figure 1
Visualization of single motor twitches by using SHG imaging. (a) A Yb-ion laser delivers ultrashort-pulsed, near-infrared illumination to the handheld SHG microscope via an optical illumination fiber. The microscope directs the laser light into a 20-gauge microendoscope probe. The probe has a microprism near its tip for imaging in the direction perpendicular to the probe’s axis and is inserted into the muscle of interest. SHG signals return through a signal collection optical fiber, which routes the signals to a photomultiplier tube (PMT) for detection. An electrical stimulator is connected to the probe and delivers current that is used to stimulate the muscle. (b) We performed SHG microendoscopy in the gastrocnemius muscle. (c,d) To visualize motor unit twitches, we swept the laser illumination in a line-scanning pattern of 1.09 kHz across the muscle tissue, yielding space-time plots revealing the twitch time courses of the muscle’s individual sarcomeres. The examples shown are averaged images from B6.SOD1G93A, (c), and wild-type mice, (d). Yellow triangle marks onset of the electrical stimulation. Blue line is the computationally extracted twitch time course. Scale bars: 30 ms horizontal, 5 µm vertical. (e) Example twitch time course fit from (d). The twitch rise time, tr, is the duration from stimulation delivery (0 ms) to peak sarcomere displacement. The half-relaxation time, thr, is the time from peak displacement to half of peak displacement. (f) We imaged B6.SOD1G93A and wild-type mice at 6 time points. The numbers denote individual mice and show when each mouse underwent SHG imaging.
Figure 2
Figure 2
Twitch rise times and half-relaxation times increase with ALS progression. (a,b) Estimated probability density and cumulative distribution functions via kernel density estimation (insets) of motor unit (a) rise times and (b) half-relaxation times. We estimated the curves for wild-type (WT) mice based on all twitches acquired from the WT mice across from all six time points. We estimated the curve for the B6.SOD1G93A mice based on all twitches taken at each individual time point. In the B6.SOD1G93A mice, the distributions shifted towards longer rise times as the mice aged. Median rise times at 21 and 23 weeks were significantly greater than at 12, 15, 17, and 19 weeks; Half-relaxation times at 21 and 23 weeks were greater than at 12 weeks, and half-relaxation times at 23 weeks were greater than at from 15 weeks (p < 0.05, Dunn’s test with Bonferroni correction for multiple comparisons, n = 30–54 motor units at each time point). The distributions of time constants were slower at each time point for the B6.SOD1G93A mice than for WT mice (p = 4·10−4; 7·10−5; 7·10−4; 4·10–8; 2·10−18; 2·10−11 for rise times, p = 0.01; 6·10−6; 3·10−7; 6·10−7; 6·10−13; 4·10−9 for half-relaxation times, two sample Kolomogov–Smirnov test, n = 222, 43, 45, 54, 39, 55, 30 motor units in the WT and each time point of B6.SOD1G93A groups). (c) Representative histological image from the medial gastrocnemius of a 12-week B6.SOD1G93A mouse and 12-week wild-type mouse. Arrows point to atrophy of type IIb muscle fibers stained with BF-F3 primary antibody from the B6.SOD1G93A mouse. Scale bars 100 µm. (d) Representative histological image from the medial gastrocnemius of a 21-week old B6.SOD1G93A mouse and a 23-week wild-type mouse. Arrows point to atrophy of type IIa muscle fibers (SC-71 primary antibody), and large clusters of type IIa fibers indicate fiber type grouping present in the B6.SOD1G93A mouse. Scale bar 100 µm. (e) Staining for type I (BA–D5 primary antibody) and type IIa fibers in the medial gastrocnemius (MG), lateral gastrocnemius (LG) and soleus (SOL), of B6.SOD1G93A mice at 12 and 21 weeks shows the proliferation of type I and type IIa fibers into new regions of the muscle, especially the LG. Image from 23 week wild-type mouse shown as comparison for age effects. Scale bar 1 mm.
Figure 3
Figure 3
Composite twitch time provides an effective diagnostic and monitoring metric. (a–c) Mean ± s.e.m.values of the composite twitch time, a, harmonic mean rise time, b, and median half-relaxation times, c, from individual B6.SOD1G93A and WT mice. *p < 0.05, **p < 0.01, rank sum test. n = 5 WT mice and n = 6 B6.SOD1G93A mice (5 repeated, except at 23 weeks which had 4 B6.SOD1G93A mice. n = 3–19 motor units per mouse; median of 7 per mouse). (d) Receiver operating curve attained using the composite twitch time as a metric for distinguishing normalcy and the ALS disease state by using measurements from the B6.SOD1G93A mice taken at the first two time points [Area Under the Cuve (AUC) = 0.91; purple] or all time points (green; AUC = 0.96). (e,f) Mean body mass of B6.SOD1G93A mice (e), and mean neurological scores, where 1 is initial tremors in B6.SOD1G93A mice (Methods), (f), of ALS mice (black filled dots) compared to the difference in composite twitch time between B6.SOD1G93A and all wild-type mice (blue dots). All points are mean ± s.e.m.

References

    1. Rowland LP, Shneider NA. Amyotriphic Lateral Sclerosis. N. Engl. J. Med. 2001;344:1688–1700. doi: 10.1056/NEJM200105313442207. - DOI - PubMed
    1. Miller, R. G., Mitchell, J. D. & Moore, D. H. Riluzole for amyotrophic lateral sclerosis (ALS)/motor neuron disease (MND). Cochrane Database Syst. Rev., CD001447 (2012). - PubMed
    1. Petrov D, Mansfield C, Moussy A, Hermine O. AALS clinical trials review: 20 years of failure. Are we any closer to registering a new treatment. Front. Aging Neurosci. 2017;9:1–11. doi: 10.3389/fnagi.2017.00068. - DOI - PMC - PubMed
    1. Rothstein JD. Edaravone: A new drug approved for ALS. Cell. 2017;171:725. doi: 10.1016/j.cell.2017.10.011. - DOI - PubMed
    1. Genç B, Özdinler PH. Moving forward in clinical trials for ALS: motor neurons lead the way please. Drug Discov. Today. 2014;19:441–449. doi: 10.1016/j.drudis.2013.10.014. - DOI - PMC - PubMed

Publication types