. 2020 Jan 1;11(4):893-905.
doi: 10.7150/jca.34188. eCollection 2020.

DNA sensors, crucial receptors to resist pathogens, are deregulated in colorectal cancer and associated with initiation and progression of the disease

Affiliations

DNA sensors, crucial receptors to resist pathogens, are deregulated in colorectal cancer and associated with initiation and progression of the disease

Liangmei He et al. J Cancer. .

Abstract

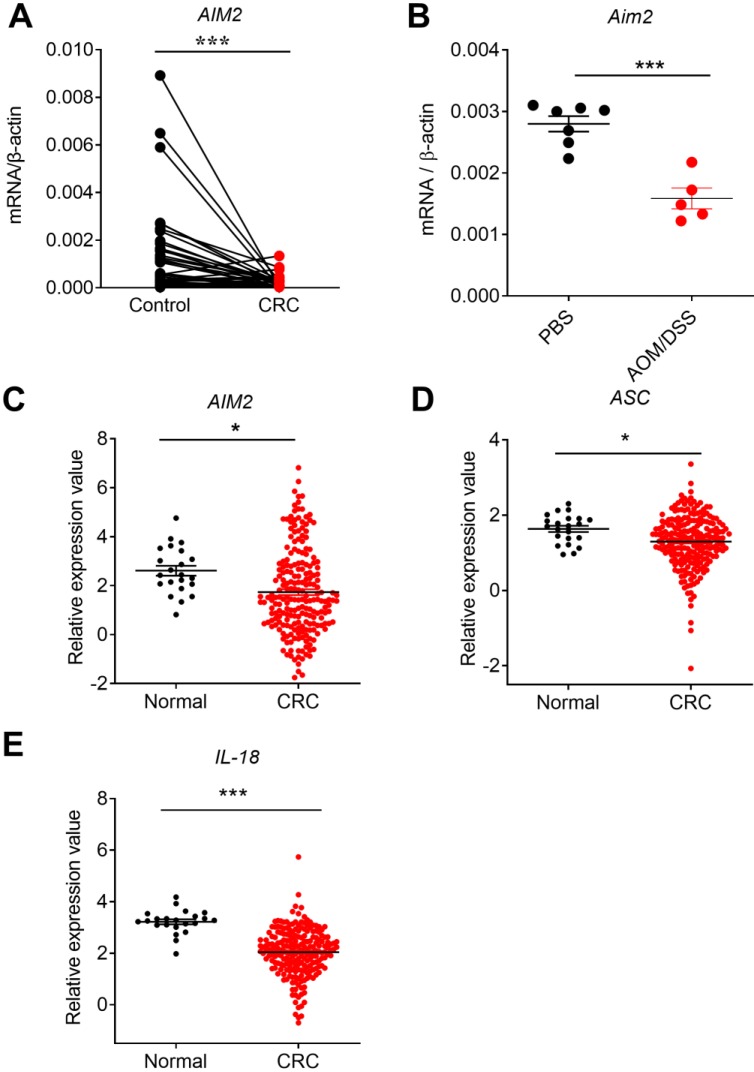
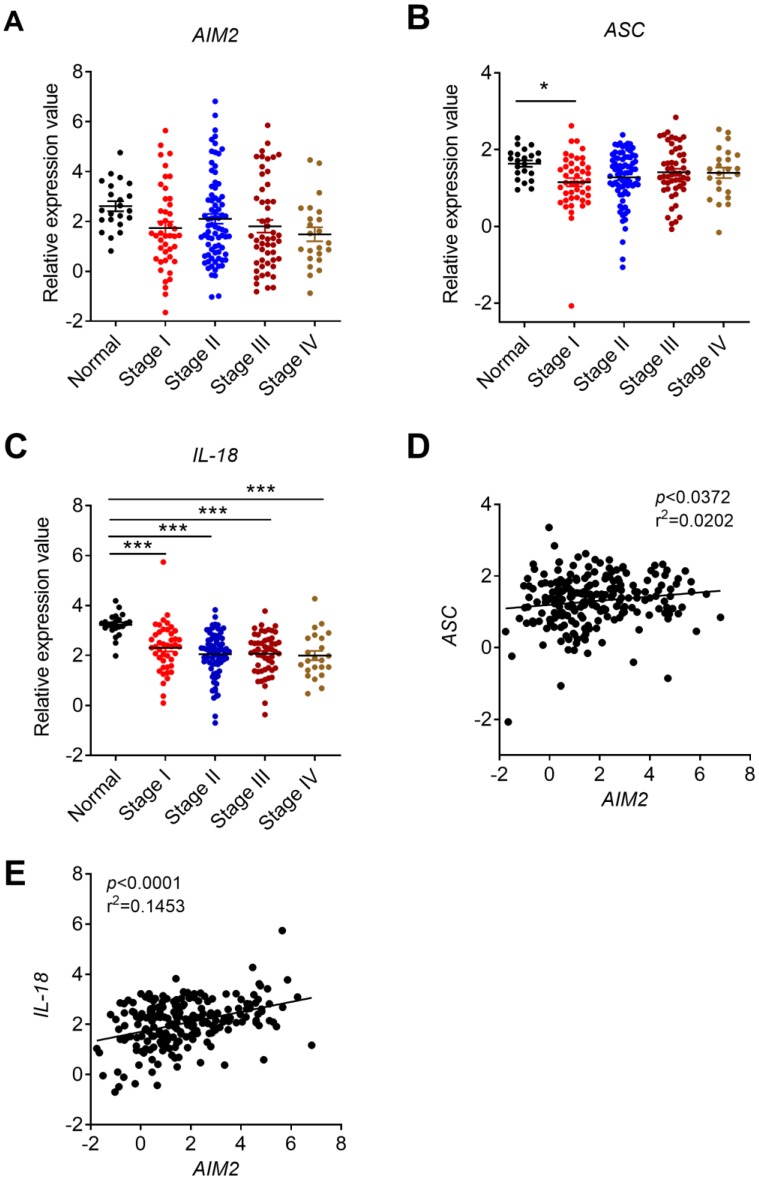
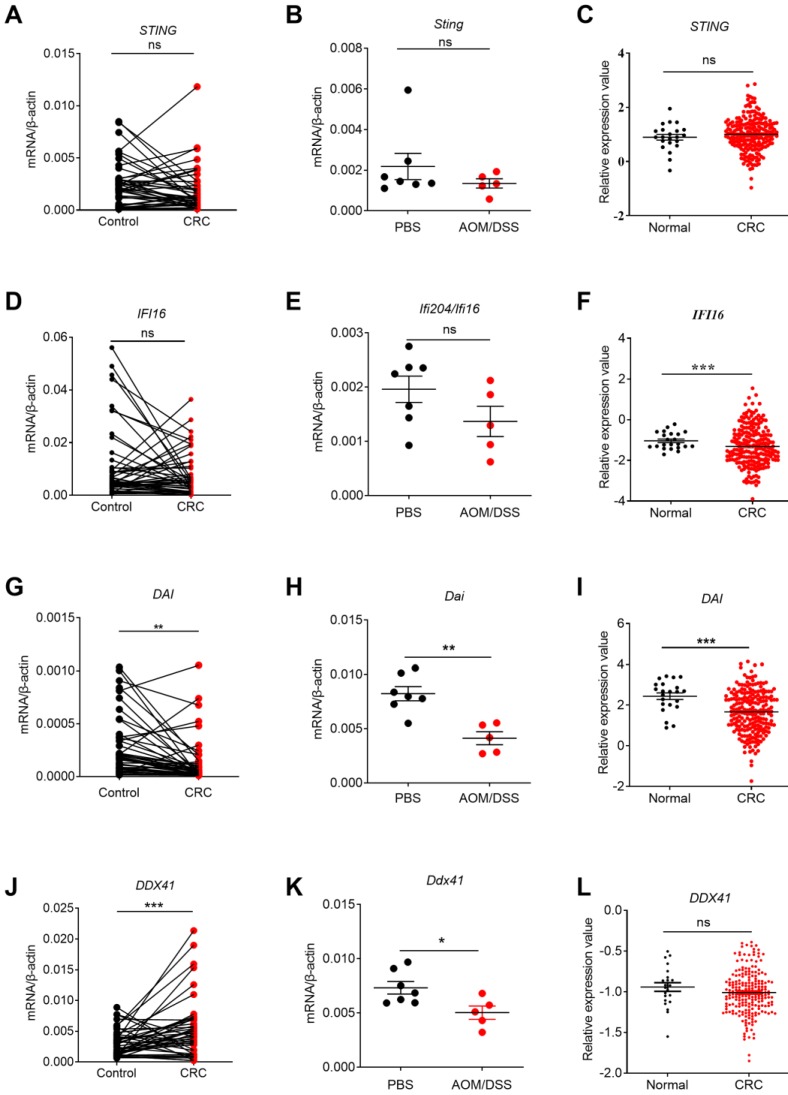
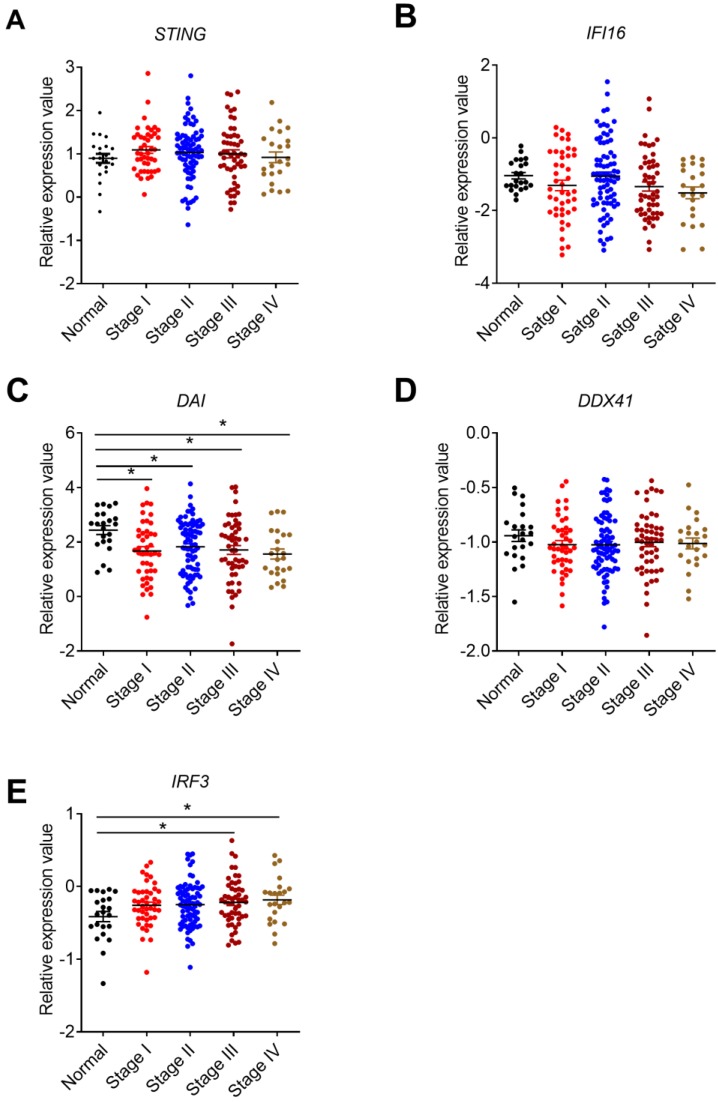
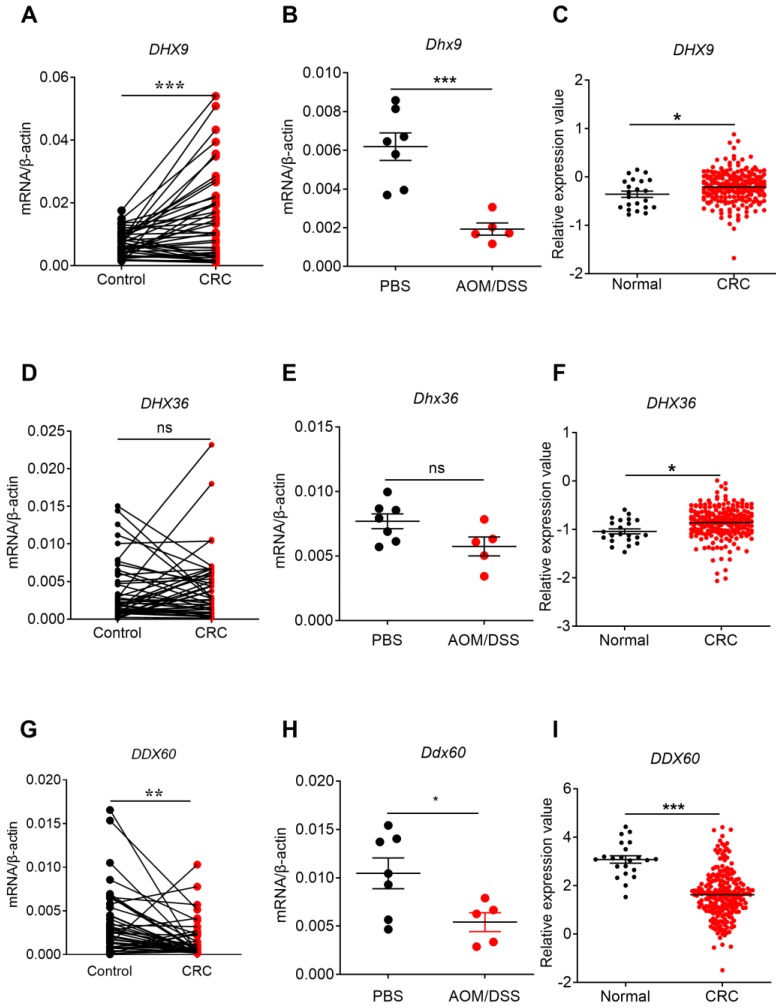
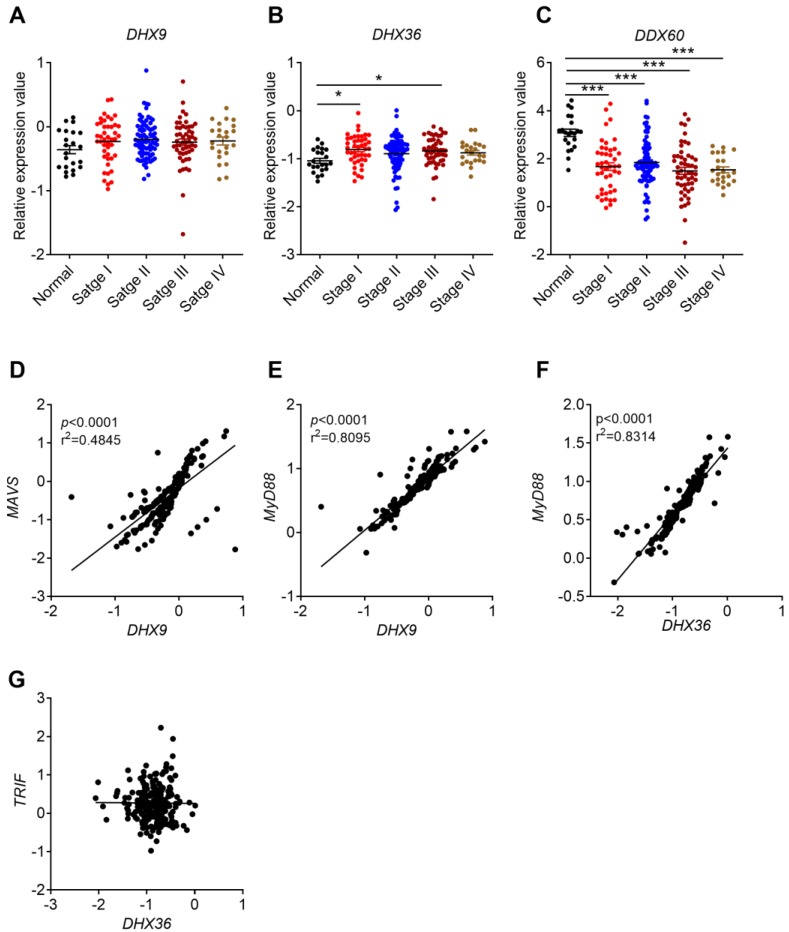
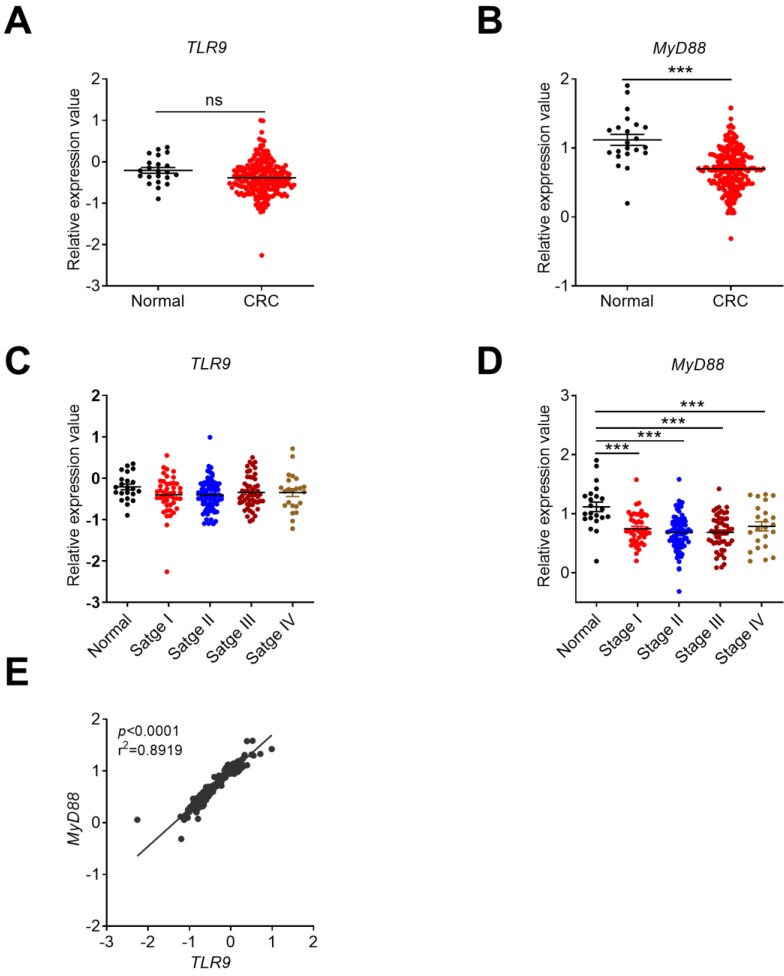
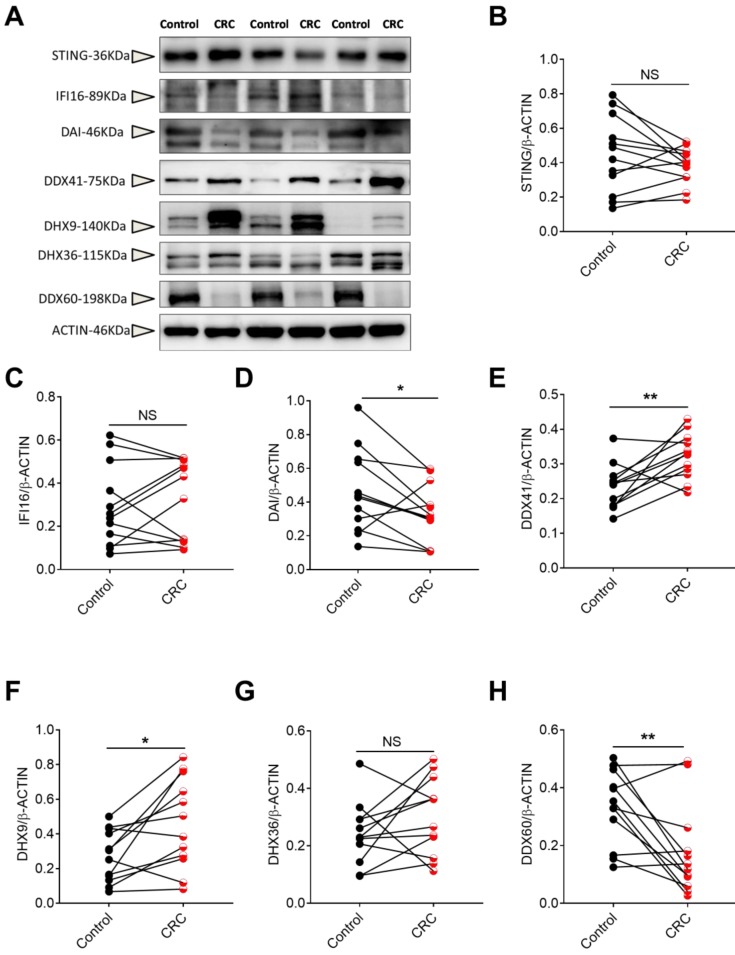
Background: DNA sensors are innate immune receptors that detect intracellular endogenous or exogenous DNA. They are critical to trigger immune response against DNA viral and intracellular bacterial infection, and are involved in inflammatory diseases and tumorigenesis. Recent accumulating evidences indicated that DNA sensors are also crucial for controlling the development of colorectal cancer (CRC). However, a systematic study on the expression profile of DNA sensors in CRC and their clinical significance are still lacking. Methods: We investigated the expression profile of DNA sensors in CRC and their clinical significance by taking advantage of clinical CRC samples, mouse AOM/DSS treatment model, and Oncomine ® bioinformatics platform. Results: Our study identified that the expression of DNA sensors, including AIM2, DAI, as well as inflammasome molecules ASC/IL-18, TLR9 and adaptor MyD88, and DDX60 decreased in human CRC, whereas the expression of DHX9, DHX36, and DDX41 significantly increased. Among them, the expression of AIM2/ASC/IL-18, MyD88, DAI, DHX36, and DDX60 were associated with cancer stages. In addition, we also performed correlation analysis between DNA sensors and their main signaling molecules to explore the possible mechanisms. The results showed that there were positive correlations between AIM2 and ASC/IL-18, DHX9 and MAVS, and TLR9 and MyD88 expression. In addition, the gene expression patterns of some DNA sensors were confirmed by Western-blot analysis. Conclusions: Our study revealed that the expression of multiple DNA sensors was deregulated in CRC and might be involved in tumor development. More importantly, the study identified that, among all these DNA sensors, AIM2, DAI, and DDX60 could be potentially critical for diagnosis, prognosis, and therapy of CRC and deserve further investigation.

Keywords: DNA sensors; cancer; cancer stages; expression profile.


Conflict of interest statement

Competing Interests: The authors have declared that no competing interest exists.

Figures

Figure 1
Figure 1
The expression profile of AIM2 in human colorectal cancer (CRC) tissues, mouse CRC tissues at early stage, and TCGA database. RNA was extracted from cancer and matched peri-carcinomatous tissues of CRC patients, as well as tissues from AOM/DSS treated mice, and reverse-transcribed into cDNA. Then the gene expression levels of AIM2 were determined by quantitative fluorescent PCR. The data from the same patient were connected by straight lines. The data of the expression of AIM2 and inflammasome molecules ASC and IL-18 were retrieved from the TCGA microarray database in Oncomine® platform. (A) AIM2 expression in human CRC tissues, (B) Aim2 expression in tissues from AOM/DSS treated mice, (C) AIM2 expression in TCGA database, (D-E) The expression of inflammasome molecules ASC and IL-18 in TCGA database. Control: matched peri-carcinomatous tissues, n=44 for clinical samples, data represent two independent experiments; n=7 for PBS-treated mice and n=5 for AOM/DSS- treated mice; n=22 for health normal controls and n=215 for CRC group. *p < 0.05, ***p < 0.001.
Figure 2
Figure 2
Correlation analysis between the expression of AIM2 inflammasome molecules and CRC stages, and correlation between AIM2 and inflammasome molecules. The expression data of AIM2 and inflammasome molecules, ASC and IL-18, were retrieved from the TCGA microarray database in Oncomine® platform, and were grouped by stages or patient IDs for further analysis. (A-C) Correlation analysis between the expression of AIM2, inflammasome molecules (ASC and IL-18) and cancer stages were shown. (D-E) Correlation between the expression of AIM2 and ASC/IL-18. n=22 for health normal control, 44 for stage I, 78 for stage II, 52 for stage III, and 23 for stage IV. Data were expressed as mean ± SEM, Log2 median-centered ratio expression. *p < 0.05; ***p < 0.001.
Figure 3
Figure 3
The expression profile of STING signaling pathway-associated molecules in human and mouse CRC tissues and TCGA database. RNA was extracted from cancer and matched peri-carcinomatous tissues of CRC patients, as well as tissues from AOM/DSS treated mice and reverse-transcribed into cDNA. Then the gene expression levels of STING signaling pathway-associated molecules were determined by quantitative PCR. The data from the same patient were connected by straight lines. The data of the expression of STING signaling pathway-associated molecules were retrieved from the TCGA microarray database in Oncomine® platform. Expression of STING (A, B, C), IFI16 (D, E, F), DAI (G,H, I) and DDX41 (J, K, L) in human CRC tissues, tissues from AOM/DSS treated mice, and TCGA database. Control: matched peri-carcinomatous tissues, n=44 for clinical samples, data represent two independent experiments; n=7 for PBS-treated mice and n=5 for AOM/DSS- treated mice; n=22 for health normal controls and n=215 for CRC group. *p < 0.05, **p < 0.01, ***p < 0.001; NS: Not significantly different.
Figure 4
Figure 4
Correlation between STING signaling-associated molecules expression and cancer stages. The expression data of STING signaling pathway-associated molecules were retrieved from the TCGA microarray database in Oncomine® platform and were grouped by stages for further analysis. Correlation between STING (A), IFI16 (B), DAI(C), DDX41 (D), IRF3 (E), and cancer stages were shown. n=22 for health control, 44 for stage I, 78 for stage II, 52 for stage III, and 23 for stage IV. Data were expressed as mean ± SEM, Log2 median-centered ratio expression. *p < 0.05.
Figure 5
Figure 5
The expression profile of helicases in human and mouse CRC tissues and TCGA database. RNA was extracted from cancer and matched peri-carcinomatous tissues of CRC patients, as well as tissues from AOM/DSS treated mice, and reverse-transcribed into cDNA. Then the gene expression levels of helicases were determined by quantitative PCR. The data from the same patient were connected by straight lines. The data of the expression of helicases were retrieved from the TCGA microarray database in Oncomine® platform. Expression of DHX9 (A, B, C), DHX36 (D, E, F), and DDX60 (G, H, I), in human CRC tissues, tissues from AOM/DSS treated mice, and TCGA database. Control: matched peri-carcinomatous tissues, n=44 for clinical samples, data represent two independent experiments; n=7 for PBS-treated mice and n=5 for AOM/DSS- treated mice. *p < 0.05, **p < 0.01, ***p < 0.001; NS: Not significantly different.
Figure 6
Figure 6
Correlation between helicases expression and cancer stages, and between their expression and MyD88/MAVS/TRIF expression. The expression data of helicases were retrieved from the TCGA microarray database in Oncomine® platform, and were grouped by stages or patient IDs for further analysis. (A-C) Correlation between DHX9, DHX36, and DDX60 and cancer stages were shown. (D-G) Expression correlation between DHX9 and MAVS/MyD88, DHX36 and MyD88/TRIF. n=22 for health normal control, 44 for stage I, 78 for stage II, 52 for stage III, and 23 for stage IV. Data were expressed as mean ± SEM, Log2 median-centered ratio expression. *p < 0.05; ***p < 0.001.
Figure 7
Figure 7
The expression profile of TLR9 in CRC tissues and its correlation with tumor stages or MyD88. The expression data of TLR9 were retrieved from the TCGA microarray database in Oncomine® platform and were grouped by stages or patient IDs for further analysis. Expression of TLR9 (A) and MyD88 (B) in TCGA database. Correlation analysis of TLR9(C) and MyD88 (D) in different stages of CRC and health control. (E) Expression correlation between TLR9 and MyD88. n=22 for health normal control, 44 for stage I, 78 for stage II, 52 for stage III, and 23 for stage IV. Data were expressed as mean±SEM, Log2 median-centered ratio expression. ***p < 0.001; NS: Not significantly different.
Figure 8
Figure 8
The protein levels of DNA sensors in human CRC tissues. Protein was extracted from cancer and matched peri-carcinomatous tissues of CRC patients, and then the levels of DNA sensors including STING, IFI16, DAI, DDX41, DHX9, DHX36 and DDX60 were determined by Western-blot. (A) The representative Western-blot results. The triangles point to the specific bands of the molecules. Densitometric analysis of band intensity of STING (B), IFI16(C), DAI(D), DDX41(E), DHX9(F), DHX36(G) and DDX60(H) was shown. Control: matched peri-carcinomatous tissues, CRC: colorectal cancer tissues, n=12. *p < 0.05; **p < 0.01; NS: Not significantly different.

References

    1. Bray F, Ferlay J, Soerjomataram I, Siegel RL, Torre LA, Jemal A. Global cancer statistics 2018: GLOBOCAN estimates of incidence and mortality worldwide for 36 cancers in 185 countries. CA Cancer J Clin. 2018;68:394–424. - PubMed
    1. Arnold M, Sierra MS, Laversanne M, Soerjomataram I, Jemal A, Bray F. Global patterns and trends in colorectal cancer incidence and mortality. Gut. 2017;66:683–91. - PubMed
    1. Jess T, Rungoe C, Peyrin-Biroulet L. Risk of colorectal cancer in patients with ulcerative colitis: a meta-analysis of population-based cohort studies. Clin Gastroenterol Hepatol. 2012;10:639–45. - PubMed
    1. Wang K, Karin M. Tumor-Elicited Inflammation and Colorectal Cancer. Adv Cancer Res. 2015;128:173–96. - PubMed
    1. Takeuchi O, Akira S. Pattern recognition receptors and inflammation. Cell. 2010;140:805–20. - PubMed