

Polymorph evolution during crystal growth studied by 3D electron diffraction
- PMID: 31949899
- PMCID: PMC6949601
- DOI: 10.1107/S2052252519016105
Polymorph evolution during crystal growth studied by 3D electron diffraction
Abstract
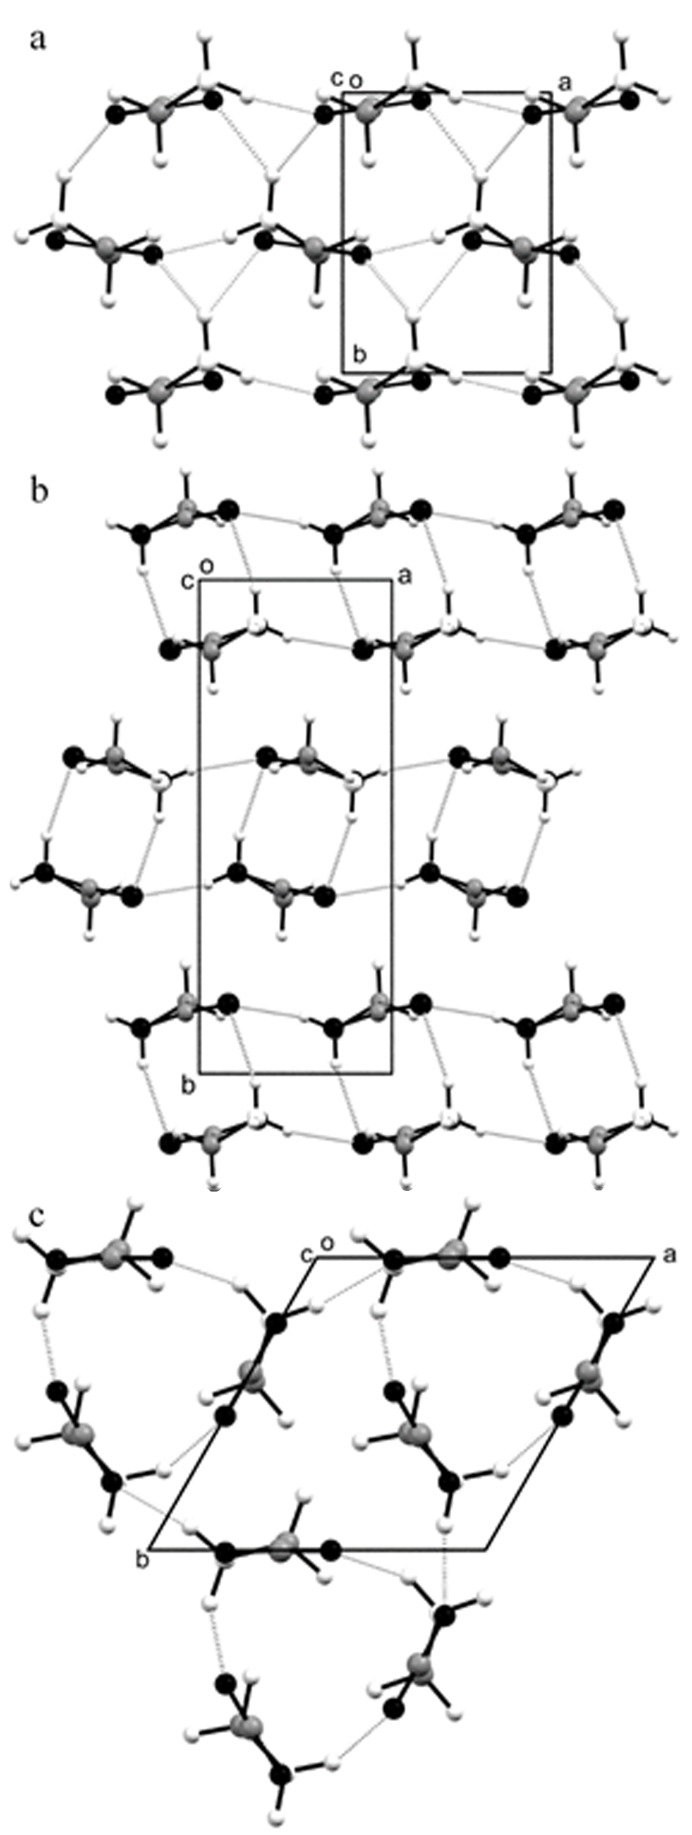
3D electron diffraction (3DED) has been used to follow polymorph evolution in the crystallization of glycine from aqueous solution. The three polymorphs of glycine which exist under ambient conditions follow the stability order β < α < γ. The least stable β polymorph forms within the first 3 min, but this begins to yield the α-form after only 1 min more. Both structures could be determined from continuous rotation electron diffraction data collected in less than 20 s on crystals of thickness ∼100 nm. Even though the γ-form is thermodynamically the most stable polymorph, kinetics favour the α-form, which dominates after prolonged standing. In the same sample, some β and one crystallite of the γ polymorph were also observed.
Keywords: 3DED; cryoTEM; crystallization; electron diffraction; glycine; polymorphism.
© Broadhurst et al. 2020.
Figures

References
-
- Andrusenko, I., Hamilton, V., Mugnaioli, E., Lanza, A., Hall, C., Potticary, J., Hall, S. R. & Gemmi, M. (2019). Angew. Chem. Int. Ed. 58, 10919–10922. - PubMed
-
- Bauer, J., Spanton, S., Henry, R., Quick, J., Dziki, W., Porter, W. & Morris, J. (2001). Pharm. Res. 18, 859–866. - PubMed
-
- Bernal, J. D. (1931). Z. Krist. 78, 363–369.
-
- Bernstein, J. (2010). Polymorphism in Molecular Crystals. Oxford University Press.
-
- Boldyreva, E. V., Drebushchak, V. A., Drebushchak, T. N., Paukov, I. E., Kovalevskaya, Y. A. & Shutova, E. S. (2003). J. Therm. Anal. Calorim. 73, 409–418.
LinkOut - more resources
Full Text Sources
