. 2020 Jan 10;6(2):eaay4055.
doi: 10.1126/sciadv.aay4055. eCollection 2020 Jan.

Physical and data structure of 3D genome

Affiliations

Physical and data structure of 3D genome

Kai Huang et al. Sci Adv. .

Abstract

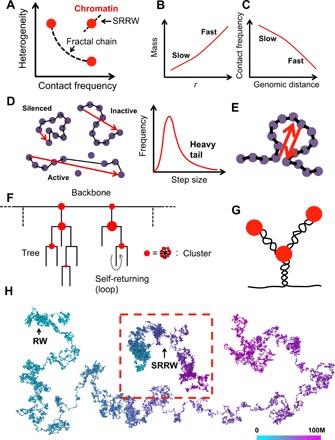
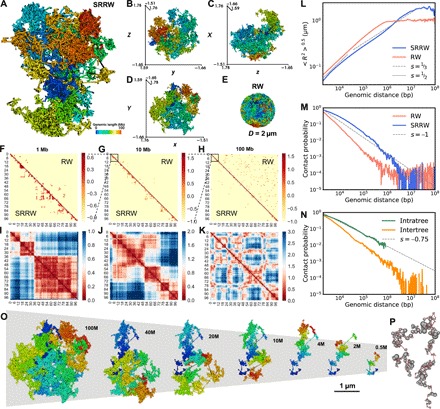
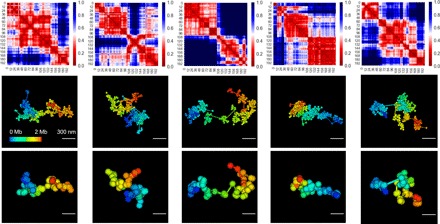
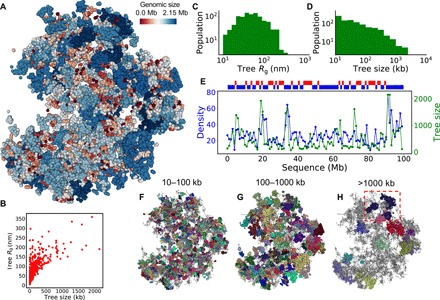
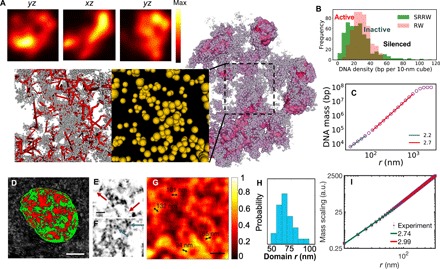
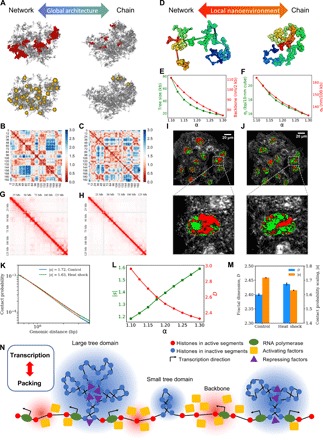
With the textbook view of chromatin folding based on the 30-nm fiber being challenged, it has been proposed that interphase DNA has an irregular 10-nm nucleosome polymer structure whose folding philosophy is unknown. Nevertheless, experimental advances suggest that this irregular packing is associated with many nontrivial physical properties that are puzzling from a polymer physics point of view. Here, we show that the reconciliation of these exotic properties necessitates modularizing three-dimensional genome into tree data structures on top of, and in striking contrast to, the linear topology of DNA double helix. These functional modules need to be connected and isolated by an open backbone that results in porous and heterogeneous packing in a quasi-self-similar manner, as revealed by our electron and optical imaging. Our multiscale theoretical and experimental results suggest the existence of higher-order universal folding principles for a disordered chromatin fiber to avoid entanglement and fulfill its biological functions.


Figures

Fig. 1
Fig. 1. The paradox of chromatin folding and the basic ideas of SRRW.
(A) Chromatin structure cannot be explained by a fractal chain that has anticorrelated contact frequency and density heterogeneity. SRRW is developed to unify these two properties. (B) Schematic representation of the mass scaling behavior of chromatin. (C) Schematic representation of the contact scaling behavior of chromatin (<10 Mb), which is counterintuitive given the mass scaling behavior. (D) Coarse-graining diverse epigenetic states at the nanoscale into a wide distribution of step sizes. One step approximately maps to 10 nucleosomes or 2-kb DNA. The balls represent histones, and the lines represent DNA. The arrows represent the coarse-grained steps in SRRW. (E) Self-returning as a coarse-grained representation of looping (in a broad sense including supercoiling and clustering). (F) SRRW’s topological architecture featuring random trees connected by a backbone. Tree nodes are formed by frequent self-returning of short steps. (G) One possible realization of tree structures is by combining nanoclusters with nested supercoils or loops. (H) Comparison between a free SRRW (highlighted in the red box) and a free RW, both of 50,000 steps (100 Mb)
Fig. 2
Fig. 2. Typical single-cell level chromatin structure and its scaling behaviors predicted by our model.
(A to D) Folded structure of our modeled chromatin and its xyz projections. (E) Equilibrium globule (confined RW) as a reference system. (F to H) Predicted single-cell level contact maps from local (1 Mb) to global (100 Mb) based on SRRW and RW. (I to K) Physical distance maps of SRRW from local to global. (L) Root mean square end-to-end distance (R) scaling of SRRW and RW. As guide to the eye, the dashed and dotted lines show power-law scaling, with exponents being 1/3 and 1/2, respectively. (M) Contact scaling of SRRW and RW. As guide to the eye, the dashed line shows power-law scaling, with exponent being −1. (N) Contact scaling of SRRW for intra- and intertree contacts. The intratree contacts are richer than the intertree ones and follow a power-law scaling with exponent s = −0.75, akin to the contact scaling within TADs. (O) Structures of the modeled chromatin at different genomic scales. (P) Beads-on-string representation of the secondary structure of chromatin modeled by a free SRRW. Tree domains are represented in beads, with the size of the bead corresponding to the genomic size of the domain. The backbone is represented in string.
Fig. 3
Fig. 3. Typical local chromatin structure predictions.
Five examples of 2 Mb of DNA at 2- and 30-kb resolutions and their physical distance maps (in micrometers) at the single-cell level predicted by the SRRW model. These examples suggest that structured domains exist at the single-cell level with high domain-to-domain variability.
Fig. 4
Fig. 4. A 3D map of tree domains and their structural statistics.
(A) Particle representation of the modeled chromatin with tree domains colored according to their genomic sizes in logarithm scale. (B) Scatter plot of the physical size (Rg) of tree domains versus their genomic sizes, with each domain being one point. (C) Physical size (Rg) distribution of tree domains. (D) Genomic size distribution of tree domains. (E) Local DNA density and averaged tree domain size walking along the sequence of the modeled chromatin, with each step being 1 Mb. Above the panel, the local density is divided into two groups, showing in red (low density) and blue (high density). (F to H) Tree domains marked by random colors in three size groups (10 to 100 kb, 100 to 1000 kb, and above 1000 kb). The unmarked structures are shown in gray. An example of subdomains inside a tree domain is highlighted in (H).
Fig. 5
Fig. 5. Granular and porous chromatin packing across scales demonstrated by model and experiments.
(A) Density field representation (with nanoscale fluctuation filtered) of the modeled chromatin (shown in purple) and its cross sections in three orthogonal directions (shown in the top panels). Zoomed-in bottom panels show the nanoscale packing of the modeled chromatin (without filter). Backbone segments are represented in red lines, and nanocluster tree nodes are represented as yellow particles, with the volume being proportional to the genomic size. (B) Local DNA density spectrum sampled by walking along the modeled chromatin with a probe of 150-nm radius (green). A reference is sampled from an RW (red). (C) DNA mass scaling of the modeled chromatin (sampled over 1000 SRRW trajectories). (D) Typical live cell PWS image of an A549 cell showing chromatin packing domains of mass fractal–like structure. Scale bar, 5 μm. High D regions are scaled in red, while low D regions are shown in green. D of 2.3 was used as a cutoff to separate high and low D regions. (E to G) ChromSTEM images of A549 cells. (E and F) Linker DNA (red arrows) and individual nucleosomes (blue arrows) captured by ChromSTEM. Scale bar, 30 nm. (G) Chromatin volume concentration based on the convolution of ChromSTEM image. Scale bar, 200 nm. (H) Histogram of chromatin domain size distribution based on the chromatin volume concentration. (I) DNA mass scaling based on ChromSTEM. a.u., arbitrary units.
Fig. 6
Fig. 6. Coupling between chromatin properties during structural alternation.
(A) Global architectural alternation as α changes. Left: Network-like (small α). Right: Chain-like (large α). For each structure, the five largest tree domains are shown in red in the first row, and the tree nodes larger than 40 kb are shown in yellow in the second row. (B and C) Physical distance maps at small (left) and large (right) α values. (D) Two different nanoenvironments at small (left) and large (right) α values. (E) Tree domain sizes and backbone openness as functions of α. (F) SDs of local DNA density and end-to-end distance as functions of α. (G and H) Contact matrices of hESCs exposed to heat shock and at normal temperature. (I and J) PWS live-cell images of HCT116 cells under heat shock and normal temperature conditions. (K) Contact probability curves for hESCs under normal temperature and heat shock conditions for the 100-kb to 1-Mb range. (L) How contact scaling and effective mass scaling for 100-kb to 1-Mb modeled chromatin segment depend on α. (M) Trends of contact probability scaling change and heterogeneity change after heat shock based on Hi-C analysis and PWS measurements. (N) Schematic presentation of the interplay between transcription and chromatin packing. High DNA density (inactive) regions are highlighted in blue, and low DNA density (active) regions are highlighted in red. For a simple demonstration, we scaled down all the domains, which are expected to contain more nucleosomes in reality.

References

    1. Finch J., Klug A., Solenoidal model for superstructure in chromatin. Proc. Natl. Acad. Sci. U.S.A. 73, 1897–1901 (1976). - PMC - PubMed
    1. Maeshima K., Ide S., Babokhov M., Dynamic chromatin organization without the 30-Nm fiber. Curr. Opin. Cell Biol. 58, 95–104 (2019). - PubMed
    1. Ou H. D., Phan S., Deerinck T. J., Thor A., Ellisman M. H., O’Shea C. C., ChromEMT: Visualizing 3D chromatin structure and compaction in interphase and mitotic cells. Science 357, eaag0025 (2017). - PMC - PubMed
    1. Almassalha L. M., Bauer G. M., Chandler J. E., Gladstein S., Cherkezyan L., Stypula-Cyrus Y., Weinberg S., Zhang D., Ruhoff P. T., Roy H. K., Subramanian H., Chandel N. S., Szleifer I., Backman V., Label-free imaging of the native, living cellular nanoarchitecture using partial-wave spectroscopic microscopy. Proc. Natl. Acad. Sci. U.S.A. 113, E6372–E6381 (2016). - PMC - PubMed
    1. Almassalha L. M., Bauer G. M., Wu W., Cherkezyan L., Zhang D., Kendra A., Gladstein S., Chandler J. E., VanDerway D., Seagle B.-L. L., Ugolkov A., Billadeau D. D., O’Halloran T. V., Mazar A. P., Roy H. K., Szleifer I., Shahabi S., Backman V., Macrogenomic engineering via modulation of the scaling of chromatin packing density. Nat. Biomed. Eng. 1, 902–913 (2017). - PMC - PubMed

Publication types

LinkOut - more resources