. 2019 Oct;1(10):975-984.
doi: 10.1038/s42255-019-0126-8. Epub 2019 Oct 14.

Voltage-energized Calcium-sensitive ATP Production by Mitochondria

Affiliations

Voltage-energized Calcium-sensitive ATP Production by Mitochondria

Andrew P Wescott et al. Nat Metab. 2019 Oct.

Erratum in

Abstract

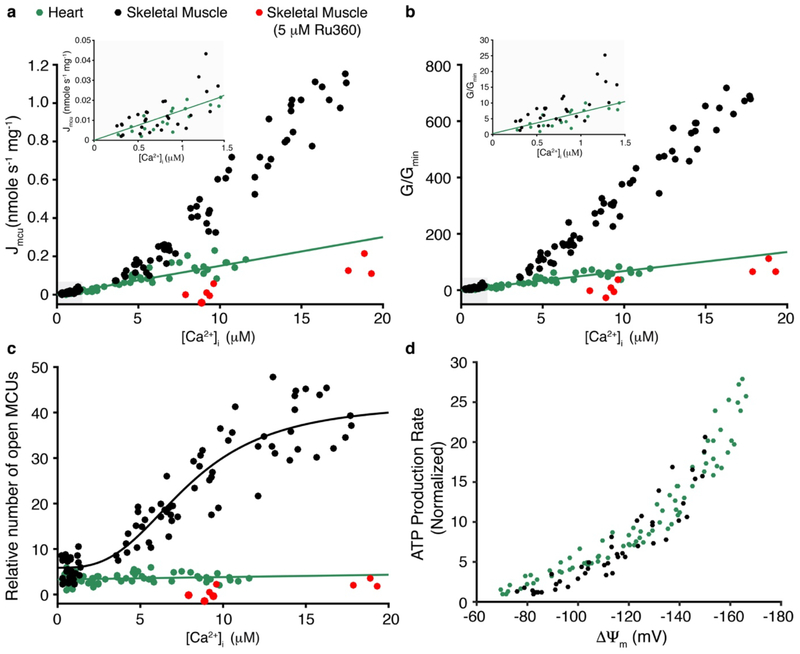
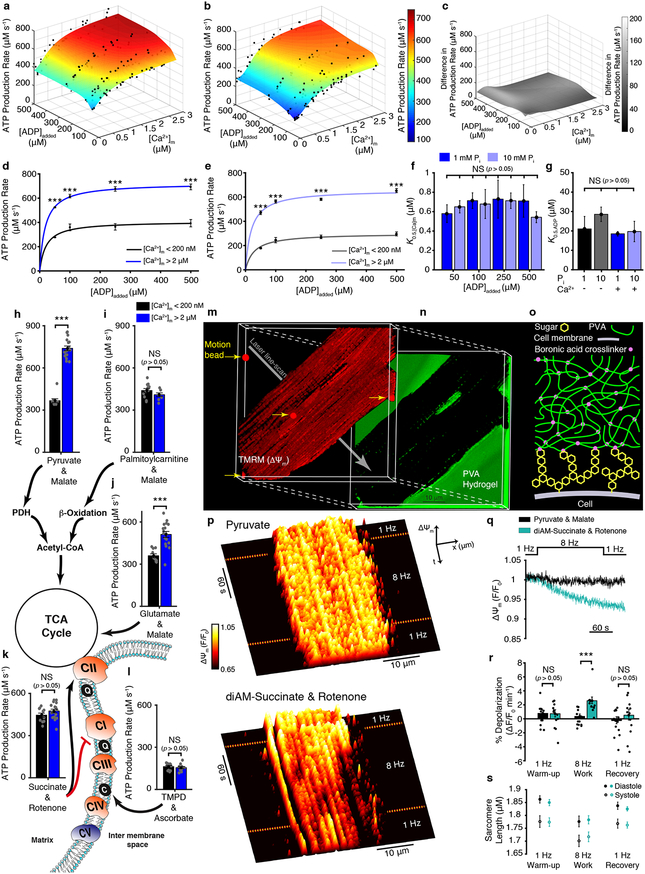
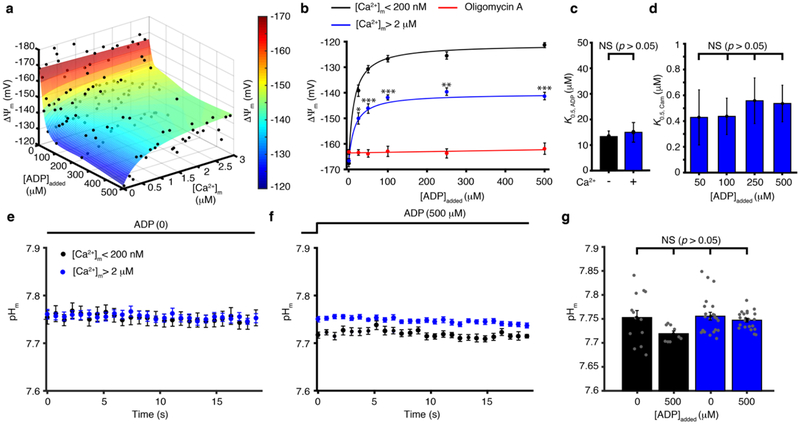
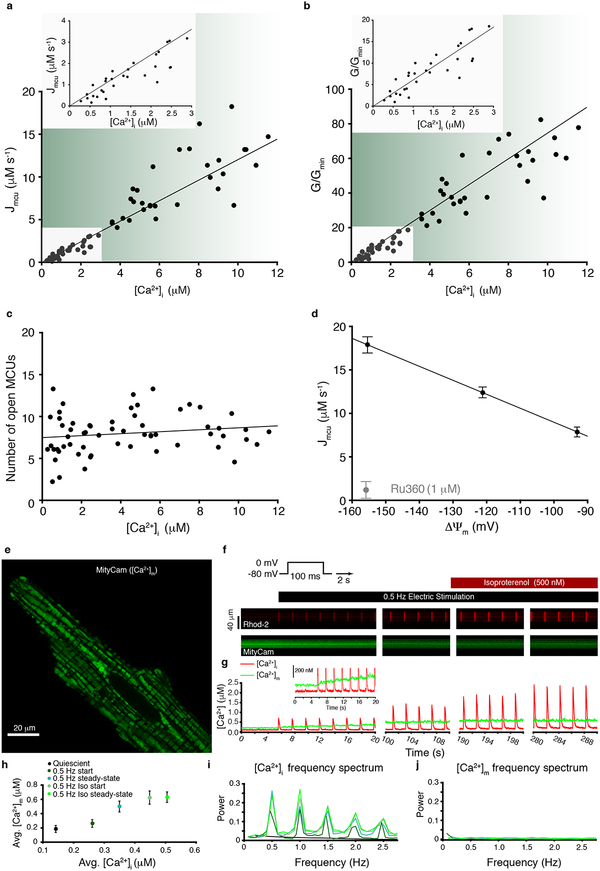
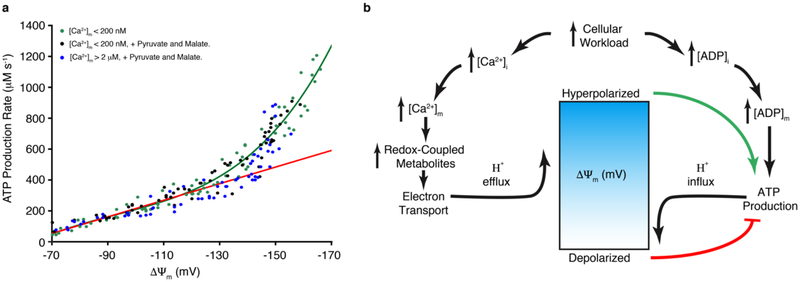
Regulation of ATP production by mitochondria, critical to multicellular life, is poorly understood. Here we investigate the molecular controls of this process in heart and provide a framework for its Ca2+-dependent regulation. We find that the entry of Ca2+ into the matrix through the mitochondrial calcium uniporter (MCU) in heart has neither an apparent cytosolic Ca2+ threshold nor gating function and guides ATP production by its influence on the inner mitochondrial membrane (IMM) potential, ΔΨm. This regulation occurs by matrix Ca2+-dependent modulation of pyruvate and glutamate dehydrogenase activity and not through any effect of Ca2+ on ATP Synthase or on Electron Transport Chain Complexes II, III or IV. Examining the ΔΨm dependence of ATP production over the range of -60 mV to -170 mV in detail reveals that cardiac ATP synthase has a voltage dependence that distinguishes it fundamentally from the previous standard, the bacterial ATP synthase. Cardiac ATP synthase operates with a different ΔΨm threshold for ATP production than bacterial ATP synthase and reveals a concave-upwards shape without saturation. Skeletal muscle MCU Ca2+ flux, while also having no apparent cytosolic Ca2+ threshold, is substantially different from the cardiac MCU, yet the ATP synthase voltage dependence in skeletal muscle is identical to that in the heart. These results suggest that while the conduction of cytosolic Ca2+ signals through the MCU appears to be tissue-dependent, as shown by earlier work1, the control of ATP synthase by ΔΨm appears to be broadly consistent among tissues but is clearly different from bacteria.


Conflict of interest statement

Competing Interests Statement The authors declare no competing financial interests.

Figures

Extended Data Figure 1.
Extended Data Figure 1.. Mitochondrial ATP production, NADH, voltage, and pH.
a. Time-course of fire-fly Luciferase luminescence signal measured from 9 wells after addition of ATP to each well. In this calibration procedure, different amounts of [ATP] are added to each of the 9 wells as indicated to the right of each line ([ATP]added in μM). The inset shows the measured luminescence versus [ATP]added. Purple shaded area highlights the “Working Range” in which the luminescence signal is a linear function of [ATP]. b. Measurements of [ATP] produced by isolated mitochondria. The calibration procedure shown in (a) is used to convert the measured luminescence signal to [ATP]. The inset shows the measured mitochondrial matrix free Ca2+ concentration ([Ca2+]m) associated with the ATP measurements in (b). c. ATP production rate based on the linear fit to measurements in (b) and scaled to units of μmol per liter cytosol per second (μM s−1, scaling is based on 80 g mitochondrial protein per liter cardiomyocyte cytosol, for more details see main methods section and Williams et. al., 2014). d. The increase in [NADH] at high [Ca2+]m (>2 μM) relative to [NADH] at low [Ca2+]m (<200 nM) using the indicated combination of carbon substrates (P&M, Pyruvate and Malate; G&M, Glutamate and Malate; PC&M, PalmitoylCarnitine and Malate, n=4 isolated mitochondria preparations per group, * P < 0.05 by two-sided t-test). Data are mean ± s.e.m. [Ca2+]m was measured with Rhod-2. [NADH] measurements were carried out with a luminescence assay kit (Promega, USA, for additional details see Supplementary Methods section 1.4). e. Measured TMRM fluorescence ratio (F573/F46) over the maximal fluorescence ratio from the dataset. Mitochondria are exposed to 2,4-dinitrophenol ([DNP] in μM) as indicated. f. Measured extra-mitochondrial TMRM concentration. g. The mitochondrial inner membrane potential (ΔΨm) in mV is obtained from the measurements in (f) according to the method by Scaduto RC & Grotyohann LW 1999. h. ΔΨm and its corresponding TMRM fluorescence ratio. Linear fit lines are as indicated in the inset. The calibration results shown in panels e-h were verified repeatedly on a daily bases with similar results obtained. i. Excitation and emission spectra of mitochondria loaded with BCECF (2′,7′-bis(2-carboxyethyl)-5(6)-carboxyfluorescein acetoxymethyl ester). 15 independents measurements are shown at the indicated pH levels (1 μM FCCP is used to equilibrate pHm and the extra-mitochondrial buffer pH) with the similar spectrum shown. j. Measured fluorescence ratio from BCECF-loaded mitochondria at the indicated mitochondrial pH values (pHm). The calibration was verified in two mitochondrial preps with similar results obtained k. The pHm measurements following exposure to sodium acetate at the indicated concentrations. Data are mean ± s.e.m. (Results are from 3 independent experiments in each of the indicated 7 concentrations of sodium acetate).
Extended Data Figure 2.
Extended Data Figure 2.. Calibration of fluorescence measurements with Ca2+ indicators.
a. Fluo-4 Ca2+ titration curve. Shown is the fraction of Ca2+-bound Fluo-4 bound at the indicated added [Ca2+]. Each point is a triplicate average. Titration curves are carried out in the indicated buffers. b. Fluo-4FF Ca2+ titration curve. Shown is the fraction of Ca2+-bound Fluo-4FF at the indicated added [Ca2+]. Each point is a triplicate average. c. Rhod-2 Ca2+ titration curve. Shown is the fraction of Ca2+-bound Rhod-2 at the indicated added [Ca2+]. Each point is a triplicate average. Titration is done in the absence and presence of PVP (polyvinylpyrrolidone) in the assay buffer. d. Ca2+ titration curve for Fura-2AM- or Rhod-2AM-loaded mitochondria. Shown is the fraction of Ca2+-bound Fura-2 or Rhod-2 at the indicated free Ca2+ concentration in the mitochondrial matrix ([Ca2+]m). Each point is a triplicate average. 1 μM FCCP and 1 μM of the Ca2+ ionophore ionomycin are used to equilibrate [Ca2+]m with the extra-mitochondrial free [Ca2+] (i.e., [Ca2+]extra, free). The [Ca2+]extra, free is measured with Fluo-5N. Equations fit to the data for panels a-d are detailed in the main methods section.
Extended Data Figure 3.
Extended Data Figure 3.. Measurements of mitochondrial ATP production when the MCU is blocked by RU360.
a. Measurements of [Ca2+]m in isolated cardiac mitochondria plotted as a function of the measured free extramitochondrial [Ca2+] (i.e., [Ca2+]extra,free) in the presence of the selective MCU blocker RU360 (5 μM). Grey circles are measurements done in the presence of pyruvate (1mM) & malate (0.5 mM). n= 12 independent experiments. Orange circles are measurements done in the presence of glutamate (1 mM) & malate (0.5 mM). n= 12 independent experiments. [Ca2+]m was measured with Fura-2 loaded into the mitochondrial matrix via its acetoxymethyl (AM) ester, [Ca2+]extra,free was measured with Fluo-4 in the extra mitochondrial buffer. b. Measurements of ATP production plotted as a function of the measured [Ca2+]extra,free. The measurements of ATP production rates are normalized to the measurements at nominally zero [Ca2+]extra,free. c. ATP production at the indicated measured [Ca2+]extra,free (from experiments in a-b). Grey bars (left) are ATP production with pyruvate & malate. Orange bars (right) are ATP production with glutamate & malate. Data are mean ± s.e.m. n=3 isolated mitochondria preparations per group, * P < 0.05 by one-way two tailed ANOVA with Bonferroni correction).
Extended Data Figure 4.
Extended Data Figure 4.. Synthesis of 4-armed PEG-boronic acid.
Abbreviations used: HBTU, 1-[bis(dimethylamino)methylene]-1H-benzotriazolium hexafluorophosphate 3-oxide; DIPEA, diisopropylethylamine; DMF, N,N-dimethylformamide. The detailed description of the synthesis procedure is in the methods section.
Extended Data Figure 5.
Extended Data Figure 5.. ΔΨm kinetics during mitochondrial ATP production.
a. Time-dependent stopped-flow measurement of ΔΨm (upper panel) and of the corresponding [Ca2+]m (lower panel). In this protocol (#1), mitochondria were incubated with increasing extra-mitochondrial free Ca2+ and at t = 0, 500 μM [ADP] was added to the mitochondrial mix. Time-dependent depolarization of ΔΨm is shown as is the near steady-state of [Ca2+]m. Black line: [Ca2+]m= 50 nM (n=8); turquoise: [Ca2+]m= 480 nM (n=3); light blue: [Ca2+]m= 750 nM (n=6); grey-blue: [Ca2+]m= 1.2 μM (n=8); navy blue: [Ca2+]m= 1.7 μM (n=4). b. Same as (a) but in this protocol (#2), [Ca2+]m and [ADP] (500 μM) were increased simultaneously at t = 0 (salmon-colored line, n=7). The injected Ca2+ was set so that the [Ca2+]m achieved a level between 1.5 and 2 μM at 20 s. c. Same as (b) but in this protocol (#3), [ADP] (500 μM) rises 10 seconds before [Ca2+]m was increased at t =0 (grey line, n=6). The injected Ca2+ was set so that the [Ca2+]m achieved a level between 1.5 and 2 μM at 20 s, gray line. In panels a-c the sample size (n) represent the number of independent experiments. d. The magnitude of ΔΨm depolarization in experiments a-c. The sample size is the same as in panels a-c. (* and # denotes statistical comparisonto black and beige data, respectively). e. Exponential rate constant of ΔΨm depolarization in experiments a-b. The sample size is the same as in panels a-b. In d-e data are mean ± s.e.m.* P < 0.05, ** P<0.01, *** P<0.001 by one-way two-tailed ANOVA with Bonferroni correction.
Extended Data Figure 6.
Extended Data Figure 6.. Stopped-flow measurements of MCU Ca2+ flux and its driving force.
a and e. Representative stopped-flow time-dependent measurements of extra-mitochondrial free Ca2+ (i.e., [Ca2+]extra,free). Mitochondria in uptake assay buffer (uAB) with low [Ca2+]extra,free (<100 nM) are mixed with uAB buffer with added [Ca2+] 1 ms before fluorescence measurements begin. The levels of added [Ca2+] are set so that at the beginning of the measurements the [Ca2+] added will be as indicated in the inset. In (a) [Ca2+]extra,free is measured with Fluo-4 in the uAB and in (e) with Fluo-4FF. b and f. The corresponding time-dependent measurements of matrix free Ca2+ (i.e., [Ca2+]m). Insets showing the corresponding time-dependent measurements of ΔΨm. c and g. The corresponding time-dependent measurements of total extra-mitochondrial Ca2+ ([Ca2+]extra,Total). The [Ca2+]extra,Total is obtained from the Fluo-4 or Fluo-4FF signals (for more details see the methods section). d and h. MCU Ca2+ influx (Jmcu) is the first derivative of the [Ca2+]extra,Total. The Jmcu is scaled to units of μmol per liter cytosol per second (μM s−1, scaling is based on 80 g mitochondrial protein per liter cardiomyocyte cytosol, for more details see main methods section and Williams et. al., 2014). The shown stopped flow experiments were repeated independently 63 times with similar results at each [Ca2+]extra,free as indicated in Fig 3a.
Extended Data Figure 7.
Extended Data Figure 7.. Characterization of MityCam; a mitochondrially targeted Ca2+-sensitive fluorescent-protein probe expressed in heart muscle cells.
a. MityCam fluorescence versus [Ca2+]m. Note that Ca2+ binding decreases MityCam fluorescence. Measurements are in saponin-permeabilized cardiomyocytes; [Ca2+]m is set using the Ca2+ ionophore ionomycin (2 μM). The extracellular (bath) solution contains Rhod-2 (tripotassium salt, cell-impermeant) to measure the bath [Ca2+], a proton ionophore carbonyl cyanide m-chlorophenyl hydrazone (CCCP, 500 nM) to set the mitochondrial pH, rotenone (400 nM) to block the ETC and the production of ROS, and oligomycin (5 mM) to block reverse-mode consumption of ATP by the ATP synthase, pH 7.8. Fit curve is a single-site binding model (n = 30 cells). b. Top: Confocal line-image from an intact cardiomyocyte expressing MityCam. Bottom: The time-course of changes in [Ca2+]m from the confocal fluorescence measurements. Caffeine (10 mM) was applied for 10 seconds via a local micro-perfusion system to rapidly trigger Ca2+ release from the sarcoplasmic reticulum at the indicated times (highlighted with gray shading). The experiment was repeated independently with n=10 cells with similar results. c. The average time-course of changes in [Ca2+]m following caffeine applications. d. Confocal line-image from an intact cardiomyocyte expressing MityCam in a bath solution devoid of Ca2+ (chelated by 1 mM EGTA) and treated with thapsigargin (1 μM) for 10 minutes prior to imaging to deplete the sarcoplasmic reticulum of Ca2+. Top panel shows MityCam fluorescence; middle panel shows the fluorescence of sulforhodamine (sulforhodamine is included in the micro-perfusion solution to indicate the exact duration of 10 mM caffeine application). Lower panel shows the time-course of changes in [Ca2+]m from the confocal fluorescence measurements. Note that throughout the entire time course of the experiment the extracellular solution is devoid of Ca2+ and also contains 1 μM thapsigargin. The experiment was repeated independently with n=11 cells with similar results. e. Confocal images of cardiac mitochondria isolated from MityCam expressing cardiomyocytes. f. Measurements of [Ca2+]m from isolated single mitochondria expressing MityCam. Top panel (i) shows MityCam fluorescence; lower panel (ii) shows sulforhodamine fluorescence, which indicates the duration of micro-perfusion of 100 μM Ca2+ (see bars above the top panel). Mitochondria isolated from MityCam-expressing cardiomyocytes are adhered to a glass coverslip for confocal microscopy measurements. Rapid step (2–3 ms rise time) of [Ca2+] from 0 (1 mM EGTA) to 100 μM is achieved via a micro-perfusion system. Sulforhodamine is included in the solution applied via the micro-perfusion system to indicate when a mitochondrion is exposed to the solution containing 100 μM Ca2+. The experiment in e-f were repeated independently with n=18 mitochondria with similar results. g. the average time-course of changes in [Ca2+]m following the step increase of Ca2+ from 0 to 100 μM (black line). h. Same as (g) but for comparison to another Ca2+ sensitive fluorescent indicator, MityCam-expressing mitochondria are also loaded with the fluorescent Ca2+ indicator Rhod-2 via its acetoxymethyl (AM) ester form (Rhod-2 AM). To accelerate the rate of [Ca2+]m rise [Ca2+] is raised to 1 mM, all solutions also contain ionomycin (5 μM), FCCP (5 μM), oligomycin (1 μM), pH = 7.8. Green trace for MityCam (n=12 mitochondria) and red for Rhod-2 (n=9 mitochondria). The time at which 1 μM [Ca2+]m is measured is indicated by arrows, this time point is obtained by converting the shown fit lines to units of μM [Ca2+]m. For additional details see Boyman et al., 2014.
Extended Data Figure 8.
Extended Data Figure 8.. MCU conductance and voltage dependence of ATP production in heart and skeletal muscle.
a. Measurement of the MCU-dependent Ca2+ influx (Jmcu) (nmole mg−1 s−1) in cardiac mitochondria (green circles, from Fig. 3), skeletal muscle (black circles), and skeletal muscle with Ru360 (5 μM) (red circles) is plotted as a function of measured [Ca2+]i (n = 63, n = 87, and n = 12 independent experiments, respectively, each with [Ca2+]i, [Ca2+]m and ΔΨm measured). Linear least-squares fit to the heart mitochondria data is shown (slope = 0.015). b. MCU conductance (G) for each measurement shown in (a) normalized to the minimal conductance (Gmin) of the cardiac dataset (G/Gmin) plotted as a function of [Ca2+]i. Linear least-squares fit line to the heart mitochondria data is shown (slope = 6.1). c. Relative number of open MCUs per mitochondrion plotted as a function of [Ca2+]i. Taken from (b) after dividing by the [Ca2+]i-dependent unitary conductance of MCU and normalized to the minimal number of open MCUs of the cardiac dataset. Linear least-squares fit to the heart mitochondria data is shown (slope = 0.051, intercept = 3.3). For skeletal muscle data under [Ca2+]i of 1.5 μM the measurements were done using stopped flow as described in Extended Data Fig 5. Jmcu at [Ca2+]i above 1.5 μM was collected using a multi-well plate reader with ΔΨm set using a K+ gradient and the K+ ionophore valinomycin. Skeletal muscle data is fit to a modified Hill equation with a K0.5 of 7.9 μM and a Hill coefficient of 2.95. d. The dependence of ATP production on ΔΨm in the absence of carbon substrates and at [Ca2+]m < 200 nM. The measurements of ATP production rates are normalized to the minimal production rate of each data set. Measurements from heart mitochondria are shown in green circles (n= 77, replotted from Fig. 4a), the measurements from skeletal muscle mitochondria are in shown in black circles (n= 45 independent experiments). ΔΨm was set by using a fixed K+ gradient and the K+ ionophore valinomycin (see Methods).
Figure 1.
Figure 1.. [Ca2+]m sensitive ATP production by mitochondria.
a. The dependence of ATP production (μM/s) on [Ca2+]m and [ADP]added at 1 mM Pi (n= 37, 38, 38, 29 for 500, 250, 100, 50 μM ADP added, respectively). b. Same as (a) but at 10 mM Pi (n= 28, 27, 30, 42 for 500, 250, 100, 50 μM ADP added, respectively). c. The difference in ATP production rates between 1 mM Pi and 10 mM Pi. d. Dependence of ATP production (μM/s) on ADP at 1 mM Pi when [Ca2+]m is < 200 nM (black circles, n= 3, 3, 3, 5 for 50, 100, 250, 500 μM ADP added, respectively) or > 2 μM (blue circles, n= 8, 7, 6, 9 for 50, 100, 250, 500 μM ADP added, respectively). Data are fit to a Michaelis–Menten equation. e. Same as (d) but at 10 mM Pi when [Ca2+]m is <200 nM (grey circles, n= 8, 6, 3, 7 for 50, 100, 250, 500 μM ADP added, respectively) or 2 μM (light blue circles, n= 5, 7, 5, 5 for 50, 100, 250, 500 μM ADP added, respectively). Data are fit to Michaelis–Menten equation. f. [Ca2+]m at which ATP production rate is half maximal (K0.5,[Ca]m) for [ADP]added at both 1 and 10 mM Pi. Each bar shows the K0.5,[Ca]m constant of each of the eight fit lines shown as surface plots in a-b (K0.5,[Ca]m ± s.e. of fit in μM, fitted sample size is given in a-b, individual data points shown in a-b). g. [ADP]added at which ATP production is half maximal (K0.5,ADP) for [Ca2+]m <100 nM (−) and >2 μM (+) at both 1 and 10 mM Pi. Each bar shows the K0.5,ADP constant of each of the four fit lines shown in d-e (K0.5,[Ca]m ± s.e. of fit in μM, fitted sample size is given in d-e, individual data points shown in a-b). h-l. ATP production rate at low [Ca2+]m (<200 nm, black bar) and high [Ca2+]m (>2 μM, blue bar) using the indicated combination of carbon substrates and metabolic inhibitors (n= 10–20 per group). Abbreviations used in the diagram: PDH, pyruvate dehydrogenase; TCA, tricarboxylic acid; CI, Complex 1; CII, Complex 2; CIII, Complex 3; CIV, Complex 4; CV, Complex 5 (i.e. ATP synthase); Q, ubiquinone; C, cytochrome c. m. 3D reconstruction of confocal Z-stack images of a cardiomyocyte loaded with the fluorescent indicator TMRM (tetramethylrhodamine methyl ester perchlorate, 50 nM). n. The fluorescence of fluorescein-containing poly(vinyl alcohol) (PVA) hydrogel that embeds the cell shown in (m). o. Diagram showing boronic acid crosslinker linking cell-surface sugars to the PVA hydrogel. p. Fluorescence surface plot demonstrating spatiotemporal changes of ΔΨm. Measurements are done on cardiomyocyte paced by field-stimulation to contract at 1 or 8 Hz in a bath (extracellular) solution that contains top; pyruvate (1 mM) and malate (0.5 mM), or bottom; diAM-succinate (succinic acid diacetoxymethyl ester, 10 μM) and rotenone (5 μM). q. Average ΔΨm fluorescence time course using pyruvate + malate (black, n = 13 cells) and diAM-succinate + rotenone (turquoise, n = 12 cells). r. Quantification of ΔΨm depolarization expressed as percent change per minute. s. Sarcomere length measured simultaneously in the experiments shown in q. The sample size (n) in all panels represents the number of independent experiments. Data in d-e, h-l, and r-s are mean ± s.e.m. One-way two-tailed ANOVA with Bonferroni correction in d-g, and two-sample two-tailed t-test in h-l and r. * P < 0.05, ** P<0.01, *** P<0.001.
Figure 2.
Figure 2.. [Ca2+]m control of ΔΨm.
a. Steady-state ΔΨm is plotted as a function of [Ca2+]m and [ADP]added (n= 22, 18, 25, 20, 21, 27 for 0, 25, 50, 100, 250, 500 μM [ADP]added, respectively). b. Steady-state ΔΨm is plotted as a function of [ADP]added when [Ca2+]m is < 200 nM (black circles, n= 24, 42, 16, 20, 14, 12 for 0, 25, 50, 100, 250, 500 μM [ADP]added, respectively or is > 2 μM (blue circles, n= 15, 6, 11, 5, 6, 10 for 0, 25, 50, 100, 250, 500 μM [ADP]added, respectively) or in the presence of 15 μM Oligomycin A (red circles, n= 12, 18, 17, 18, 18, 14 for 0, 25, 50, 100, 250, 500 μM [ADP]added, respectively). Data are fit to a Michaelis–Menten equation. c. [ADP]added at which ΔΨm depolarization is half-maximal for [Ca2+]m <200 nm (−) and >2 μM (+). Each bar shows the K0.5, ADP constant of each of the two fit lines shown in b (K0.5, ADP ± s.e. of fit in μM, fitted sample size is given in b, individual data points shown in a). d. [Ca2+]m at which ΔΨm depolarization is half-maximal for [ADP]added of 50, 100, 250 and 500 μM. Each bar shows the K0.5, Cam constants of each of the four fits shown as surface plot in a (K0.5, Cam ± s.e. of fit in μM, fitted sample size is given in a, individual data points shown in a). e. The time-course of pHm (measured with the fluorescent indicator BCECF - Methods and Extended Data Fig. 1) when [Ca2+]m is <200 nM (black circles, n= 13), or > 2 μM (blue circles, n= 23) in the absence of ADP. f. Same as (e) but in the presence of 500 μM ADP (black circles, n= 9, blue circles, n= 22). g. Quantification of pHm in e-f (n= 13, 9, 23, 22). The sample size (n) in all panels represents the number of independent experiments. Data in b, and e-g are mean ± s.e.m. One-way two-tailed ANOVA with Bonferroni correction in b, d, g and two-sample two-tailed t-test in c. * P < 0.05, ** P<0.01, *** P<0.001.
Figure 3.
Figure 3.. [Ca2+]m dynamics and MCU Ca2+ conductance.
a. Stopped-flow measurement of the MCU-dependent Ca2+ influx (Jmcu) scaled to a liter of cytosol (see Methods and ref). Jmcu (μM ·s−1) is plotted as a function of measured [Ca2+]i (n= 63 independent experiments, each with [Ca2+]i, [Ca2+]m and ΔΨm measured). Inset shows zoomed-in region between 0 and 3 μM [Ca2+]i. Linear least-squares fit to the filled circles is shown (slope = 1.2.). Stopped-flow data are shown in Extended Data Fig. 6. b. MCU conductance (G) for each of 63 experiments shown in (a) normalized to the minimal conductance (Gmin) of each dataset (G/Gmin) plotted as a function of [Ca2+]i where G = JmcuC*10−6/(ΔΨm*10−3-(RT/2F)*ln([Ca2+]i/[Ca2+]m), (see Methods). Inset shows zoomed-in region between 0 and 3 μM [Ca2+]i. Linear least-squares fit line to the filled circles is shown (slope = 6.1). c. Number of open MCUs per mitochondrion (NPo) plotted as a function of [Ca2+]i. Taken from (b) after dividing by the number of mitochondria per liter cytosol (see Methods) and dividing by the [Ca2+]i-dependent unitary conductance of MCU,. Linear least-squares fit to the filled circles is shown (slope = 0.116, intercept = 7.48). d. MCU Ca2+ influx (Jmcu, μM ·s−1) plotted as a function of ΔΨm. [Ca2+]i and ΔΨm were measured as in (a) but using a multi-well plate reader. ΔΨm was set by using a K+ gradient and the K+ ionophore valinomycin (see Methods and Fig. 4). [Ca2+]i was set to 15 μM (n= 4, 7, 4 independent experiments for ΔΨm = −155, −122, −92 mV groups, respectively). MCU blocker Ru360 (1 μM) reduced JMCU to near zero (n= 6 independent experiments). Data are mean ± s.e.m. e. Deconvolved Airyscan confocal image showing the fluorescence of the mitochondrially-targeted Ca2+-sensor MityCam expressed in a cardiomyocyte. Note distinct MityCam localization in individual mitochondria. f. Confocal line-scan images from a cardiomyocyte expressing MityCam; top panels show the fluorescence of Rhod-2 (tripotassium salt, loaded via the patch-clamp pipette); lower panels show MityCam fluorescence. To stimulate [Ca2+]i transients the membrane potential is stepped repeatedly from a holding level of −80 mV to 0 mV every 2 seconds. Isoproterenol (500 nM) is applied at the times indicated. Note that Ca2+ binding reduces the fluorescence of MityCam. g. The time-course of changes in [Ca2+]i and [Ca2+]m from the respective fluorescence measurements shown in panel f. The experiments shown in panels e-j were repeated independently with similar results (n=9 cells).h. Time-averaged [Ca2+]m vs. time-averaged [Ca2+]i (n= 9 cells). Data are mean ± s.e.m. i-j. Fast Fourier transform showing the frequency composition of [Ca2+]i and [Ca2+]m signals (n= 9 cells).
Figure 4.
Figure 4.. ΔΨm control of ATP production.
a. The dependence of ATP production (μM/s) on ΔΨm in the absence of carbon substrate and at [Ca2+]m < 200 nM (green circles, n= 77 independent experiments), or with Pyruvate and Malate at [Ca2+]m < 200 nM (black circles, n= 72 independent experiments), or with Pyruvate and Malate at [Ca2+]m > 2 μM (blue circles, n= 65 independent experiments). ΔΨm was set by using a fixed K+ gradient and the K+ ionophore valinomycin (see Methods). The green line is an empirical fit to the data and the red line corresponds to expected ATP production based on linear changes in driving force (ΔGdrive), where ATP production rate = k • ΔGdrive and the kinetic coefficient (k) is assumed to be constant (see Supplementary Information section 1.1 for more details). b. Proposed model for voltage-energized Ca2+-sensitive ATP production. In this physiological feedback mechanism, mitochondrial ATP production is tuned to cellular ATP consumption by cellular Ca2+ signals and ADP availability. Both [Ca2+]i and [ADP]i rise during an increase in workload but have opposing effects on ΔΨm. A rise in cytosolic [ADP] increases ADP availability to ATP synthase, which couples ATP production to influx of H+ into the mitochondrial matrix. A rise in [Ca2+]i increases [Ca2+]m to stimulate the production of redox-coupled metabolites that provide energy for the electron transport chain (ETC) to pump protons (H+) out of the mitochondrial matrix. The dynamic balance of H+ influx by ATP synthase and H+ efflux by the ETC sets ΔΨm, which in the presence of [Ca2+]m will be hyperpolarized, thus, energizing ATP production by ATP synthase.

References

    1. Fieni F, Lee SB, Jan YN & Kirichok Y Activity of the mitochondrial calcium uniporter varies greatly between tissues. Nat Commun 3, 1317, doi:10.1038/ncomms2325 (2012). - DOI - PMC - PubMed
    1. Jacobus WE Respiratory control and the integration of heart high-energy phosphate metabolism by mitochondrial creatine kinase. Annu Rev Physiol 47, 707–725, doi:10.1146/annurev.ph.47.030185.003423 (1985). - DOI - PubMed
    1. Wang Z et al. Specific metabolic rates of major organs and tissues across adulthood: evaluation by mechanistic model of resting energy expenditure. Am J Clin Nutr 92, 1369–1377, doi:10.3945/ajcn.2010.29885 (2010). - DOI - PMC - PubMed
    1. Murphy E et al. Mitochondrial Function, Biology, and Role in Disease: A Scientific Statement From the American Heart Association. Circ Res 118, 1960–1991, doi:10.1161/RES.0000000000000104 (2016). - DOI - PMC - PubMed
    1. DiMauro S & Schon EA Mitochondrial respiratory-chain diseases. N Engl J Med 348, 2656–2668, doi:10.1056/NEJMra022567 (2003). - DOI - PubMed

Publication types