. 2020 Jun 9;22(6):806-818.
doi: 10.1093/neuonc/noaa006.

Fyn tyrosine kinase, a downstream target of receptor tyrosine kinases, modulates antiglioma immune responses

Affiliations

Fyn tyrosine kinase, a downstream target of receptor tyrosine kinases, modulates antiglioma immune responses

Andrea Comba et al. Neuro Oncol. .

Erratum in

Abstract

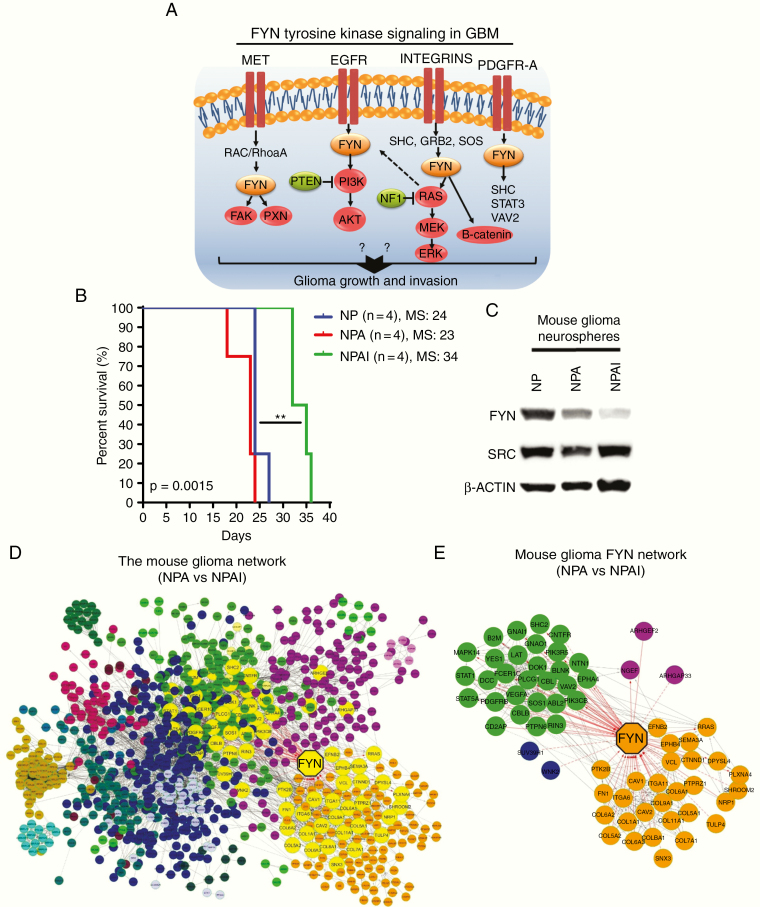
Background: High-grade gliomas are aggressive and immunosuppressive brain tumors. Molecular mechanisms that regulate the inhibitory immune tumor microenvironment (TME) and glioma progression remain poorly understood. Fyn tyrosine kinase is a downstream target of the oncogenic receptor tyrosine kinase pathway and is overexpressed in human gliomas. Fyn's role in vivo in glioma growth remains unknown. We investigated whether Fyn regulates glioma initiation, growth and invasion.

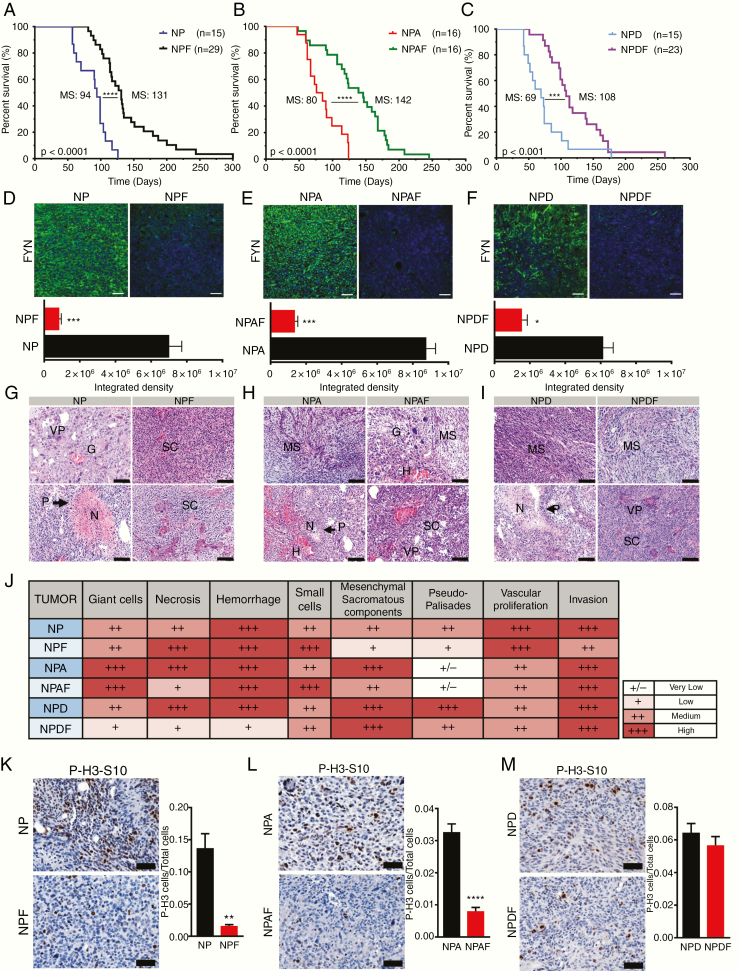
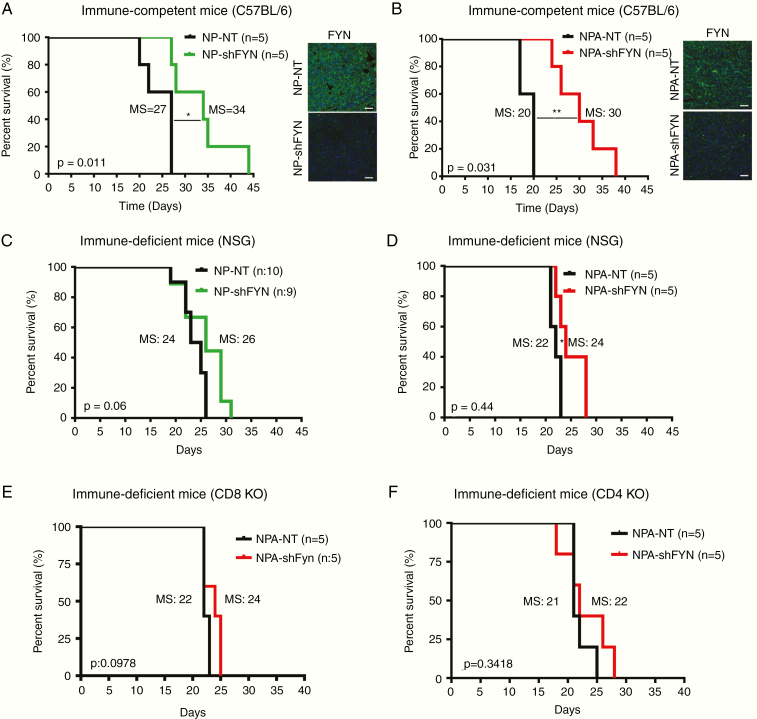
Methods: We evaluated the role of Fyn using genetically engineered mouse glioma models (GEMMs). We also generated Fyn knockdown stem cells to induce gliomas in immune-competent and immune-deficient mice (nonobese diabetic severe combined immunodeficient gamma mice [NSG], CD8-/-, CD4-/-). We analyzed molecular mechanism by RNA sequencing and bioinformatics analysis. Flow cytometry was used to characterize immune cellular infiltrates in the Fyn knockdown glioma TME.

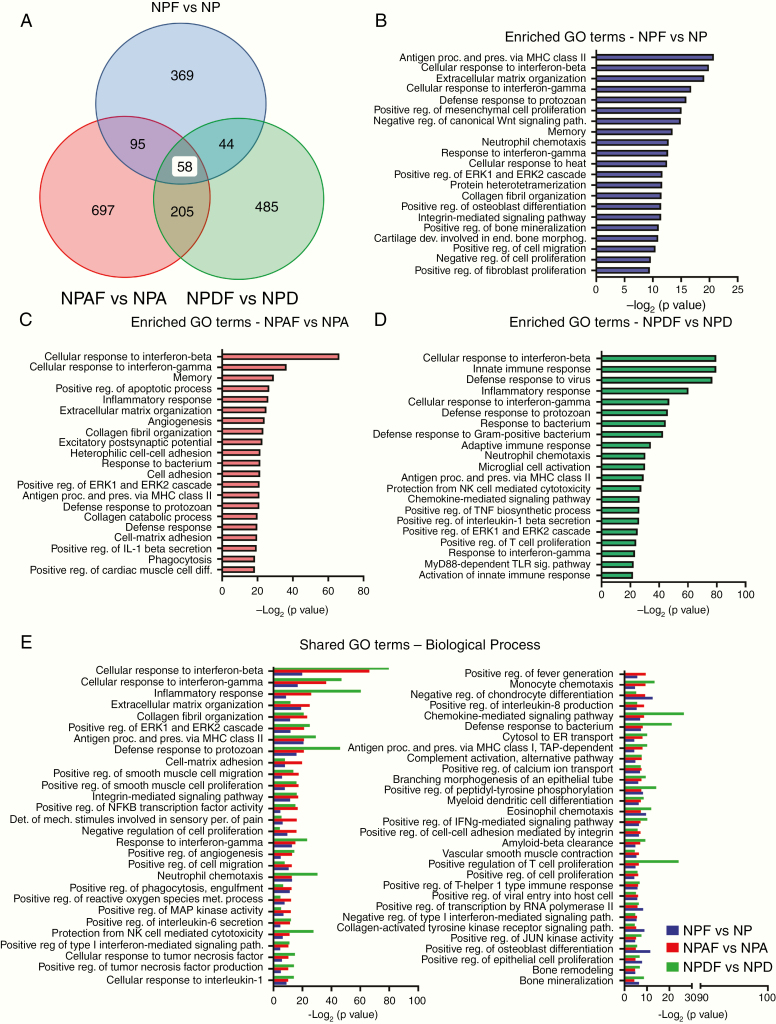
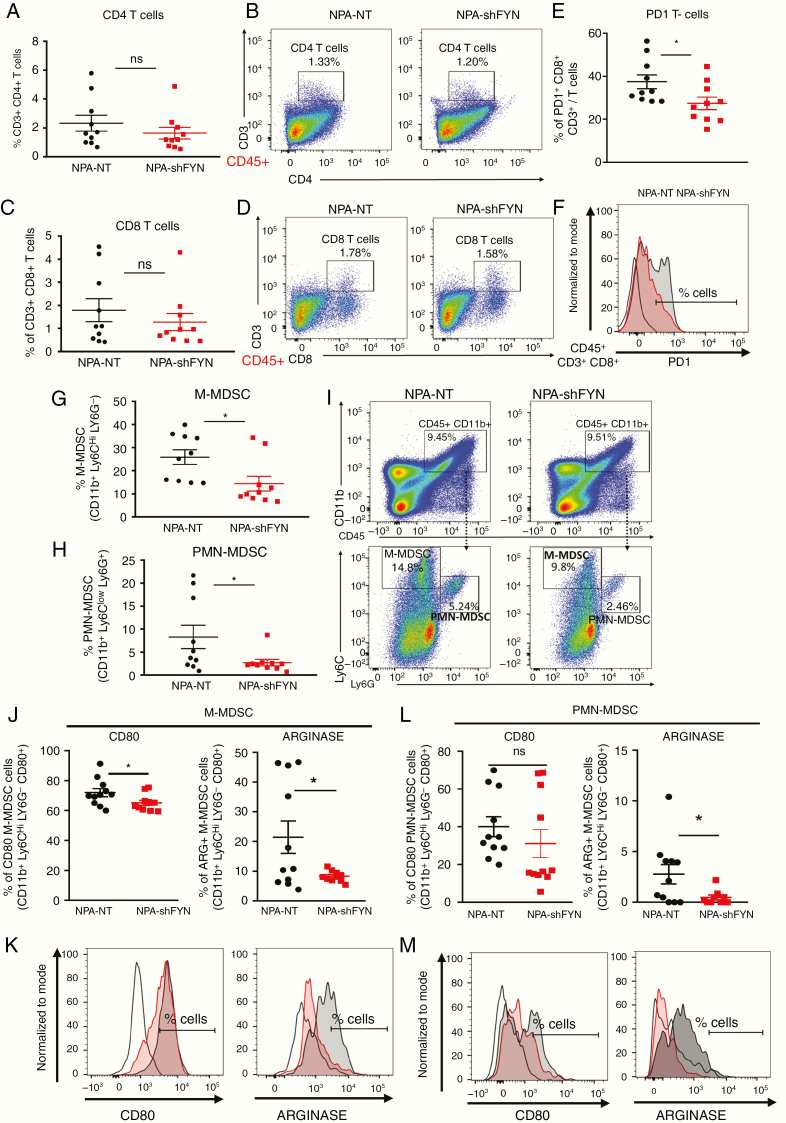
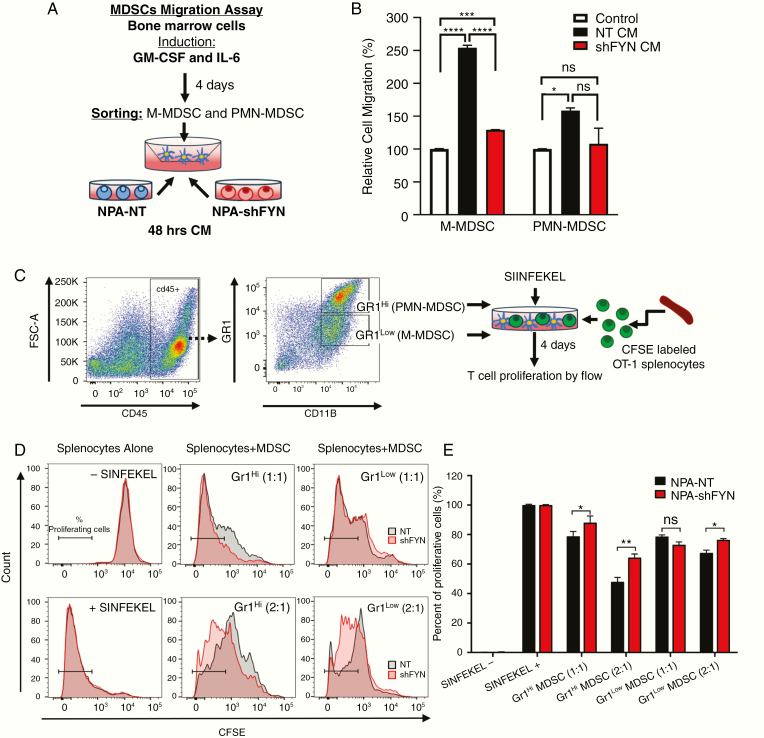
Results: We demonstrate that Fyn knockdown in diverse immune-competent GEMMs of glioma reduced tumor progression and significantly increased survival. Gene ontology (GO) analysis of differentially expressed genes in wild-type versus Fyn knockdown gliomas showed enrichment of GOs related to immune reactivity. However, in NSG and CD8-/- and CD4-/- immune-deficient mice, Fyn knockdown gliomas failed to show differences in survival. These data suggest that the expression of Fyn in glioma cells reduces antiglioma immune activation. Examination of glioma immune infiltrates by flow cytometry displayed reduction in the amount and activity of immune suppressive myeloid derived cells in the Fyn glioma TME.

Conclusions: Gliomas employ Fyn mediated mechanisms to enhance immune suppression and promote tumor progression. We propose that Fyn inhibition within glioma cells could improve the efficacy of antiglioma immunotherapies.

Keywords: Fyn tyrosine kinase; antitumor immune responses; glioma; myeloid-derived suppressor cells.


Figures

Fig. 1
Fig. 1
Fyn is a potential regulator of aggressiveness in mouse gliomas. (A) Fyn tyrosine signals downstream from mutated membrane RTK and integrin driver genes. Red: mutation/amplification, green: mutation/deletion, orange: Fyn overexpression. (B) Kaplan–Meier survival curves of implantable mouse glioma models show difference in tumor malignancy. NPAI display an increased survival compared with NP and NPA glioma-bearing mice. NPAI (MS, 34 days; n = 4), NP (MS, 24 days; n = 4), NPA (MS, 23 days; n = 4). (C) Fyn levels correlate positively with glioma cell malignancy in western blot analysis comparing Fyn and Src levels in mouse (NP, NPA, NPAI) glioma cells; loading control = β-actin. (D) Network of DE genes in high malignancy NPA vs low malignancy NPAI mouse glioma neurospheres. Fyn is the largest yellow octagon. Clusters of nodes of identical color represent a module of highly interacting genes. The Fyn network is highlighted in yellow. (E) Right panel: the Fyn network; Fyn has a degree of 63. Red lines indicate edges connecting nodes to Fyn.
Fig. 2
Fig. 2
Knocking down Fyn in GEMM prolongs animal survival. (A–C) Kaplan–Meier survival curves of SB mouse glioma models demonstrate that animals bearing Fyn knockdown tumors have increased median survival. (A) NP (MS, 94 days; n = 15) versus NPF (MS, 131 days; n = 29). (B) NPA (MS, 80 days; n = 16) versus NPAF (MS, 142 days; n = 28). (C) NPD (MS, 69 days; n = 15) versus NPDF (MS, 108 days; n = 23). Log-rank (Mantel–Cox) test; ***P < 0.001, ****P < 0.0001. (D–F, top) Fyn expression in tumors (green = tumor, blue = DAPI [4′,6′-diamidino-2-phenylindole] stained nuclei), quantified as fluorescence integrated density using ImageJ software (D–F, bottom); n = 5 per condition, scale bar = 50 μm. Ten random fields per tumor section per animal were imaged. Bars ± SEM are shown (***P < 0.001, *P < 0.05 using linear mixed effect models) (G–I). Histopathological analysis was performed in tumor sections stained with hematoxylin and eosin; shFyn tumors were compared with controls. Scale bars: 100 μm. P: pseudo-palisades, N: necrosis, H: hemorrhage, VP: vascular proliferation, MS, mesenchymal component, SC: small cells, G: giant cells. (J) Table representing histopathological semi-quantitative analysis: very low (+/−), low (+), medium (++), and high (+++). (K‒M) Cell proliferation analysis: Positive P-H3-S10 cells were counted by ImageJ software. Scale bars: 50 μm. P-H3-S10 positive cells per total cells in the visual field; n = 5. Ten fields of each section were selected at random. Error bars represent ± SEM; linear mixed effect models, ***P < 0.001, **P < 0.01.
Fig. 3
Fig. 3
Enrichment in immune-related pathways as potential mechanisms involved in Fyn-mediated tumor growth control. Overrepresented GO biological term in the DE genes dataset was carried out using iPathwayGuide algorithms. Overrepresentation approach to compute the statistical significance was used. P-value is computed using the hypergeometric distribution and corrected for multiple comparisons using elim pruning methods. Minimum DE genes/term of 6. (A) Venn diagram of GO Biological Process. Meta-analysis of different genetic glioma models shows individual GO terms and 58 common biological processes shared between all groups. For GO analysis, genes with 0.05 P-value and a log fold change of at least 0.585 absolute value were considered significant. (B, C, D) Graph representing the top 20 most significant enriched GO terms identified for each individual genetic glioma model. (B) Enriched GO terms of NPF vs NP. (C) Enriched GO terms of NPAF vs NPA. (D) Enriched GO terms of NPDF vs NPD. (E) Bar graph showing the significant overrepresented 58 common GO terms Biological Process identified by meta-analysis.
Fig. 4
Fig. 4
Tumor growth delay and increased survival in Fyn downregulated gliomas are immune mediated. (A, B) Kaplan–Meier survival curves for glioma in C57BL/6 immune-competent mice. (A) NP-Fyn knockdown gliomas displayed significant increases in MS: 27 vs 34 days; *P = 0.011. (B) Mice bearing gliomas with NPA-Fyn knockdown displayed significant increase in MS: 20 vs 30 days; **P = 0.0031 compared with the control; n = 5. Fyn expression was detected by immunofluorescence. Tumor: green; nuclei: blue; scale bars: 50 μm. (C, D) Kaplan–Meier survival curves in NSG immune-compromised mice. (C) NP-Fyn knockdown gliomas displayed no significant increases in MS (24 vs 26 days; P = 0.06) n = 9/10. (D) NPA-Fyn knockdown displayed a minor increase in MS (22 vs 24 days; *P = 0.044); n = 5. (E, F) Kaplan–Meier survival curve for NPA-NT vs NPA-shFyn glioma in (E) CD8 and (F) CD4 knockout immune-deficient mice. No significant difference was observed in survival. For each implantable model, n = 5 was used. Statistics were assessed using the log-rank Mantel–Cox test.
Fig. 5
Fig. 5
Downregulation of Fyn in glioma modulates immune responses through reduction in MDSC expansion. Immune cells within the TME of NPA-NT or NPA-shFyn tumors were analyzed by flow cytometry. (A, B) Percentage of CD4 T cells (CD4+, CD3+) within the CD45+ cell population. Representative flow plots for each group are displayed. (C, D) Percentage of CD8 T cells (CD8+, CD3+) within the CD45+ cell population. Representative flow plots for each group are displayed. (E, F) Percentage of PD1 + T cells within the CD8 + CD3 + and CD45+ cell population. Representative histogram flow plot for each group are displayed. (G) Percentage of M-MDSCs: CD11b+, Ly6Chi, Ly6G−) within the CD45+ cell population. (H) Percentage of PMN-MDSCs: CD11b+, Ly6Clo, Ly6G+ within the CD45+ cell population. (I) Representative flow plots of M-MDSC and PMN-MDSC cell analysis. (J–M) Percentage of CD80+ and ARG+ cells within (J, K) M-MDSC (CD45+, CD11b+, Ly6Chi, Ly6G−) cell population, and (L–M) PMN-MDSC (CD45+, CD11b+, Ly6Clo, Ly6G+) cell population. (K–M) Representative histogram of CD80+ and ARG+ cell analysis. Red-shaded: NPA-NT, gray-shaded: NPA-shFyn, solid black-dashed: FMO control. Each graph indicates individual values and mean ± SEM (n = 10). Data were analyzed using ANOVA; ns = nonsignificant; *P < 0.05.
Fig. 6
Fig. 6
Fyn knockdown in glioma decreases MDSC migration potential and immune-suppressive activity within the TME. (A) Diagram of experimental design of MDSC Transwell migration assay. MDSCs derived from bone marrow and induced with IL-6 and granulocyte-macrophage colony-stimulating factor were seeded on the top of the Transwell and incubated for 15 hours in NT and shFyn conditioned media. The migrated cells were analyzed using CellTiter-Glo. (B) MDSC migration assay results. Data are expressed as percentage of migrating cells relative to the control (plain media). Error bars represent ± SEM. Experiment was performed 3 times with 3 replicates per treatment. Statistical significance was determined using one-way ANOVA, followed by Duncan multiple comparisons. ns: nonsignificant, *P < 0.05, ***P < 0.001, ****P < 0.0001. (C) Diagram representing the experimental design to analyze the immunosuppressive potential of MDSCs. Gr-1high (PMN-MDSC) and Gr-1low (M-MDSC) were purified from the TME of moribund NPA-NT and NPA-shFyn tumor-bearing mice. They were cultured with carboxyfluorescein succinimidyl ester (CFSE)–labeled splenocytes from Rag2/OT-1 transgenic mice. Cells were stimulated with SIINFEKL peptide and proliferation was analyzed 4 days after by flow cytometry. (D) Representative flow plots for CFSE stains from splenocytes alone SIINFEKL stimulated and nonstimulated, and the effect of SIINFEKL-induced T-cell proliferation in the presence of MDSCs from the TME. Numbers in parentheses indicate the ratio of MDSCs to splenocytes. (E) Graph shows T-cell proliferation relative to SIINFEKEL + control. Experiment was repeated 3 times. Tumors from 5 mice per group were pooled together in each experiment to obtain sufficient number MDSCs. Mean ± SEM are indicated. Data were analyzed using one-way ANOVA, followed by Duncan multiple comparisons. ns: nonsignificant, *P < 0.05, **P < 0.005.

Comment in

References

    1. Reifenberger G, Wirsching HG, Knobbe-Thomsen CB, Weller M. Advances in the molecular genetics of gliomas—implications for classification and therapy. Nat Rev Clin Oncol. 2017;14(7):434–452. - PubMed
    1. Frattini V, Trifonov V, Chan JM, et al. . The integrated landscape of driver genomic alterations in glioblastoma. Nat Genet. 2013;45(10):1141–1149. - PMC - PubMed
    1. Lu KV, Zhu S, Cvrljevic A, et al. . Fyn and SRC are effectors of oncogenic epidermal growth factor receptor signaling in glioblastoma patients. Cancer Res. 2009;69(17):6889–6898. - PMC - PubMed
    1. Yadav V, Denning MF. Fyn is induced by Ras/PI3K/Akt signaling and is required for enhanced invasion/migration. Mol Carcinog. 2011;50(5):346–352. - PMC - PubMed
    1. Jensen AR, David SY, Liao C, et al. . Fyn is downstream of the HGF/MET signaling axis and affects cellular shape and tropism in PC3 cells. Clin Cancer Res. 2011;17(10):3112–3122. - PMC - PubMed

Publication types

Substances