. 2020 Jan 17:9:e53910.
doi: 10.7554/eLife.53910.

Structure of the human BBSome core complex

Affiliations

Structure of the human BBSome core complex

Björn Udo Klink et al. Elife. .

Abstract

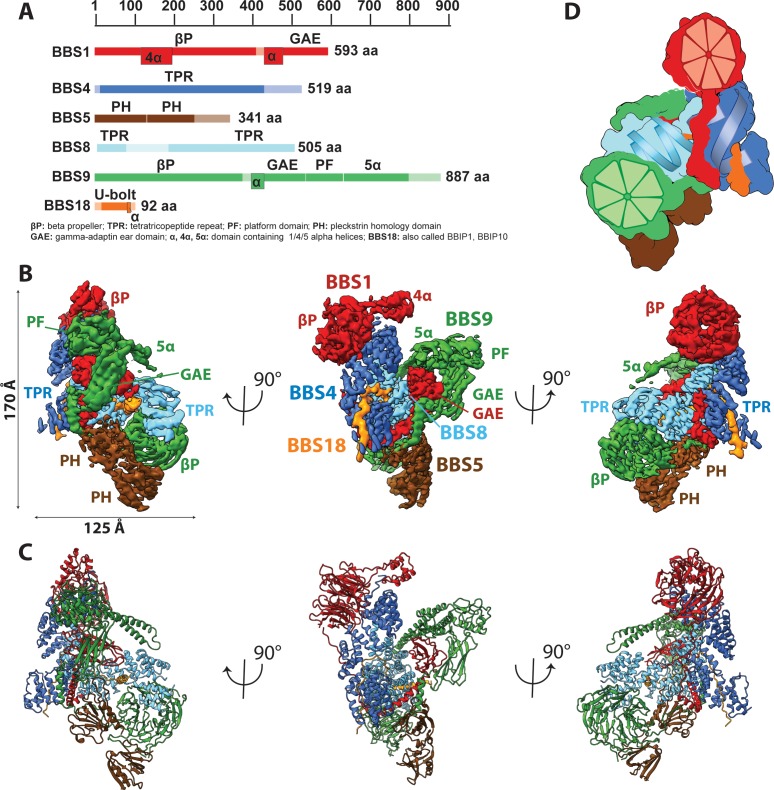
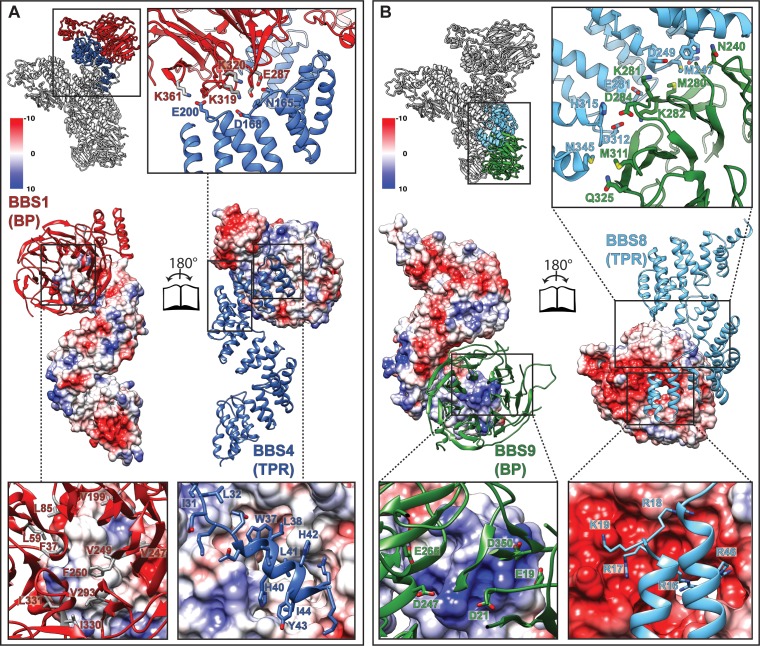
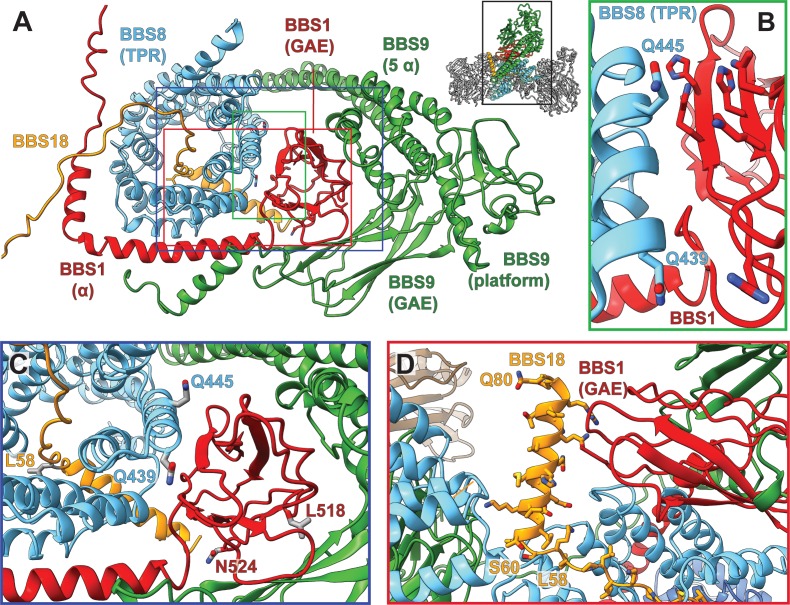
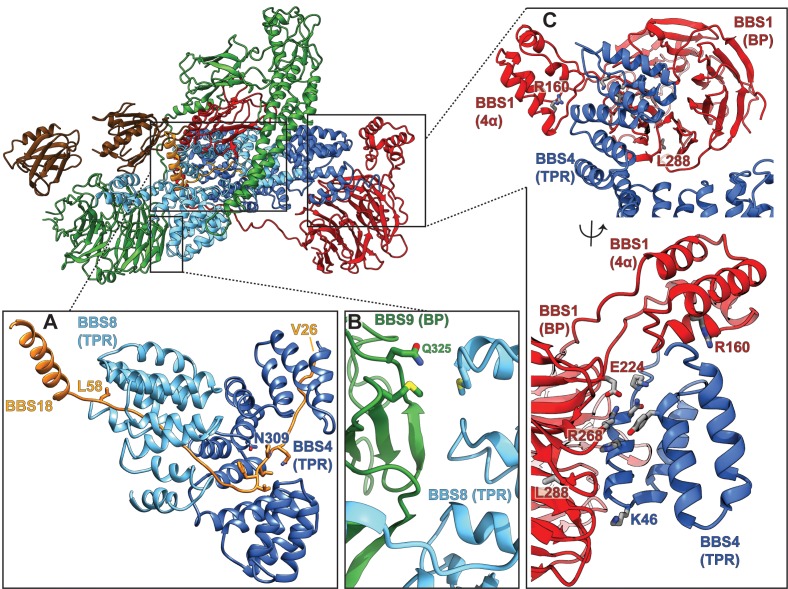
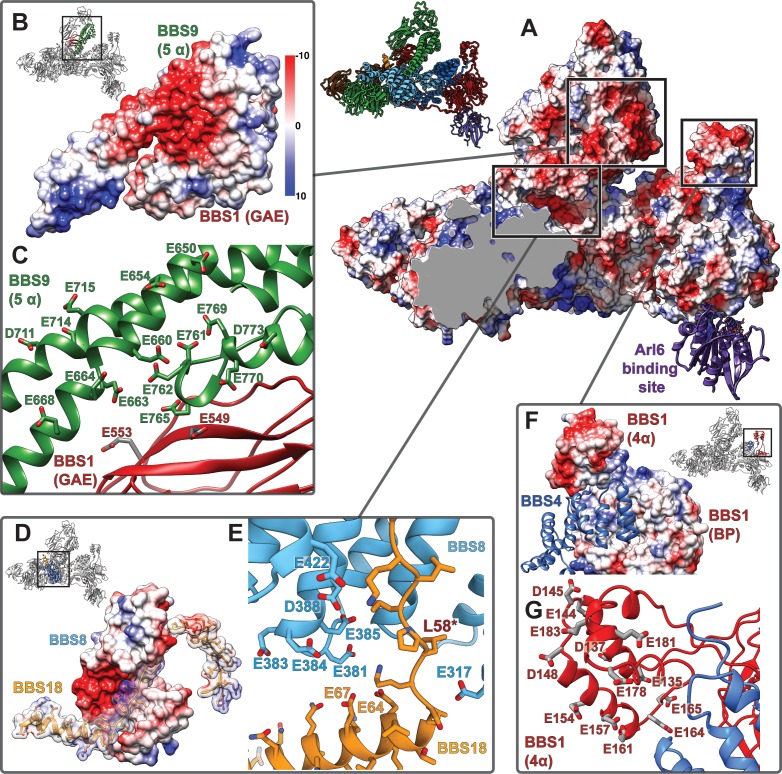
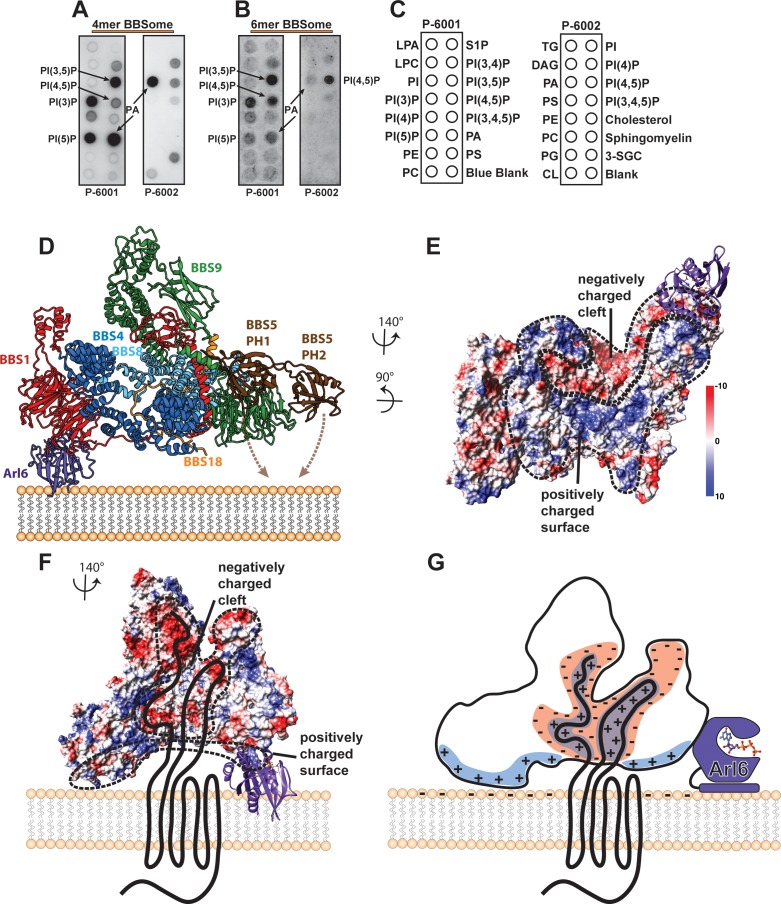
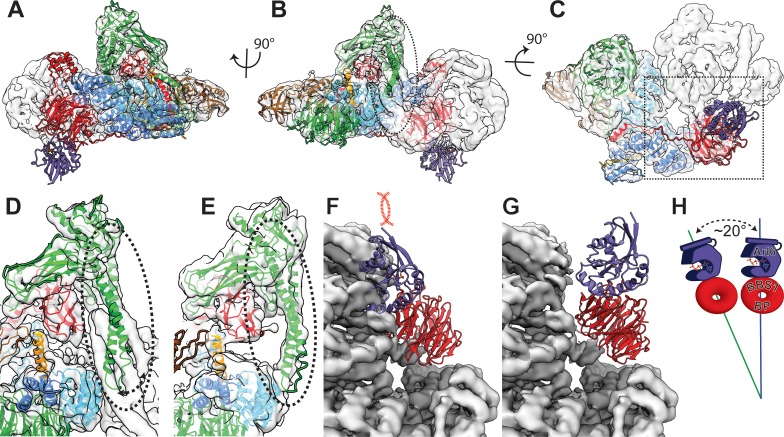
The BBSome is a heterooctameric protein complex that plays a central role in primary cilia homeostasis. Its malfunction causes the severe ciliopathy Bardet-Biedl syndrome (BBS). The complex acts as a cargo adapter that recognizes signaling proteins such as GPCRs and links them to the intraflagellar transport machinery. The underlying mechanism is poorly understood. Here we present a high-resolution cryo-EM structure of a human heterohexameric core subcomplex of the BBSome. The structure reveals the architecture of the complex in atomic detail. It explains how the subunits interact with each other and how disease-causing mutations hamper this interaction. The complex adopts a conformation that is open for binding to membrane-associated GTPase Arl6 and a large positively charged patch likely strengthens the interaction with the membrane. A prominent negatively charged cleft at the center of the complex is likely involved in binding of positively charged signaling sequences of cargo proteins.

Keywords: Arl6; BBSome; GCPR; ciliary transport; cryo-EM; human; membrane; molecular biophysics; structural biology.


Conflict of interest statement

BK, CG, OH, AW, SR No competing interests declared

Figures

Figure 1.
Figure 1.. Architecture of the BBSome.
(A) Domain architecture of the protomers forming the BBSome core complex. The parts of the primary structure that could be assigned in the density is shown in full colors, while non-modeled regions are represented in opaque colors. (B) Composite cryo-EM density map of the BBSome core complex in different orientations. Each protomer is colored differently and the thresholds of the segmented densities of the individual domains were adjusted to visualize each domain at an optimal signal intensity. BBS5 is poorly visible at the signal level of the other subunits and required a reconstruction from a subset of particles, which was obtained by 3D-sorting (Figure 1—figure supplement 1). (C) The final model of the core BBSome. (D): Schematic representation of the complex, highlighting the two β-propeller domains of BBS1 and BBS9 as red and green segmented wheels, and the super helical arrangements of the TPR repeats of BBS4 and BBS8 as blue and cyan helices.
Figure 1—figure supplement 1.
Figure 1—figure supplement 1.. Positioning of BBS5 in the BBSome core complex.
(A) Pairs of exemplary 2D class averages of BBSome core complexes with and without BBS5 in different views (scale bar 5 nm) (B) Comparison of the reconstructions from all available data and the best obtained cluster after 3D sorting which contains BBS5. (C) The same view of the final, combined density map; (D) FSC curves of the full dataset compared to the best cluster containing BBS5; (E) fit of PH domains of BBS5 into density from Cluster1.
Figure 1—figure supplement 2.
Figure 1—figure supplement 2.. Quality of the model of the BBSome core complex.
(A) Cryo-EM micrograph and representative class averages of the core BBSome. Scale bars, 100 nm (micrograph) and 10 nm (class averages). (B) FSC of two independently refined half data sets (black line), as well as the FSC between the volume calculated from all particles and the molecular model of the core BBSome (blue line). (C) Angular distribution of particles that were used for the final reconstruction. (D) Cryo-EM density map of the full dataset colored according to local resolution. (E) Distribution of temperature factor (B-Factor) in the final model, including BBS5. The relative position and B-Factor distribution of BBS5 was derived from a reconstruction of a subset of particles (see Figure 1—figure supplement 1). (F–I) Examples of the molecular model and the corresponding electron density map from different regions of the structure.
Figure 1—figure supplement 3.
Figure 1—figure supplement 3.. Single particle processing workflow for structure determination of the human core BBSome.
The map that was used for modelling BBSome subunits 1,4,8,9 and 18 is marked with a blue box, and the map that was used for BBS5 is marked with a green box.
Figure 1—figure supplement 4.
Figure 1—figure supplement 4.. Sequence assignment of BBS18.
(A) Only about two third of the 92 residues of BBS18 are visible in the calculated electron density, and besides a short helical region the protomer contains no defined secondary structure, which complicates an assignment of the correct sequence frame. To unambiguously find the correct frame, we first built a poly-alanine model into the density (B). With only 92 residues of BBS18, there were 33 potential BBS18 sequence frames that could be assigned to the model. We generated all these 33 models, and further refined each of them using Phenix real-space refinement (Adams et al., 2010) (C–F). The correlation of the map to the refined model showed a clear best fit for frame 22 (F). Indeed, model #22 agreed best to the observed density. In contrast, the other models showed significant deviations from map to model that cannot be explained by noise, imperfect modelling or a lack of resolution (e.g. obvious side chain density for a residue that should not produce such density; C,D). The second best fit (model #33) also presented obvious discrepancies with the map, and more importantly, several charged residues (e.g. D53 and E56 in model #33) are positioned in a highly unfavorable chemical environment (G). In contrast, the interactions with other subunits are favorable for frame #22 (G,I). We used model 22 for further manual refinement to obtain the final BBS18 model (H).
Figure 1—figure supplement 5.
Figure 1—figure supplement 5.. Partially structured insert in BBS8, and hypothetical model for BBS9 dimerization.
(A) A de novo structure prediction of human BBS8 as generated by Raptor X (Wang et al., 2018; Wang et al., 2016; Wang et al., 2017a; Wang et al., 2017b) indicates an unstructured region between a short N-terminal and a larger C-terminal TPR domain. This prediction is consistent with the final atomic model of BBS8 within the core BBSome structure, which contains both the N-and C-terminal TPR parts, but could only partially resolve the unstructured insert. (B) The N-terminus of BBS8 (purple ribbon) descends into an unstructured region that could partially be traced to loop through the center of the core BBSome complex, forming interactions with BBS8 and the U-bolt region of BBS18. Extra density indicates how the loop approximately winds back to connect to the C-terminal part of BBS8, which is also indicated by a red dashed line. The loop seems to interact with an unresolved insert within the BBS9 β-propeller that also contributes to the unexplained density (green dashed line). (C) Model for the dimerization of isolated BBS9 via its C-terminal GAE, platform and α-helical domains. A copy of BBS9 was superimposed with BBS1 via their homologous GAE domains, which provides a hypothetical dimerization interface of BBS9 that could explain why isolated BBS9 dimerizes via its C-terminus, while in the BBSome complex it does not dimerize (Klink et al., 2017).
Figure 1—figure supplement 6.
Figure 1—figure supplement 6.. Surface potential and surface hydrophobicity of the core BBSome.
Figure 2.
Figure 2.. Arrangement of subunits and domains within the BBSome core.
(A–E) The described order of addition of subunits has been chosen for visual clarity and does not reflect the sequential assembly in vivo. BBS4 and BBS8 are shown in two different views to visualize the superhelical arrangement of the TPR repeats. Likewise, domains of BBS1 and BBS9 are also shown individually in two views.
Figure 3.
Figure 3.. Interactions of the TPR repeat proteins BBS4 and BBS8 with β-propellers of BBS1 and BBS9, respectively.
(A) Open book representation of the interaction surface of BBS4 with the β-propeller (BP) of BBS1. The interacting subunits are shown in ribbon and surface representations, respectively. Close-up views show relevant residues of the interaction surface. (B) Analogous open book representation of the interaction surface of BBS8 with the β-propeller (BP) of BBS9.
Figure 4.
Figure 4.. Pathogenic patient mutations within the interaction surface of BBS8 with BBS18 and with the C-termini of BBS1 and BBS9.
(A) The GAE domain of BBS1 binds to BBS8 and is embraced by the C-terminus of BBS9. (B,C) Pathogenic patient mutations Q439H and Q445K on BBS8 and L518P and N524Δ on BBS1 disturb this interface. (D) In contrast, the C-terminal BBS18 helix (Ser60-Gln80) only interacts weakly with the complex, and is held in place by interactions with the GAE domain of BBS1. The pathogenic patient mutation L58* eliminates this helix.
Figure 5.
Figure 5.. Pathogenic patient mutations within the core BBSome complex with the potential to disturb subunit interactions.
(A) Interactions of BBS4 and BBS8 with the BBS18 ‘U-bolt’ region (Val26-Lys59) stabilize the central spine of the complex. The mutation N309K disturbs a tight interaction of BBS4 with the main-chain of BBS18 in the U-bolt. The pathogenic patient mutation L58* eliminates the C-terminal helix of BBS18 but leaves the ‘U-bolt’ region that clamps together BBS4 and BBS8 intact. (B) The pathogenic mutation Q325R in BBS9 is located at the interface of the BBS9 β-propeller with BBS8. (C) Several pathogenic patient mutations are located at the interface of the BBS1 β-propeller and its helical insertion with the N-terminus of BBS4 (R160Q, E224K, R268P, L288R), underlining the importance of this interface.
Figure 6.
Figure 6.. Highly negatively charged regions in the central cleft of the BBSome.
(A): An open cleft within the center of the core BBSome contains multiple highly negatively charged regions that might be involved in cargo binding. The Arl6 binding site, as deduced from the crystal structure of the β-propeller of BBS1/Arl6 (Mourão et al., 2014), is shown as purple ribbon. (B,D,F): Surface charges in three hotspots of negative charge within the central cleft. (C,E,G): Positions of negatively charged residues.
Figure 7.
Figure 7.. Interaction of the core BBSome with membranes.
(A–C) The affinity of the 4mer BBSome complex containing BBS4, 8, 9 and 18 (A) and of the core BBSome complex containing BBS1, 4, 5, 8, 9, 18 (B) to different lipids were probed in a protein-lipid overlay assay. For this, hydrophobic membranes with immobilized lipids as depicted in (C) (so-called ‘PIP-strips’, Echelon) were blocked with TBS-T + 3% fatty acid–free BSA and then incubated with 7.5 µg/ml complex for one hour at room temperature. After washing three times with TBS-T + 3% fatty acid–free BSA, immobilized complexes were detected by Western blot against the Flag-tag on BBS8. The PIP strip experiments indicate that BBSome subcomplexes interact specifically with PIPs even in the absence of both the Arl6-binding subunit BBS1 and the previously described PIP-binding subunit BBS5 (40). (D): Potential orientation of the BBSome core complex towards the membrane. The orientation of Arl6 towards the BBSome was deduced from the crystal structure of the β-propeller of BBS1/Arl6 (Mourão et al., 2014), which was overlaid with the BBS1 β-propeller from the BBSome core complex. In such an arrangement, a positively charged surface of the core complex would be oriented towards the membrane (E,G) and a negatively charged cleft in the vicinity of BBS1 is favorably positioned to accept BBSome-binding regions from cargo proteins like GPCRs (E–G), which were found to be mostly positively charged (Klink et al., 2017). A model how GPCRs might be recognized by the BBSome is depicted in (G).
Figure 7—figure supplement 1.
Figure 7—figure supplement 1.. Comparison of bovine BBSome with human core BBSome.
(A–C) A rigid body fit of the human core BBSome structure into the bovine BBSome density (Chou et al., 2019) shows a similar overall arrangement, but distinct differences in the orientation of the α-hairpin of BBS9 in the C-terminal domain (dashed circle), and no clashes of the Arl6 binding site (purple domain). (D–E) Closeup views of the α-hairpin of BBS9 in the densities of bovine BBSome (D) and human core BBSome (E) show that the hairpin reorients towards BBS8 in the absence of BBS2 and BBS7. (F) Fitting the crystal structure of the BBS1 β-propeller in complex with Arl6 (Mourão et al., 2014) into the corresponding density of the BBS1 β-propeller in bovine BBSome indicates a clash of the Arl6 binding site with BBS2 and BBS7 (25). (G) An overlay of the orientation of the BBS1 β-propeller in human core BBSome with the density of the bovine BBSome shows a ~ 20° change in orientation (H), which is sufficient to avoid the clash of the Arl6 binding site with BBS2 and BBS7.

Comment in

References

    1. Adams PD, Afonine PV, Bunkóczi G, Chen VB, Davis IW, Echols N, Headd JJ, Hung LW, Kapral GJ, Grosse-Kunstleve RW, McCoy AJ, Moriarty NW, Oeffner R, Read RJ, Richardson DC, Richardson JS, Terwilliger TC, Zwart PH. PHENIX: a comprehensive Python-based system for macromolecular structure solution. Acta Crystallographica Section D Biological Crystallography. 2010;66:213–221. doi: 10.1107/S0907444909052925. - DOI - PMC - PubMed
    1. Anandakrishnan R, Aguilar B, Onufriev AV. H++ 3.0: automating pK prediction and the preparation of biomolecular structures for atomistic molecular modeling and simulations. Nucleic Acids Research. 2012;40:W537–W541. doi: 10.1093/nar/gks375. - DOI - PMC - PubMed
    1. Barbelanne M, Hossain D, Chan DP, Peränen J, Tsang WY. Nephrocystin proteins NPHP5 and Cep290 regulate BBSome integrity, ciliary trafficking and cargo delivery. Human Molecular Genetics. 2015;24:2185–2200. doi: 10.1093/hmg/ddu738. - DOI - PMC - PubMed
    1. Begley MJ, Taylor GS, Kim SA, Veine DM, Dixon JE, Stuckey JA. Crystal structure of a phosphoinositide phosphatase, MTMR2: insights into myotubular myopathy and Charcot-Marie-Tooth syndrome. Molecular Cell. 2003;12:1391–1402. doi: 10.1016/s1097-2765(03)00486-6. - DOI - PubMed
    1. Bhogaraju S, Engel BD, Lorentzen E. Intraflagellar transport complex structure and cargo interactions. Cilia. 2013;2:10. doi: 10.1186/2046-2530-2-10. - DOI - PMC - PubMed

Publication types

Substances