. 2020 Oct 1;59(10):2734-2745.
doi: 10.1093/rheumatology/kez623.

A reverse translational study on the effect of rituximab, rituximab plus belimumab, or bortezomib on the humoral autoimmune response in SLE

Affiliations

A reverse translational study on the effect of rituximab, rituximab plus belimumab, or bortezomib on the humoral autoimmune response in SLE

Laura S van Dam et al. Rheumatology (Oxford). .

Abstract

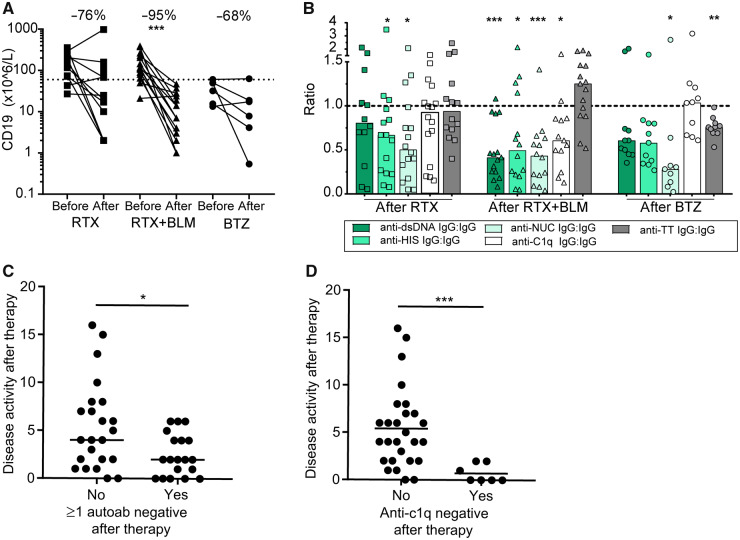
Objectives: SLE is a severe autoimmune disease characterized by autoreactive B cells and IC formation, which causes systemic inflammation. B cell-targeted therapy could be a promising treatment strategy in SLE patients; nevertheless, randomized clinical trials have not always been successful. However, some groups have demonstrated beneficial effects in severe SLE patients with off-label rituximab (RTX) with belimumab (BLM), or bortezomib (BTZ), which targeted different B cells subsets. This study assembled sera from SLE cohorts treated with RTX+BLM (n = 15), BTZ (n = 11) and RTX (n = 16) to get an in-depth insight into the immunological effects of these therapies on autoantibodies and IC formation.

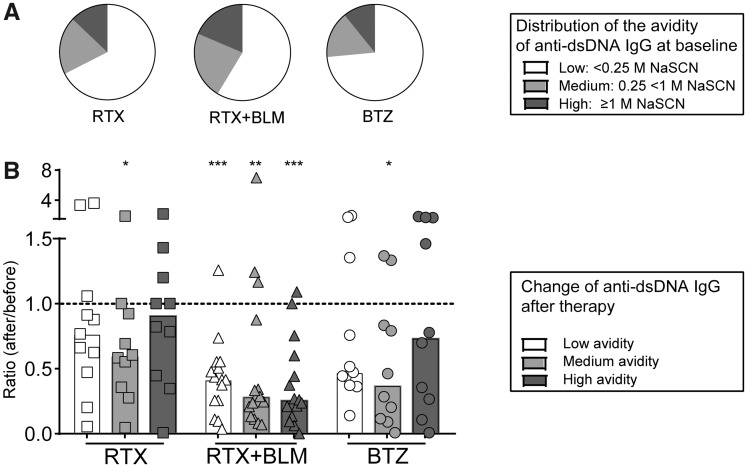
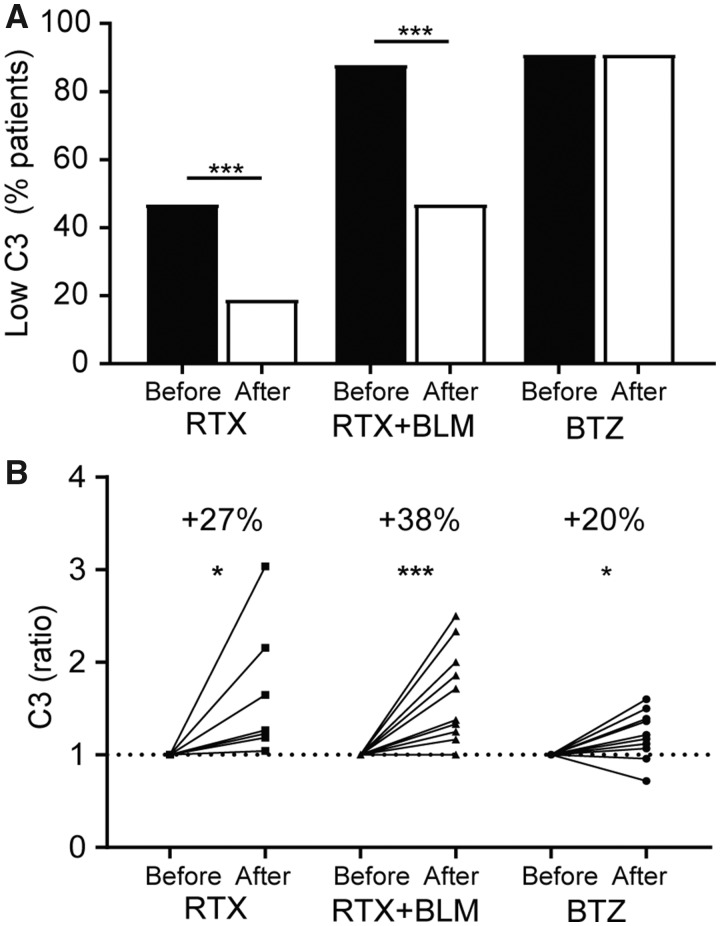
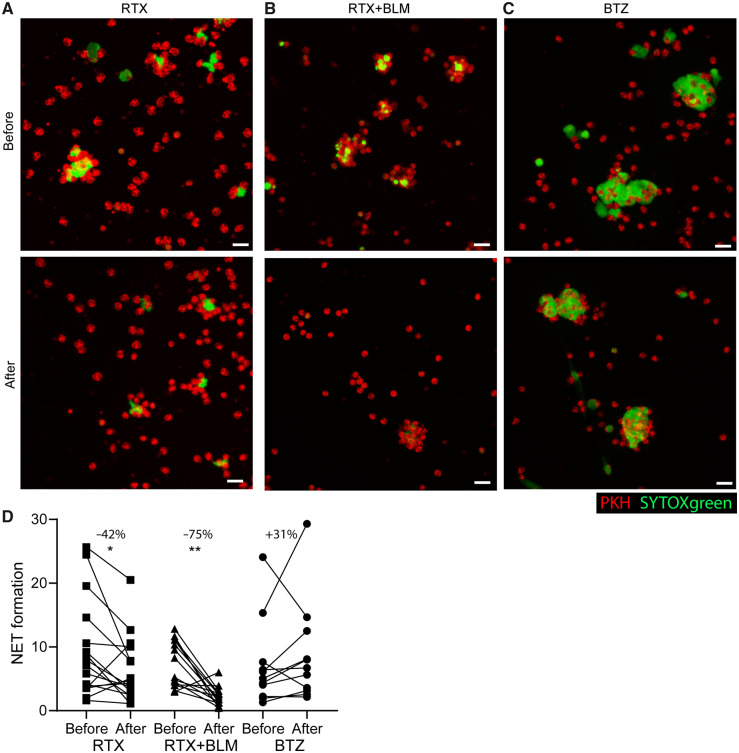
Methods: Autoantibodies relevant for IC formation and the avidity of anti-dsDNA were determined by ELISA. IC-mediated inflammation was studied by complement levels and ex vivo serum-induced neutrophil extracellular trap formation.

Results: Reductions in autoantibodies were observed after all approaches, but the spectrum differed depending upon the treatment. Specifically, only RTX+BLM significantly decreased anti-C1q. Achieving seronegativity of ≥1 autoantibody, specifically anti-C1q, was associated with lower disease activity. In all SLE patients, the majority of anti-dsDNA autoantibodies had low avidity. RTX+BLM significantly reduced low-, medium- and high-avidity anti-dsDNA, while RTX and BTZ only significantly reduced medium avidity. IC-mediated inflammation, measured by C3 levels and neutrophil extracellular trap formation, improved after RTX+BLM and RTX but less after BTZ.

Conclusion: This study demonstrated the impact of different B cell-targeted strategies on autoantibodies and IC formation and their potential clinical relevance in SLE.

Keywords: B cell–targeted therapies; SLE; autoantibodies; immune-complex formation; neutrophil extracellular traps.


Figures

<sc>Fig</sc>. 1
Fig. 1
B cell depletion associated with reduced autoantibody levels (A) The absolute values of CD19+ B cells are shown for each individual patient per cohort before and after treatment. Percentages indicate the median change per cohort. (B) The change in (auto) antibodies for each individual patient per cohort is expressed as a ratio of the normalized ratio of anti-TT IgG (grey bars), anti-dsDNA (dark green), anti-histones (middle green), anti-nucleosomes (light green) and anti-C1q (white) to total IgG after therapy and compared with the ratio at the baseline of these (auto)antibodies to total IgG. Bars indicate the median per cohort. (C) SLE disease activity was assessed in SLE patients who did not achieve seronegativity of any of the autoantibodies compared with SLE patients who did achieve seronegativity of at least one autoantibody. (D) SLE disease activity was assessed in anti-C1q–positive SLE patients who achieved seronegativity of these anti-C1q autoantibodies and compared with the patients who did not achieve anti-C1q seronegativity. The Wilcoxon matched-pairs signed rank test was used to test statistical differences between baseline and after different targeted therapies in paired patient serum samples. The Mann–Whitney U test was used to test statistical difference between two groups. *P <0.05, **P < 0.01, ***P < 0.001. BLM: belimumab; BTZ: bortezomib; HIS: histones; NUC: nucleosomes; RTX: rituximab.
<sc>Fig</sc>. 2
Fig. 2
RTX+BLM targets low-, medium- and high-avidity anti-dsDNA autoantibodies, whereas RTX and BTZ target only medium-avidity anti-dsDNA (A) Distribution of low-, medium- and high-avidity anti-dsDNA autoantibodies is displayed as mean percentages within the total of anti-dsDNA autoantibodies per cohort at baseline. (B) The ratio of the absolute serum titres of low-, medium- and high-avidity anti-dsDNA autoantibodies as compared with baseline are shown for each patient. Bars indicate the median per cohort. *P < 0.05, **P < 0.01, ***P < 0.001. BLM: belimumab; BTZ: bortezomib; RTX: rituximab.
<sc>Fig</sc>. 3
Fig. 3
Complement consumption is normalized after RTX and RTX+BLM, but not after BTZ (A) The percentage of SLE patients that had reduced C3 levels (see supplementary figure 2B) in sera before (black bars) and after (white bars) rituximab (RTX), rituximab with belimumab (RTX+BLM) or bortezomib (BTZ) are displayed. (B) The change of C3 serum titres after RTX, RTX+BLM and BTZ as ratios compared with baseline are displayed. The Wilcoxon matched-pairs signed rank test was used to test statistical differences between baseline and after different targeted therapies in paired patients. *P < 0.05, ***P < 0.001, RTX: rituximab; BLM: belimumab; BTZ: bortezomib.
<sc>Fig</sc>. 4
Fig. 4
Serum-induced NET formation is significantly decreased after RTX and RTX+BLM, but is not affected by BTZ Healthy PKH-labelled neutrophils were stimulated with sera of SLE patients at baseline and after treatment with B cell–targeted therapies to induce NET formation. NET formation was quantified three-dimensionally with immunofluorescence microscopy through analyzing the cumulative extracellular DNA area (SYTOX green) over Z-stacks per imaged neutrophils (red). Representative pictures of the quantitative assay of SLE serum-induced NET formation at baseline and after (A) RTX, (B) RTX+BLM and (C) BTZ. White scale bar = 20µM. (D) NET formation is expressed as absolute NET area per imaged neutrophil before and after B cell–targeted therapy for each individual SLE patient (individual lines) per cohort. Percentages indicate the median change per cohort. Wilcoxon matched-pairs signed rank test was used to test statistical differences between baseline and after different targeted therapies in paired patient serum samples. *P < 0.05, ** P < 0.01. RTX: rituximab; BLM: belimumab; BTZ: bortezomib.

References

    1. Rahman A, Isenberg DA.. Systemic lupus erythematosus. N Engl J Med 2008;358:929–39. - PubMed
    1. Yaniv G, Twig G, Shor DB. et al. A volcanic explosion of autoantibodies in systemic lupus erythematosus: a diversity of 180 different antibodies found in SLE patients. Autoimmun Rev 2015;14:75–9. - PubMed
    1. Sterner RM, Hartono SP, Grande JP.. The pathogenesis of lupus nephritis. J Clin Cell Immunol 2014;5(2):205. - PMC - PubMed
    1. Rijnink EC, Teng YKO, Wilhelmus S. et al. Clinical and histopathologic characteristics associated with renal outcomes in lupus nephritis. Clin J Am Soc Nephrol 2017;12:734–43. - PMC - PubMed
    1. van Dam LS, Kraaij T, Kamerling SWA. et al. Intrinsically distinct role of neutrophil extracellular trap formation in antineutrophil cytoplasmic antibody–associated vasculitis compared to systemic lupus erythematosus. Arthritis Rheumatol 2019;71:2047–58. - PMC - PubMed

Publication types

MeSH terms