. 2020 Jan 17;18(1):e3000586.
doi: 10.1371/journal.pbio.3000586. eCollection 2020 Jan.

Dating genomic variants and shared ancestry in population-scale sequencing data

Affiliations

Dating genomic variants and shared ancestry in population-scale sequencing data

Patrick K Albers et al. PLoS Biol. .

Abstract

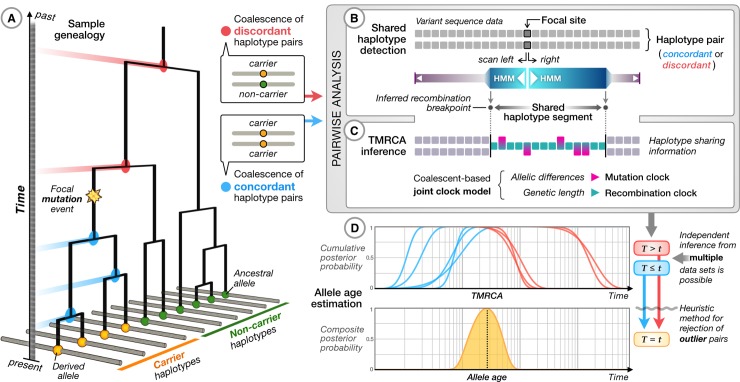
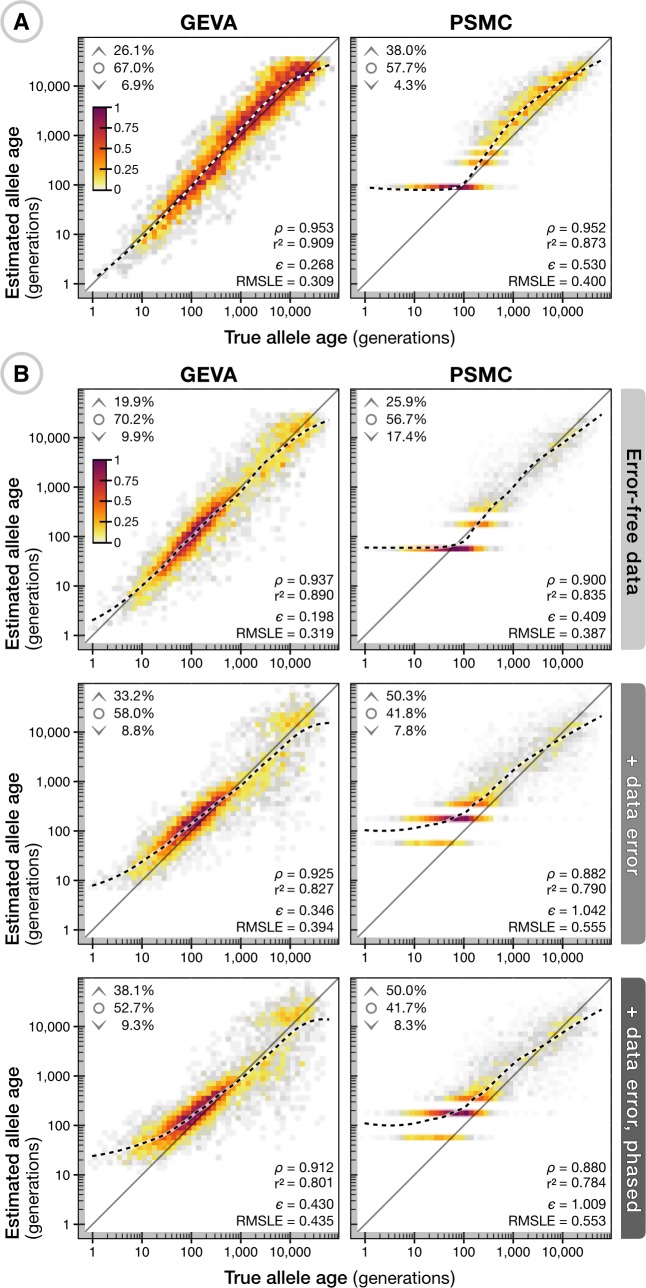
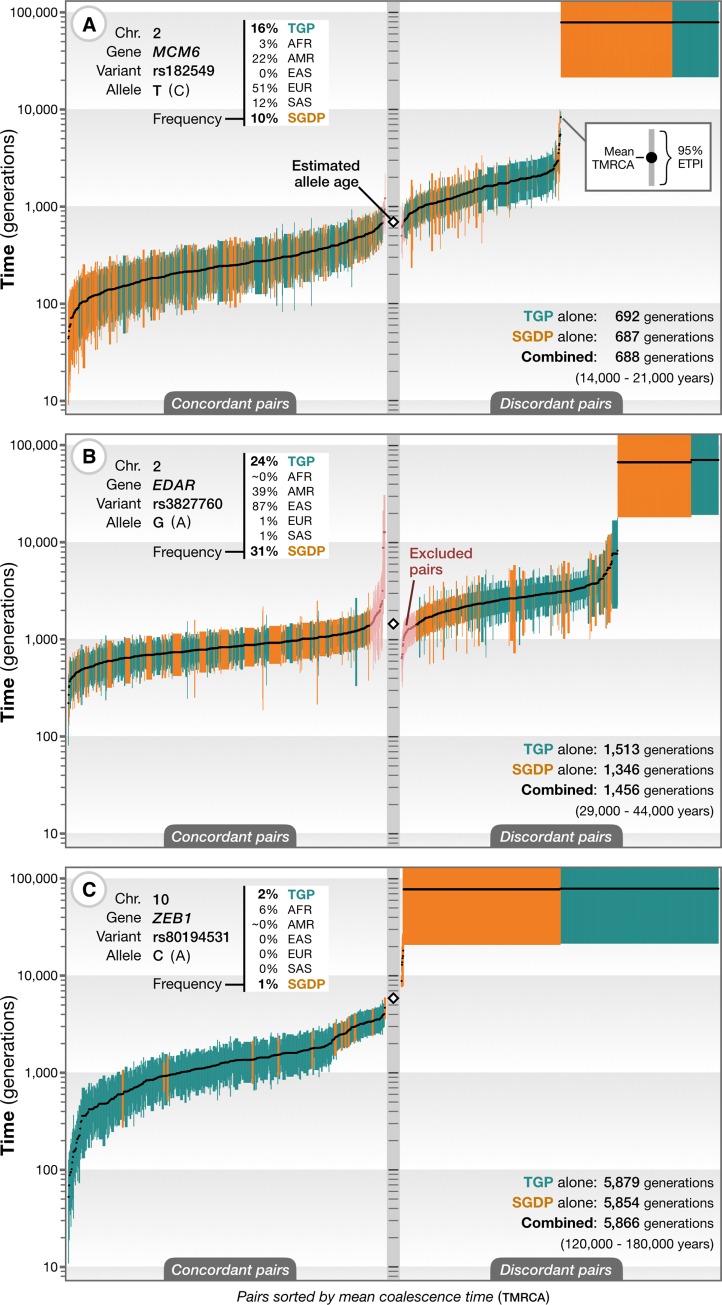
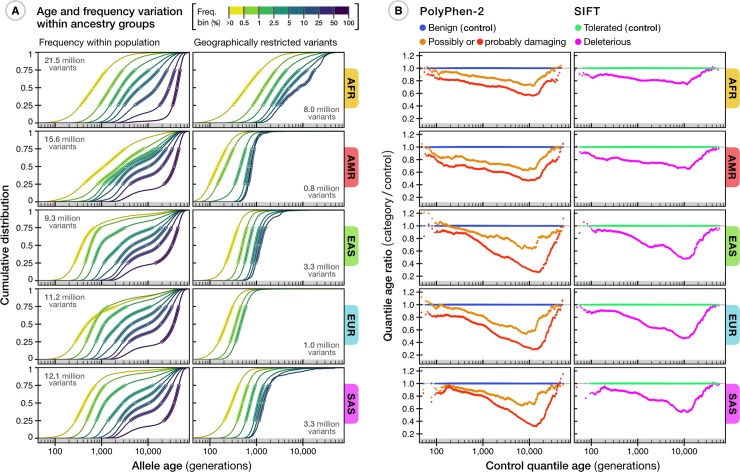
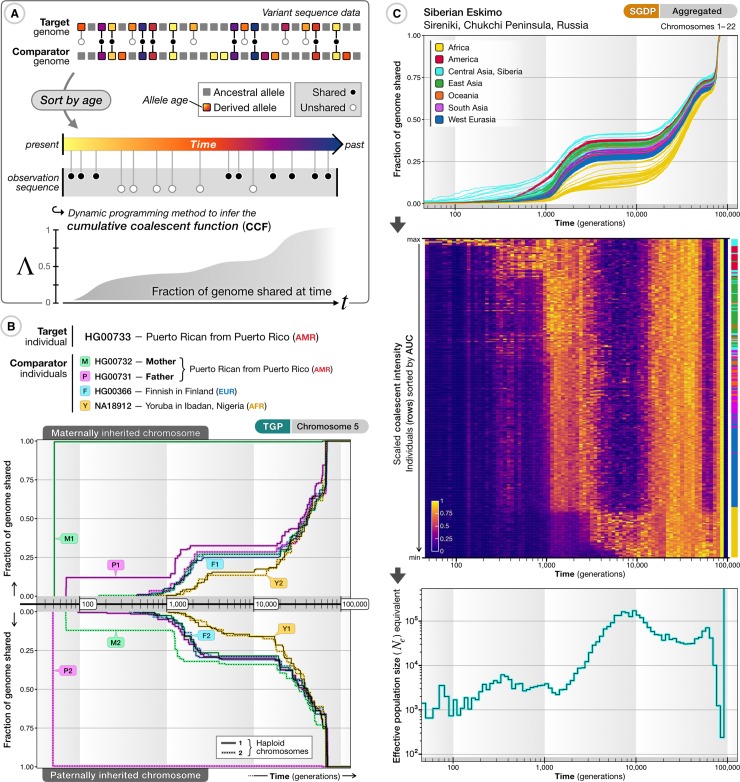
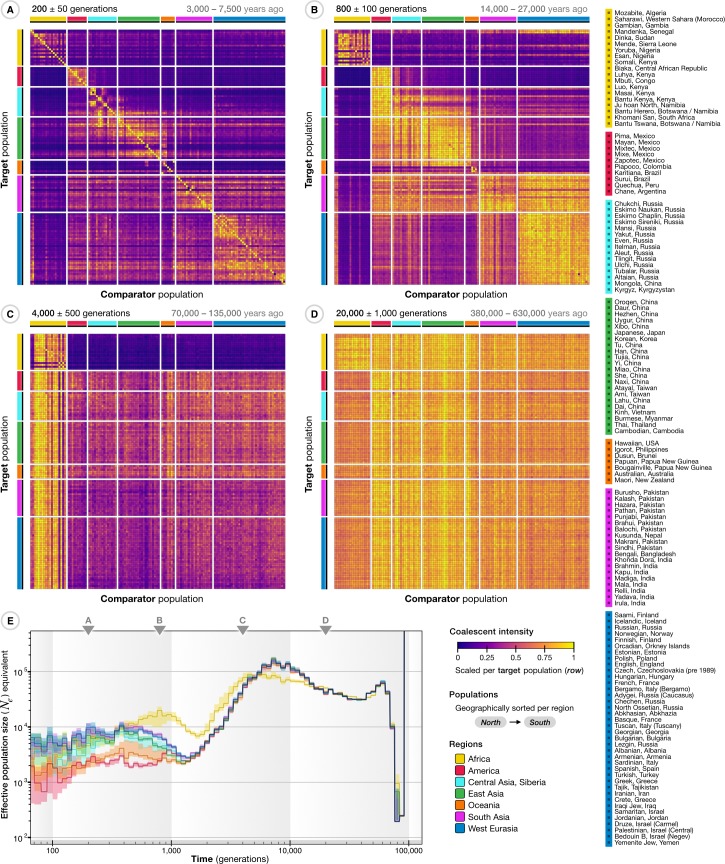
The origin and fate of new mutations within species is the fundamental process underlying evolution. However, while much attention has been focused on characterizing the presence, frequency, and phenotypic impact of genetic variation, the evolutionary histories of most variants are largely unexplored. We have developed a nonparametric approach for estimating the date of origin of genetic variants in large-scale sequencing data sets. The accuracy and robustness of the approach is demonstrated through simulation. Using data from two publicly available human genomic diversity resources, we estimated the age of more than 45 million single-nucleotide polymorphisms (SNPs) in the human genome and release the Atlas of Variant Age as a public online database. We characterize the relationship between variant age and frequency in different geographical regions and demonstrate the value of age information in interpreting variants of functional and selective importance. Finally, we use allele age estimates to power a rapid approach for inferring the ancestry shared between individual genomes and to quantify genealogical relationships at different points in the past, as well as to describe and explore the evolutionary history of modern human populations.


Conflict of interest statement

I have read the journal's policy and the authors of this manuscript have the following competing interests: GM is a shareholder in and non-executive director of Genomics PLC, and is a partner in Peptide Groove LLP. PKA is a shareholder in and a director of BioMe Oxford Ltd.

Figures

Fig 1
Fig 1. Overview of the GEVA method.
(A) At the chromosomal location of a variant, there exists an underlying (and unknown) genealogical tree describing the relationship between the samples. We assume that the derived allele (inferred by comparison to outgroup sequences) arose once in the tree. For concordant pairs of carrier chromosomes (yellow terminal nodes), their MRCAs (blue nodes) occur more recently than the focal mutation event. For discordant pairs of chromosomes, between the ancestral allele (green terminal nodes) and the derived allele, the MRCAs (red nodes) are older than the focal mutation. (B) For each pair of chromosomes (concordant and discordant), we use a simple HMM with an empirically calibrated error model to estimate the region over which the MRCA does not change; that is, the distance to the first detectable recombination event either side of the focal position along the sequence. From the inferred ancestral segment, we obtain the genetic distance and the number of mutations that have occurred on the branches leading from the MRCA to the sample chromosomes. (C) For each pair of chromosomes, we use probabilistic models (see S1 Text) to estimate the posterior distribution of the TMRCA, represented as cumulative distributions of having coalesced for concordant pairs (blue) and of having not coalesced for discordant pairs (red). (D) An estimate of the composite posterior distribution for the time of origin of the mutation is obtained by combining the cumulative distributions for concordant and discordant pairs. Informally, the mutation is expected to be older than concordant and younger than discordant pairs. In practice, this composite-likelihood–based approach results in approximate posteriors that are overconfident; hence, they are summarized by the mode of the distribution. Additional filtering steps are carried out to remove inconsistent pairs of samples (see S1 Text). GEVA, Genealogical Estimation of Variant Age; HMM, hidden Markov model; MRCA, most recent common ancestor; TMRCA, time to the most recent common ancestor.
Fig 2
Fig 2. Validation of GEVA through coalescent simulations.
(A) Density scatterplots showing the relationship between true allele age (geometric mean of lower and upper age of the branch on which a mutation occurred; x axis) and estimated allele age (y axis), using GEVA with the in-built HMM methodology (left) and PSMC (right) for the same set of 5,000 variants. Data were simulated under a neutral coalescent model with sample size N = 1,000, effective population size Ne = 10,000, and with constant and equal rates of mutation (μ = 1 × 10⁻⁸) and recombination (r = 1 × 10⁻⁸) per site per generation. Variants were sampled uniformly from a 100-Mb chromosome, with allele count 1 < x < N. Colors indicate relative density (scaled by the maximum per panel). Upper inserts indicate the fraction of sites where the point estimate (mode of the composite posterior distribution) of allele age lies above the upper age of the branch on which it occurred (^), below the lower age (˅), or within the age range of the branch (∘). Lower inserts indicate the Spearman rank correlation statistic ρ, squared Pearson correlation coefficient (on log scale) r2, interval-adjusted bias metric (see S2 Text) ε, and RMSLE. Also shown is an LOESS fit (second-degree polynomials, neighborhood proportion α = 0.25; dashed line). (B) The relationship between true and inferred ages for 5,000 variants sampled uniformly from a simulation under a complex demographic model with N = 1,000, Ne = 7,300, μ = 2.35 × 10⁻⁸, and variable recombination rates from human chromosome 20 (63 Mb). Allele age was estimated on haplotype data as simulated and without error (top), with error generated from empirical estimates of sequencing errors (middle), and with additional error arising from in silico haplotype phasing; see S2 Text. Allele age was estimated using scaling parameters as specified for each simulation. A further breakdown of results using mutation and recombination clocks alone, as well as the inferred pairwise TMRCAs, is available for A (S1 Fig) and B (S2 Fig, S3 Fig, S4 Fig). GEVA, Genealogical Estimation of Variant Age; HMM, hidden Markov model; LOESS, locally estimated scatterplot smoothing; PSMC, pairwise sequentially Markovian coalescent; RMSLE, root mean-square log10 error; TMRCA, time to the most recent common ancestor.
Fig 3
Fig 3. Application of GEVA to 3 variants of phenotypic and selective importance.
(A) Estimated TMRCAs for concordant (left) and discordant (right) pairs of chromosomes for the derived T allele at rs182549, which lies within an intron of MCM6 and affects regulation of LCT [33], which encodes lactase. Each bar reflects the approximate 95% credible interval (ETPI) for a pair, ordered by posterior mean (black dots). Data from the TGP (green) [2] and the SGDP (orange) [36] were used. The frequency of the variant in the SGDP, the TGP, and the different population groups in the TGP is shown (top left). The inferred allele age in generations from each data source and the combined estimate are shown (bottom right) and converted to an approximate age in years, assuming 20–30 years per generation. See https://human.genome.dating/snp/rs182549 for additional results. (B) As for panel A for the derived G allele of rs3827760, which encodes the Val370Ala variant in EDAR and is associated with sweat and facial and body morphology [41, 42]; also see https://human.genome.dating/snp/rs3827760. Our filtering approach is to remove the smallest number of concordant and discordant pairs necessary (shown in pink) to obtain concordant and discordant sets with nonoverlapping mean posterior TMRCAs. (C) As for panel A for the derived C allele of rs80194531, which encodes the Asn78Thr substitution in ZEB1, reported as pathogenic for corneal dystrophy [43]; also see https://human.genome.dating/snp/rs80194531. Abbreviations refer to ancestry groups. AFR, African; AMR, American; EAS, East Asian; EDAR, Ectodysplasin A Receptor gene; ETPI, equal-tailed probability interval; EUR, European; GEVA, Genealogical Estimation of Variant Age; LCT, Lactase gene; MCM6, Minichromosome Maintenance Complex Component 6 gene; SAS, South Asian; SGDP, Simons Genome Diversity Project; TGP, 1000 Genome Project; TMRCA, time to the most recent common ancestor; ZEB1, Zinc finger E-box–binding homeobox 1 gene.
Fig 4
Fig 4. Age distribution of variants among different human populations.
(A) The relationship between estimated allele age and frequency as observed within a given population group in the TGP sample. Of the 45.4 million variants available in the Atlas of Variant Age, 43.2 million were dated using TGP data alone; we excluded variants with low estimation quality and inconsistent ancestral allele information (see S3 Text), retaining 34.4 million variants. Each line shows the cumulative age distribution of variants within a given frequency bin (see legend) within a population group; circles indicate median and interquartile range. Panels on the left show the frequency-stratified cumulative distribution of estimated age for variants at nonzero frequencies as observed within a given ancestry group. The number of variants available per group is shown (top left). Panels on the right show the distributions of geographically restricted variants that only segregate within a group (number of available variants shown on bottom right). A summary of variants shared between different ancestry groups in the TGP is provided in S6 Fig. (B) Differences in allele age distributions for approximately 70,000 variants in the TGP that are annotated as impacting protein function by PolyPhen-2 (left) and SIFT (right), compared to a reference set of variants (those annotated as benign by PolyPhen-2 or tolerated by SIFT), matched for allele frequency within a given ancestry group. These results are presented in more detail in S7 Fig. AFR, African; AMR, American; EAS, East Asian; EUR, European; PolyPhen-2, Polymorphism Phenotyping v2 software; SAS, South Asian; SIFT, Sorting Intolerant From Tolerant software; TGP, 1000 Genomes Project.
Fig 5
Fig 5. Age-stratified variant sharing to characterize ancestral relatedness.
(A) Overview of approach for estimating the CCF for a pair of haplotypes, the fraction of the genomes of the two samples that have coalesced by a given time. Derived variants within a target genome are identified, their estimated ages are obtained from the Atlas of Variant Age, and their presence (black circles) or absence (white circles) in another (comparator) genome of interest is recorded. Variants are sorted by allele age (indicated by color), t, to obtain a naive maximum likelihood estimate of the CCF, Λ(t), using dynamic programming (assuming independence of variants and ignoring error in variant age estimates). (B) Selected pairwise CCFs for the two haploid genomes (chromosome 5) of individual HG00733 (top: maternally derived; bottom: paternally derived) of a Puerto Rican individual from the TGP compared to 8 haplotypes from 4 individuals, including their mother and father. Maternal and paternal genomes were used for phasing; hence, the inferred parental genomes are the transmitted (and untransmitted) genomes. The CCFs inferred with genomes from the entire TGP sample is shown in S1 Movie. The full result data set for HG00733 is available at https://human.genome.dating/ancestry/HG00733. (C) Inferred genome-wide CCFs (averaged per diploid individual across autosomes) for a Siberian Eskimo from the SGDP (ID: S_Eskimo_Sireniki-1) to all other sampled individuals (top panel). Colors indicate ancestry by geographic region (see legend). The CCF can also be expressed as a CIF (middle panel) to reflect the increase in shared ancestry within a given time period. Each row represents an individual from the SGDP, ordered by the AUC of the CCF and scaled such that the maximum per column is equal to one. The color bar (right) indicates the ancestry group of sorted individuals. The CIF within any time epoch can be expressed as an effective population size (Ne equivalent) from the maximum over reference samples, providing a summary of the rate at which common ancestor events occurred (bottom panel). The full result data set for this individual is available at https://human.genome.dating/ancestry/S_Eskimo_Sireniki-1. AFR, African; AMR, American; AUC, area under the curve; CCF, cumulative coalescent function; CIF, coalescent intensity function; EUR, European; SGDP, Simons Genome Diversity Project; TGP, 1000 Genomes Project.
Fig 6
Fig 6. Age-stratified connections between ancestry groups in the publicly available SGDP sample.
The CCF was inferred for all 556 haploid target genomes with all other comparator genomes in the SGDP sample and then aggregated by ancestry group (mean of CCFs from individuals within a population) and across chromosomes, with populations as defined in the SGDP (see legend on the right). (A–D) The ancestry shared between populations is indicated by the CIF over a given time interval (epoch), shown as a matrix with populations sorted from north to south within continental regions. Intensities were computed from aggregated CCFs to summarize relationships between populations; colors indicate intensity scaled per target population (rows) by the maximum over comparator populations. Ancestral connections are shown at different epochs back in time; around 200 generations ago (A), 800 generations (B), 4,000 generations (C), and 20,000 generations (D). The conversion (top right) assumes 20–30 years per generation. A more detailed summary, showing the ancestry shared between individuals, over a sliding time window (epoch) is shown in S3 Movie. (E) The maximum CIF for individuals from different ancestry groups (continental regions) expressed as effective population size (Ne) equivalents over time, estimated from CCFs aggregated per diploid individual and summarized by the median and interquartile range per group. Triangles indicate the epochs shown in panels A–D. A further breakdown of Ne equivalents estimated from nonaggregated CCFs per chromosome is shown in S8 Fig. CCF, cumulative coalescent function; CIF, coalescent intensity function; SGDP, Simons Genome Diversity Project.

References

    1. Acuna-Hidalgo R, Veltman JA, Hoischen A. New insights into the generation and role of de novo mutations in health and disease. Genome Biol. 2016;17(1):241 10.1186/s13059-016-1110-1 - DOI - PMC - PubMed
    1. Auton A, Abecasis GR, Altshuler DM, Durbin RM, Bentley DR, Chakravarti A, et al. A global reference for human genetic variation. Nature. 2015;526(7571):68–74. 10.1038/nature15393 - DOI - PMC - PubMed
    1. Goodwin S, McPherson JD, McCombie WR. Coming of age: ten years of next- generation sequencing technologies. Nature Publishing Group. 2016;17(6):333–351. - PMC - PubMed
    1. 1000 Genomes Project Consortium, Abecasis GR, Altshuler D, Auton A, Brooks LD, Durbin RM, et al. A map of human genome variation from population-scale sequencing. Nature. 2010;467(7319):1061–1073. 10.1038/nature09534 - DOI - PMC - PubMed
    1. Sherry ST, Ward MH, Kholodov M, Baker J, Phan L, Smigielski EM, et al. dbSNP: the NCBI database of genetic variation. Nucleic acids research. 2001;29(1):308–311. 10.1093/nar/29.1.308 - DOI - PMC - PubMed

Publication types