

Morpho-Functional Evaluation of Full-Thickness Macular Holes by the Integration of Optical Coherence Tomography Angiography and Microperimetry
- PMID: 31952306
- PMCID: PMC7019327
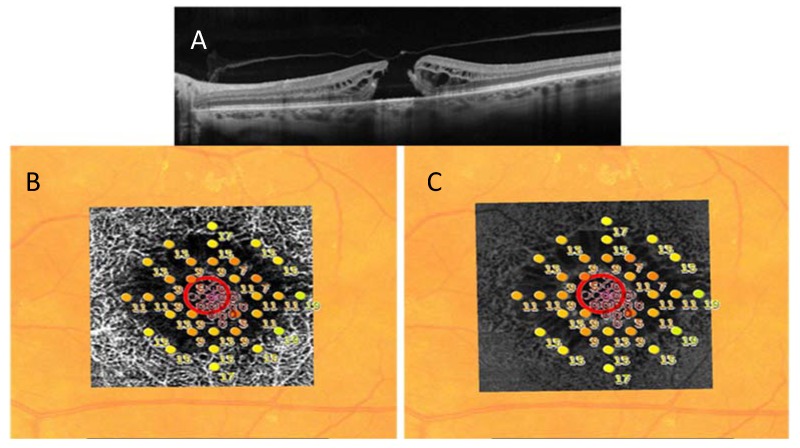
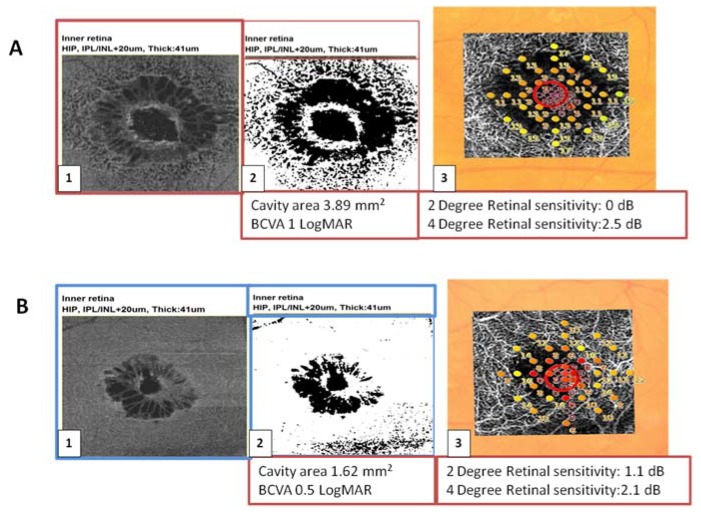
- DOI: 10.3390/jcm9010229
Morpho-Functional Evaluation of Full-Thickness Macular Holes by the Integration of Optical Coherence Tomography Angiography and Microperimetry
Abstract
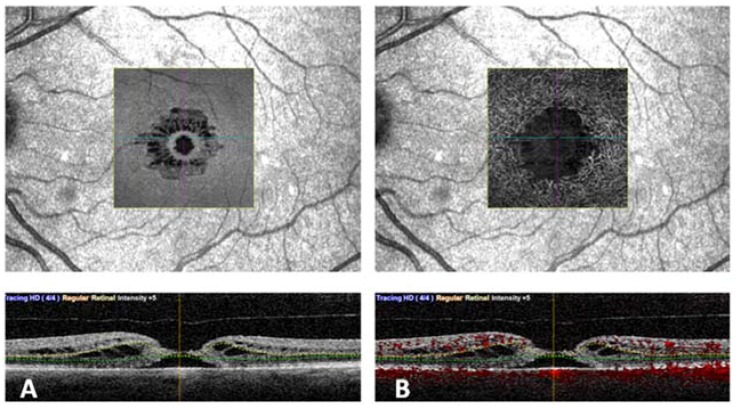
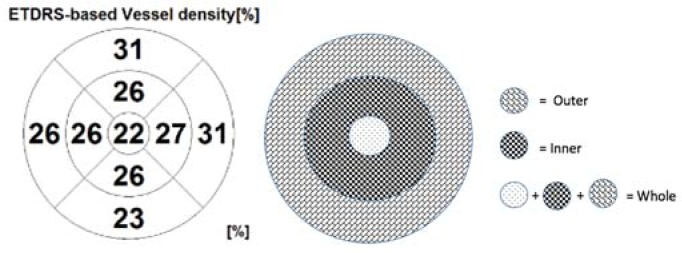
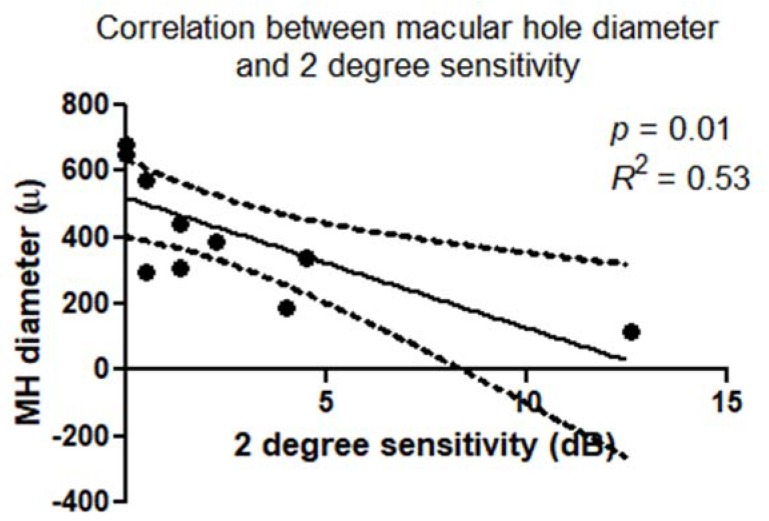
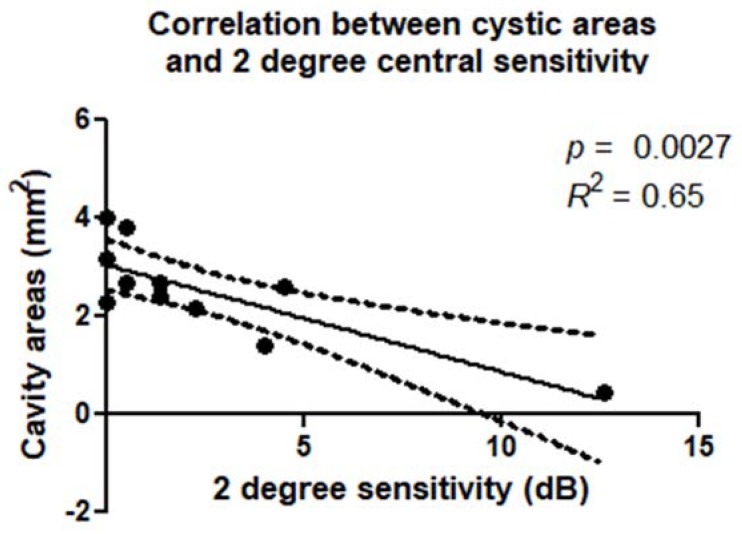
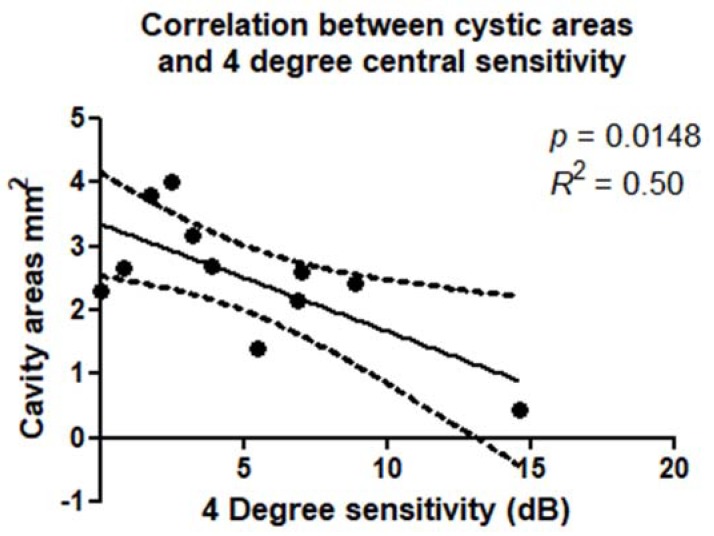
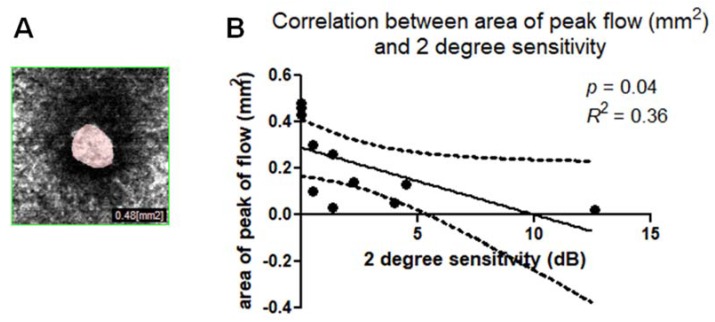
(1) Objective: To use optical coherence tomography angiography (OCTA) and microperimetry (MP) to evaluate the correlation between retinal structure and function in patients with idiopathic, full-thickness macular holes (FTMHs) (2) Methods: This prospective, observational study included 11 eyes of 10 patients with FTMHs evaluated before surgery using OCTA and MP. MP sensitivity maps were superimposed and registered on slabs corresponding to superficial capillary plexus (SCP) and deep capillary plexus (DCP) on OCTA, and on the outer plexiform layer (OPL) and the Henle fiber layer (HFL) complex in en face OCT. On these maps, mean retinal sensitivity was calculated at 2° and 4°, all centered on the FTMH. Cystic cavity extension was assessed on the slab corresponding to the OPL + HFL complex in en face OCT and DCP in OCTA using the Image J software (Version 1.49v; National Institutes of Health, Bethesda, MD, USA); (3) Results: Absolute scotomas were observed corresponding to the FTMH. Additionally, rings of relative scotoma in the perilesional area were detected and correlated to the cystic spaces on en face OCT and OCTA. There was a significant correlation between reduced retinal sensitivity at 2° and 4° diameters around the FTMH and the extension of cystic areas (p < 0.01). There was a significant correlation between the extension of cystic cavities and BCVA (p < 0.01). (4) Conclusions: Morpho-functional analysis of FTMH using OCTA and MP, and the correlation between vascular abnormalities and impaired retinal sensitivity, may provide new, useful information. This integrated evaluation of FTMH may be useful to determine the function-structure correlation before and after vitreoretinal surgery, in order to gain a better understanding of the functional consequences induced by the morphological alterations, assessing outcomes in a more objective way, and potentially adding new surgical prognostic factors.
Keywords: OCT Angiography; full-thickness macular hole; microperimetry.
Conflict of interest statement
References
Figures
Similar articles
-
[Multimodal topographically oriented approach to the study of full-thickness macular holes].Vestn Oftalmol. 2024;140(2):14-23. doi: 10.17116/oftalma202414002114. Vestn Oftalmol. 2024. PMID: 38742494 Russian.
-
Vascular Features of Full-Thickness Macular Hole by OCT Angiography.Ophthalmic Surg Lasers Imaging Retina. 2017 Jan 1;48(1):62-68. doi: 10.3928/23258160-20161219-09. Ophthalmic Surg Lasers Imaging Retina. 2017. PMID: 28060396
-
Grading of macular perfusion in retinal vein occlusion using en-face swept-source optical coherence tomography angiography: a retrospective observational case series.BMC Ophthalmol. 2019 Jun 10;19(1):127. doi: 10.1186/s12886-019-1134-x. BMC Ophthalmol. 2019. PMID: 31182069 Free PMC article.
-
Non-Invasive Retinal Imaging Modalities for the Identification of Prognostic Factors in Vitreoretinal Surgery for Full-Thickness Macular Holes.Diagnostics (Basel). 2023 Feb 5;13(4):589. doi: 10.3390/diagnostics13040589. Diagnostics (Basel). 2023. PMID: 36832078 Free PMC article. Review.
-
Intraoperative Optical Coherence Tomography in the Management of Macular Holes: State of the Art and Future Perspectives.Biomedicines. 2022 Nov 9;10(11):2873. doi: 10.3390/biomedicines10112873. Biomedicines. 2022. PMID: 36359392 Free PMC article. Review.
Cited by
-
Association of Microvasculature and Macular Sensitivity in Idiopathic Macular Epiretinal Membrane: Using OCT Angiography and Microperimetry.Front Med (Lausanne). 2021 Nov 16;8:655013. doi: 10.3389/fmed.2021.655013. eCollection 2021. Front Med (Lausanne). 2021. PMID: 34869402 Free PMC article.
-
Idiopathic Macular Hole Area to Foveal Avascular Zone Ratio and Its Effects on Visual Acuity Before and After Surgery.Transl Vis Sci Technol. 2025 Feb 3;14(2):22. doi: 10.1167/tvst.14.2.22. Transl Vis Sci Technol. 2025. PMID: 39982396 Free PMC article.
-
Microcystoid Macular Edema in Epiretinal Membrane: Not a Retrograde Maculopathy.Am J Ophthalmol. 2025 Apr;272:48-57. doi: 10.1016/j.ajo.2024.12.027. Epub 2025 Jan 3. Am J Ophthalmol. 2025. PMID: 39756632
-
Secondary Vitrectomy with Internal Limiting Membrane Plug due to Persistent Full-Thickness Macular Hole OCT-Angiography and Microperimetry Features: Case Series.J Ophthalmol. 2020 Sep 21;2020:2650873. doi: 10.1155/2020/2650873. eCollection 2020. J Ophthalmol. 2020. PMID: 33029387 Free PMC article.
-
Artificial Intelligence and OCT Angiography in Full Thickness Macular Hole. New Developments for Personalized Medicine.Diagnostics (Basel). 2021 Dec 9;11(12):2319. doi: 10.3390/diagnostics11122319. Diagnostics (Basel). 2021. PMID: 34943557 Free PMC article.
References
-
- Duker J.S., Kaiser P.K., Binder S., De Smet M.D., Gaudric A., Reichel E., Sadda S.R., Sebag J., Spaide R.F., Stalmans P. The International Vitreomacular Traction Study Group Classification of Vitreomacular Adhesion, Traction, and Macular Hole. Ophthalmology. 2013;120:2611–2619. doi: 10.1016/j.ophtha.2013.07.042. - DOI - PubMed
LinkOut - more resources
Full Text Sources
Medical
Research Materials
Miscellaneous
