Review
. 2020 Jan 17;18(1):30.
doi: 10.1186/s12967-020-02213-2.

Effects of probiotics on type II diabetes mellitus: a meta-analysis

Affiliations
Review

Effects of probiotics on type II diabetes mellitus: a meta-analysis

Yun-Wen Tao et al. J Transl Med. .

Erratum in

Abstract

Objective: The purpose of the present study was to evaluate the effectiveness of probiotics on type II diabetes mellitus (T2DM).

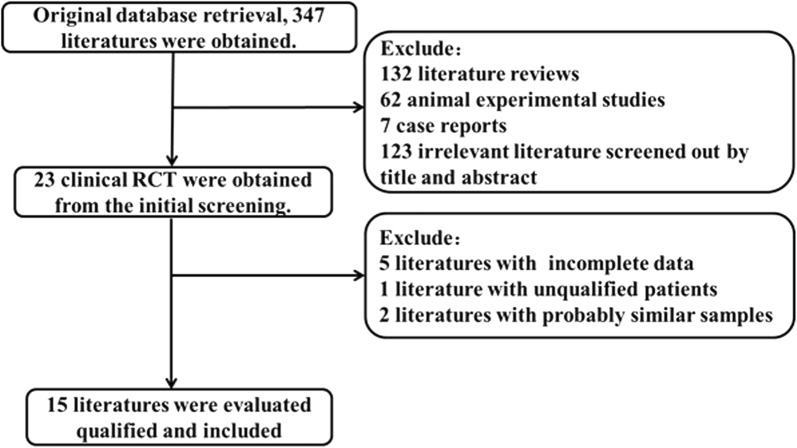
Methods: We performed a comprehensive search on PubMed, Web of Science, China National Knowledge Infrastructure, Chinese Scientific Journal Databases, Wan Fang database and China biology medicine disc for relevant studies published before June 2019. Glycated hemoglobin A1c (HbA1c), homeostasis model assessment of insulin resistance (HOMA-IR) and fasting blood glucose (FBG) were used as indicators for T2DM. Inverse-variance weighted mean difference (WMD) with 95% confidence interval (CI) was calculated for the mean HbA1c, FBG and HOMA-IR changes from baseline.

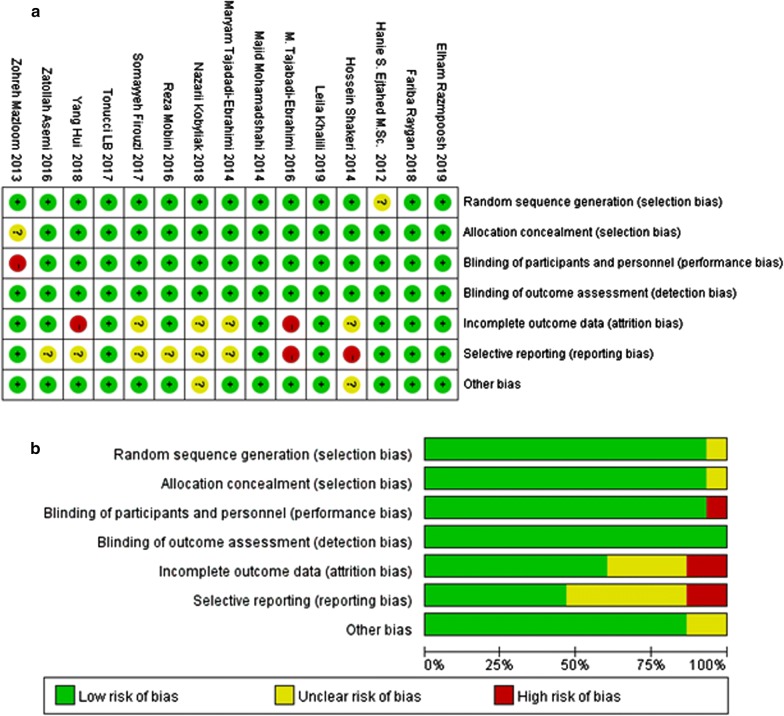
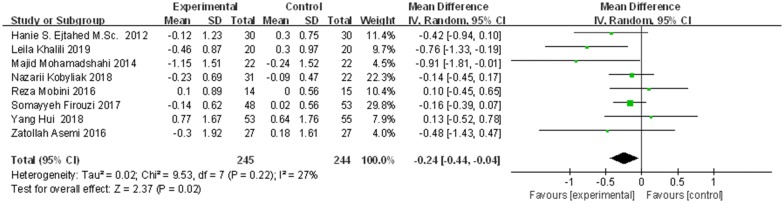
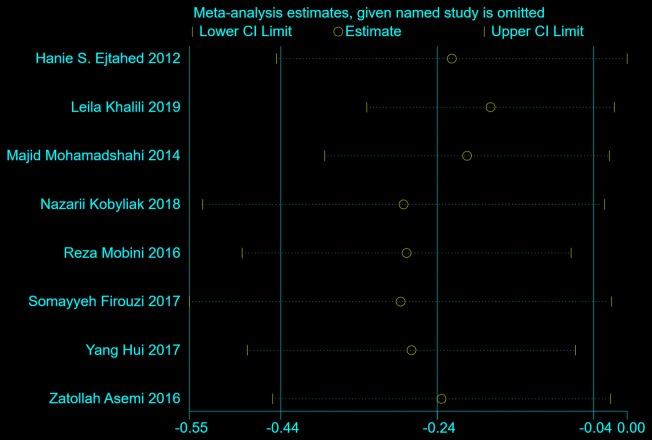
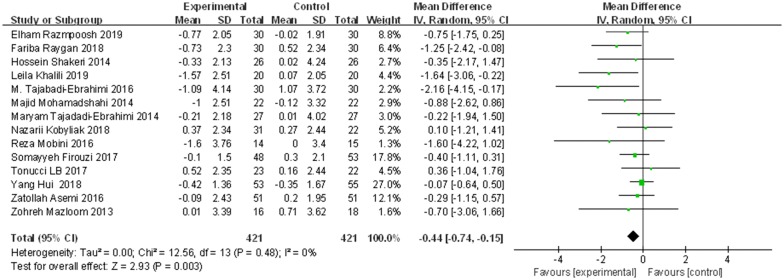
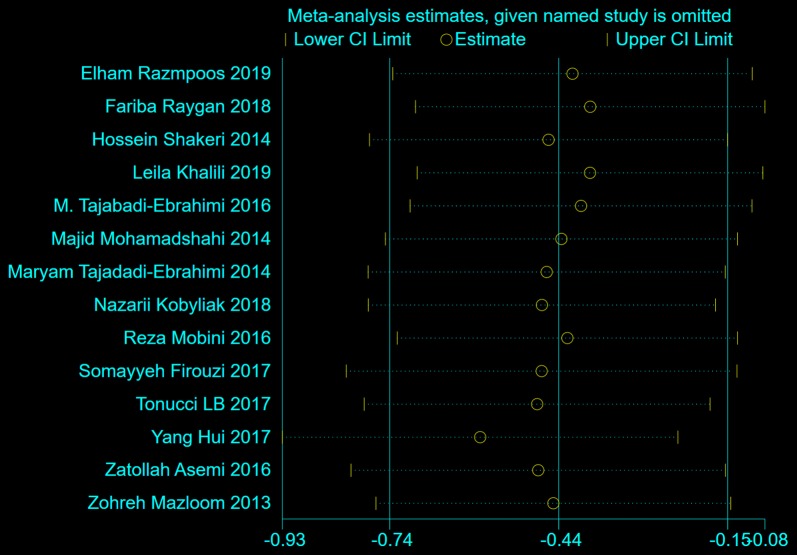
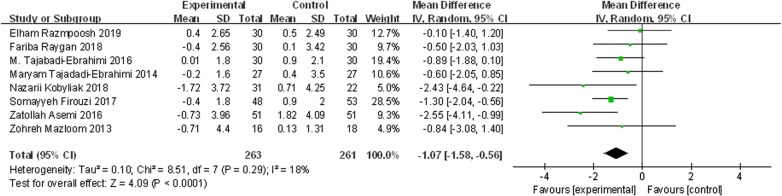
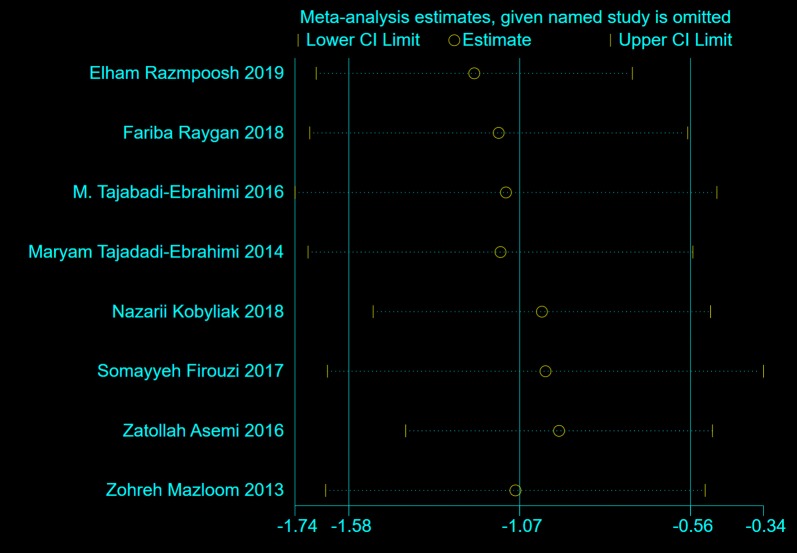
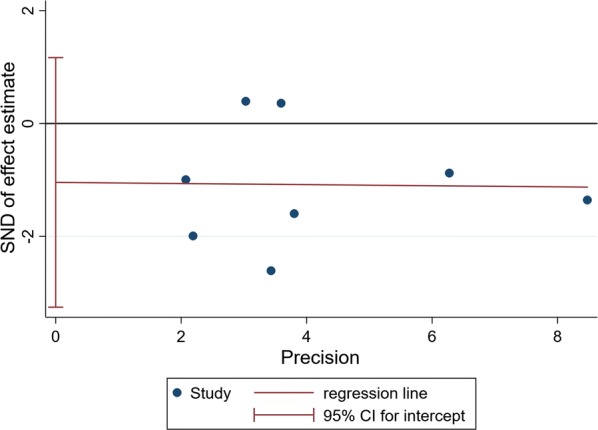
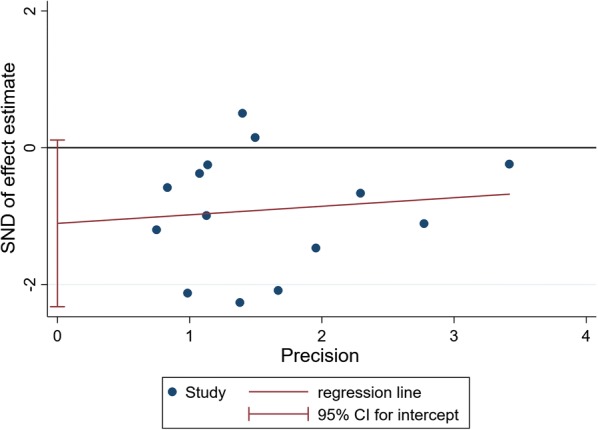
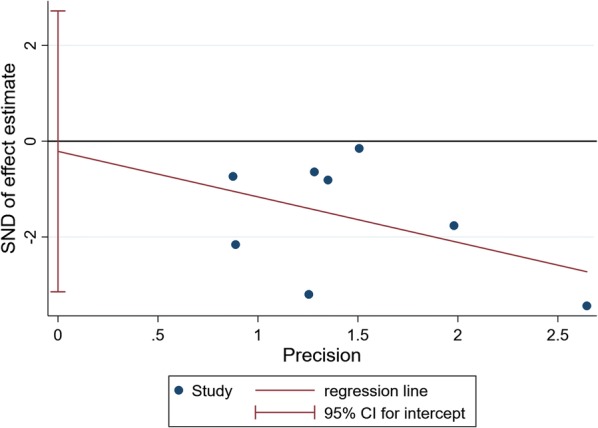
Results: 15 randomized controlled trials (RCT) with a total of 902 participants were included into the meta-analysis. Considering the clinical heterogeneity caused by variation of dosage and duration of probiotic treatment, random-effects model was used to estimate the pooled WMD. Significantly greater reduction in HbA1c% (WMD = - 0.24, 95% CI [- 0.44, - 0.04], p = 0.02), FBG (WMD = - 0.44 mmol/L, 95% CI [- 0.74, - 0.15], p = 0.003) and HOMA-IR (WMD = - 1.07, 95% CI [- 1.58, - 0.56], p < 0.00001) were observed in probiotics treated group. Further sensitivity analysis verified the reliability and stability of our results.

Conclusion: The results of our meta-analysis indicated that probiotics treatment may reduce HbA1c, FBG and insulin resistance level in T2DM patients. More clinical data and research into the mechanism of probiotics are needed to clarify the role of probiotics in T2DM.

Keywords: Gut microbiota; Meta-analysis; Probiotic; Type II diabetes mellitus.


Conflict of interest statement

The authors declare that they have no competing interests.

Figures

Fig. 1
Fig. 1
Flow chart of literature inclusion
Fig. 2
Fig. 2
Risk of bias assessment for included studies. a Risk of Bias Graph. Literature quality was evaluated according to the following six points: ①generation of random distribution schemes; ②covert grouping; ③implementation of the blind method; ④Integrity of the data; ⑤non-selective reporting of results; ⑥other sources of bias. There are three bias assessment criteria “Low”, “High” and “Unclear” for each point, shown as the color green, yellow and red, respectively. b Risk of bias summary. The quality assessment of each literature has been shown. The color green, yellow and red represent low, high and unclear risk of bias, respectively
Fig. 3
Fig. 3
The effect of probiotics on HbA1c (%) in T2DM patients. Mean differences of change from baseline and 95% confidence intervals (CIs) are shown. Pooled estimates were calculated by the inverse-variance weighted random-effects meta-analysis. The squares indicate the effect of probiotics in a particular trial and the horizontal lines represent the corresponding 95% CIs. The diamond indicated the pooled effect size
Fig. 4
Fig. 4
Sensitivity analysis of the effects of probiotics on HbA1c (%) in T2DM patients. Results were computed by omitting each trial in turn. Random-effects meta-analysis were used to estimate the pooled effect size. The two ends of the dotted lines represent the 95% CIs
Fig. 5
Fig. 5
The effect of probiotics on FBG (mmol/L) in T2DM patitents. Mean differences of change from baseline and 95% confidence intervals (CIs) are shown. Pooled estimates were calculated by the inverse-variance weighted random-effects meta-analysis. The squares indicate the effect of probiotics in a particular trial and the horizontal lines represent the corresponding 95% CIs. The diamond indicated the pooled effect size
Fig. 6
Fig. 6
Sensitivity analysis of the effects of probiotics on FBG (mmol/L) in T2DM patients. Results were computed by omitting each trial in turn. Random-effects meta-analysis were used to estimate the pooled effect size. The two ends of the dotted lines represent the 95% CIs
Fig. 7
Fig. 7
The effect of probiotics on HOMA-IR in T2DM patients. Mean differences of change from baseline and 95% confidence intervals (CIs) are shown. Pooled estimates were calculated by the inverse-variance weighted random-effects meta-analysis. The squares indicate the effect of probiotics in a particular trial and the horizontal lines represent the corresponding 95% CIs. The diamond indicated the pooled effect size
Fig. 8
Fig. 8
Sensitivity analysis of the effects of probiotics on HOMA-IR in T2DM patients. Results were computed by omitting each trial in turn. Random-effects meta-analysis were used to estimate the pooled effect size. The two ends of the dotted lines represent the 95% CIs
Fig. 9
Fig. 9
Egger’s regression asymmetry test for effects of probiotics on HbA1c% in T2DM patients. Individual studies are represented by blue dot. Success of the CI for the intercept to include zero indicates symmetry in the funnel plot and give evidence of no publication bias
Fig. 10
Fig. 10
Egger’s regression asymmetry test for effects of probiotics on FBG in T2DM patients. Individual studies are represented by blue dot. Success of the CI for the intercept to include zero indicates symmetry in the funnel plot and give evidence of no publication bias
Fig. 11
Fig. 11
Egger’s regression asymmetry test for effects of probiotics on HOMA-IR in T2DM patients. Individual studies are represented by blue dot. Success of the CI for the intercept to include zero indicates symmetry in the funnel plot and give evidence of no publication bias

References

    1. DeFronzo AR. Pathogenesis of type 2 diabetes mellitus. Med Clin N Am. 2004;88:787–835. doi: 10.1016/j.mcna.2004.04.013. - DOI - PubMed
    1. Horowitz M, Harding PE, Maddox AF, Wishart JM, Akkermans LMA, Chatterton BE, Shearman DJC. Gastric and oesophageal emptying in patients with type 2 (non-insulin-dependent) diabetes mellitus. Diabetologia. 1989;32:151–159. doi: 10.1007/BF00265086. - DOI - PubMed
    1. Chang J, Rayner CK, Jones KL, Horowitz M. Diabetic gastroparesis—backwards and forwards. J Gastroenterol Hepatol. 2011;26:46–57. doi: 10.1111/j.1440-1746.2010.06573.x. - DOI - PubMed
    1. Azpiroz F, Malagelada C. Diabetic neuropathy in the gut: pathogenesis and diagnosis. Diabetologia. 2016;59:404–408. doi: 10.1007/s00125-015-3831-1. - DOI - PubMed
    1. Wu SL. Staging of type 2 diabetes mellitus. Genet Mol Res. 2015;14:2118. doi: 10.4238/2015.March.20.22. - DOI - PubMed