. 2020 Jan 17;18(1):29.
doi: 10.1186/s12967-020-02207-0.

Immune cell phenotyping in low blood volumes for assessment of cardiovascular disease risk, development, and progression: a pilot study

Affiliations

Immune cell phenotyping in low blood volumes for assessment of cardiovascular disease risk, development, and progression: a pilot study

Yvonne Baumer et al. J Transl Med. .

Abstract

Background: Cardiovascular disease (CVD) is the leading cause of death in the world. Given the role of immune cells in atherosclerosis development and progression, effective methods for characterizing immune cell populations are needed, particularly among populations disproportionately at risk for CVD.

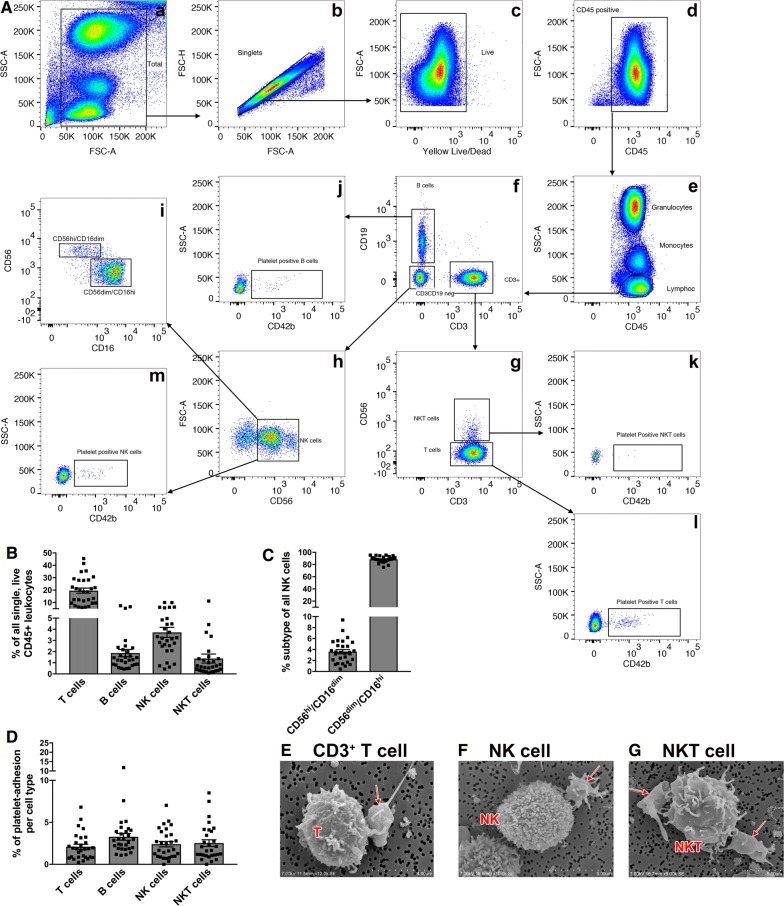
Results: By using a variety of antibodies combined in one staining protocol, we were able to identify granulocyte, lymphocyte, and monocyte sub-populations by CD-antigen expression from 500 µl of whole blood, enabling a more extensive comparison than what is possible with a complete blood count and differential (CBC). The flow cytometry panel was established and tested in a total of 29 healthy men and women. As a proof of principle, these 29 samples were split by their race/ethnicity: African-Americans (AA) (N = 14) and Caucasians (N = 15). We found in accordance with the literature that AA had fewer granulocytes and more lymphocytes when compared to Caucasians, though the proportion of total monocytes was similar in both groups. Several new differences between AA and Caucasians were noted that had not been previously described. For example, AA had a greater proportion of platelet adhesion on non-classical monocytes when compared to Caucasians, a cell-to-cell interaction described as crucially important in CVD. We also examined our flow panel in a clinical population of AA women with known CVD risk factors (N = 20). Several of the flow cytometry parameters that cannot be measured with the CBC displayed correlations with clinical CVD risk markers. For instance, Framingham Risk Score (FRS) calculated for each participant correlated with immune cell platelet aggregates (PA) (e.g. T cell PA β = 0.59, p = 0.03 or non-classical monocyte PA β = 0.54, p = 0.02) after adjustment for body mass index (BMI).

Conclusion: A flow cytometry panel identified differences in granulocytes, monocytes, and lymphocytes between AA and Caucasians which may contribute to increased CVD risk in AA. Moreover, this flow panel identifies immune cell sub-populations and platelet aggregates associated with CVD risk. This flow cytometry panel may serve as an effective method for phenotyping immune cell populations involved in the development and progression of CVD.

Keywords: Blood cell composition; Cardiovascular disease; Flow cytometry; Health disparities; Platelet adhesion.


Conflict of interest statement

The authors declare that they have no competing interests.

Figures

Fig. 1
Fig. 1
Granulocyte phenotyping. A Representative example of flow cytometry gating scheme to identify granulocytes. Each cell subsets CD42b (platelet)-positive population can also be identified. B Identified cell populations are presented in percent (%) of all CD45-positive cells displayed in A, d. C Platelets adherent to each cell population are presented in percent (%) of originating gate A, f, g. Representative quantitative results of 29 healthy adult blood donors. Data are represented as mean ± the standard error of the mean
Fig. 2
Fig. 2
Monocyte phenotyping. A Representative example of flow cytometry gating scheme to identify monocytes and their subsets (A, f, g). Each cell subsets CD42b (platelet)-positive population can also be identified (A, hk). (B) Identified cell populations are presented in percent (%) of all CD45-positive cells displayed in (A, d). C Platelets adherent to each cell population are presented in percent (%) of originating gate (A, f, g). D, E Scanning electron micrographs displaying the monocytes with adherent platelets. Adherent platelets are indicated by the red arrows and stay adherent on monocytes during the process of macrophage differentiation (E). Representative quantitative results of 29 healthy adult blood donors. Data are represented as mean ± the standard error of the mean. (NM-nonclassical monocytes, IM-intermediate monocytes, CM-classical monocytes HMDM-human monocyte-derived macrophages)
Fig. 3
Fig. 3
Lymphocyte phenotyping. A Representative example of flow cytometry gating scheme to identify B cells (A, f), T cells (A, g), NKT cells (A, g), and NK cells (A, h). NK cells can further be sub-gated to allow identification of cytotoxic (CD56dim/CD16high) or proliferative NK cells (CD56high/CD16dim) (A, i). Each cell subsets CD42b (platelet)-positive population can also be identified (A, jm). B Identified cell populations are presented in percent (%) of all CD45-positive cells displayed in (A, d). C Sub-gating of NK cells (A, h) by CD56 and CD16 allows for quantification of proliferative versus cytotoxic NK cell populations displayed as percent of CD3-/CD56+ NK cells (A, h). D Platelets adherent to each cell population are presented in percent (%) of originating gate. Representative quantitative results of 29 healthy adult blood donors. EG Scanning electron micrographs displaying the indicated population and the adherent platelet. Adherent platelets are indicated by the red arrow. Data are represented as mean ± the standard error of the mean

References

    1. Benjamin EJ, Blaha MJ, Chiuve SE, Cushman M, Das SR, Deo R, de Ferranti SD, Floyd J, Fornage M, Gillespie C, et al. Heart disease and stroke statistics-2017 update: a report from the American Heart Association. Circulation. 2017;135:e146–e603. doi: 10.1161/CIR.0000000000000485. - DOI - PMC - PubMed
    1. Carnethon MR, Pu J, Howard G, Albert MA, Anderson CAM, Bertoni AG, Mujahid MS, Palaniappan L, Taylor HA, Jr, Willis M, et al. Cardiovascular Health in African Americans: a Scientific Statement From the American Heart Association. Circulation. 2017;136:e393–e423. doi: 10.1161/CIR.0000000000000534. - DOI - PubMed
    1. Saab KR, Kendrick J, Yracheta JM, Lanaspa MA, Pollard M, Johnson RJ. New insights on the risk for cardiovascular disease in African Americans: the role of added sugars. J Am Soc Nephrol. 2015;26:247–257. doi: 10.1681/ASN.2014040393. - DOI - PMC - PubMed
    1. Thomas AJ, Eberly LE, Davey Smith G, Neaton JD, Stamler J. Race/ethnicity, income, major risk factors, and cardiovascular disease mortality. Am J Public Health. 2005;95:1417–1423. doi: 10.2105/AJPH.2004.048165. - DOI - PMC - PubMed
    1. Lei MK, Beach SRH, Simons RL. Biological embedding of neighborhood disadvantage and collective efficacy: influences on chronic illness via accelerated cardiometabolic age. Dev Psychopathol. 2018;30:1797–1815. doi: 10.1017/S0954579418000937. - DOI - PMC - PubMed

Publication types