. 2020 Mar;8(3):309-320.
doi: 10.1158/2326-6066.CIR-19-0293. Epub 2020 Jan 17.

Glypican-3-Specific CAR T Cells Coexpressing IL15 and IL21 Have Superior Expansion and Antitumor Activity against Hepatocellular Carcinoma

Affiliations

Glypican-3-Specific CAR T Cells Coexpressing IL15 and IL21 Have Superior Expansion and Antitumor Activity against Hepatocellular Carcinoma

Sai Arun Batra et al. Cancer Immunol Res. 2020 Mar.

Abstract

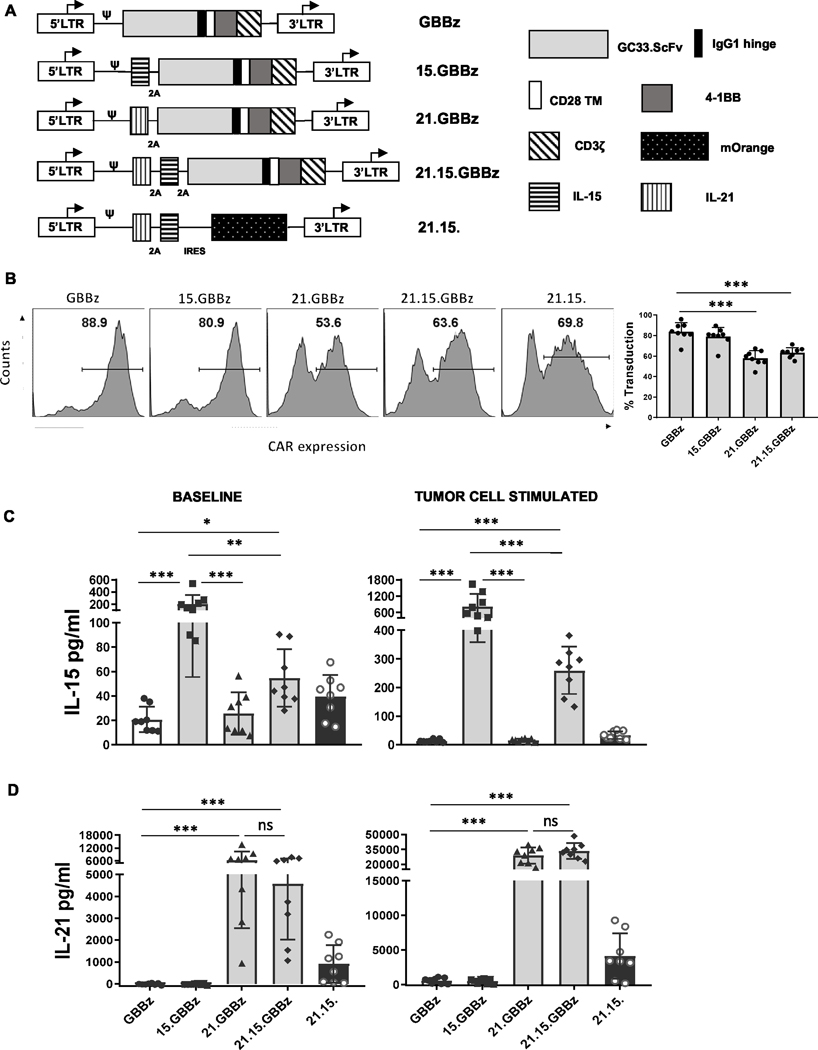
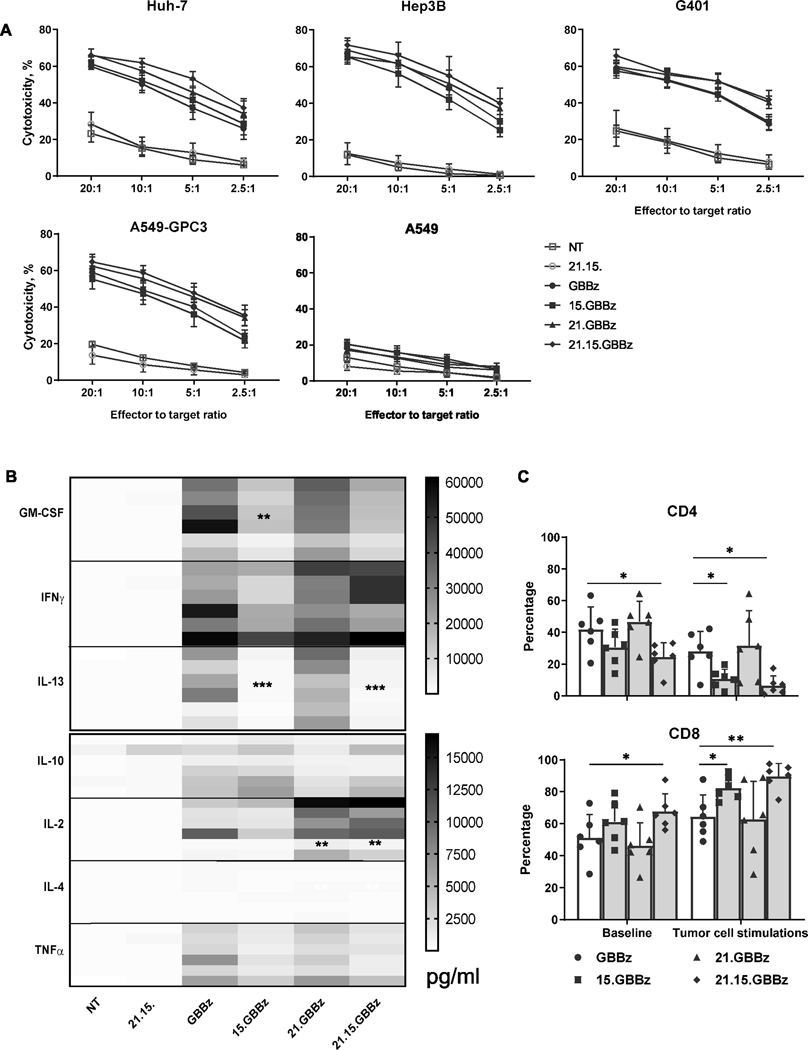
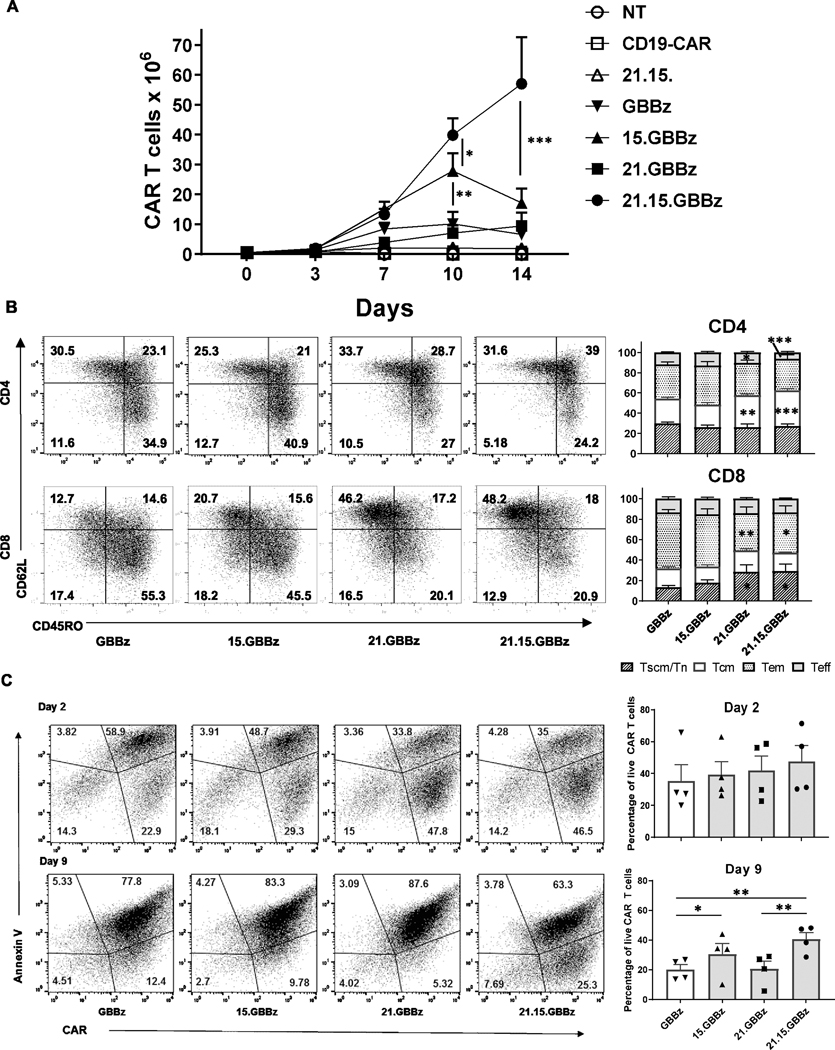
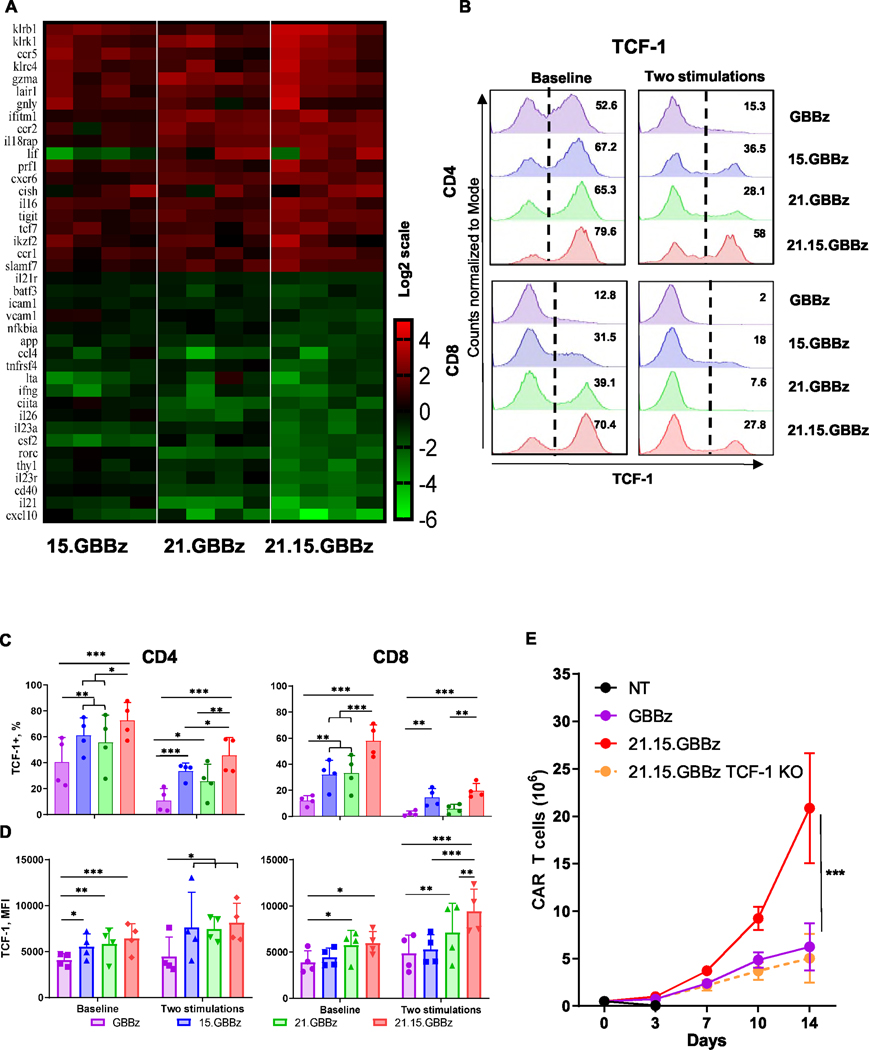
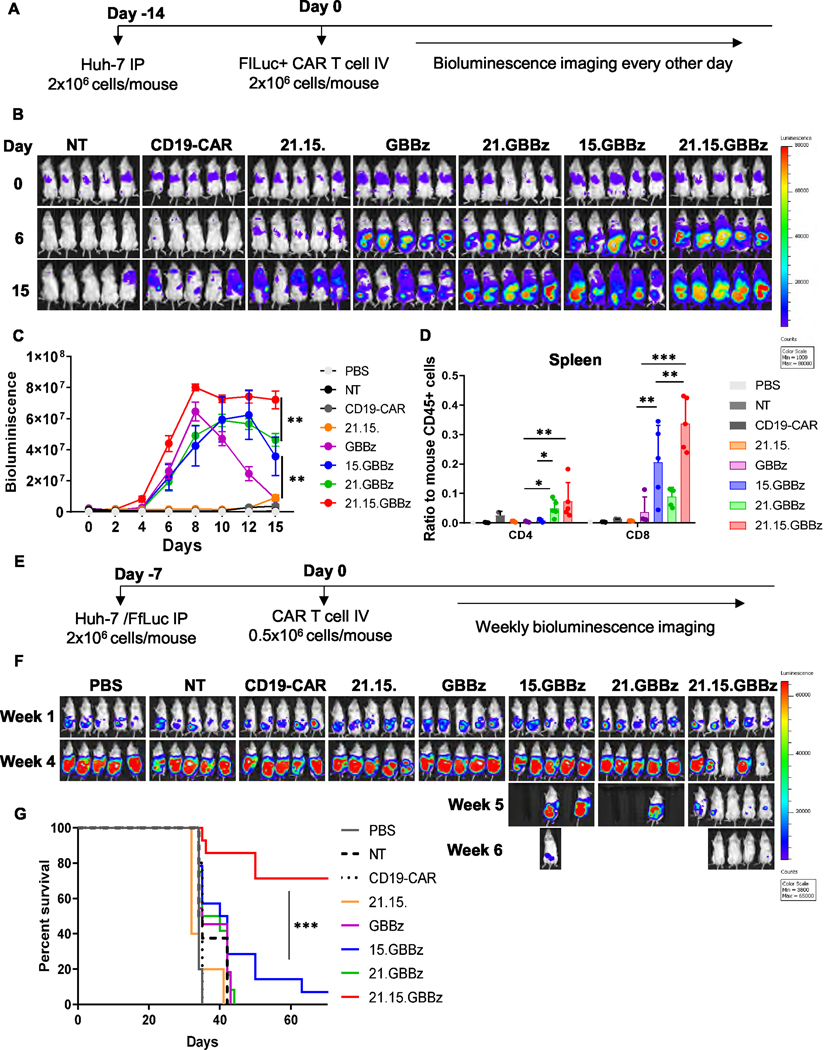
Hepatocellular carcinoma (HCC) is the fourth most common cause of cancer-related death in the world, and curative systemic therapies are lacking. Chimeric antigen receptor (CAR)-expressing T cells induce robust antitumor responses in patients with hematologic malignancies but have limited efficacy in patients with solid tumors, including HCC. IL15 and IL21 promote T-cell expansion, survival, and function and can improve the antitumor properties of T cells. We explored whether transgenic expression of IL15 and/or IL21 enhanced glypican-3-CAR (GPC3-CAR) T cells' antitumor properties against HCC. We previously optimized the costimulation in GPC3-CARs and selected a second-generation GPC3-CAR incorporating a 4-1BB costimulatory endodomain (GBBz) for development. Here, we generated constructs encoding IL15, IL21, or both with GBBz (15.GBBz, 21.GBBz, and 21.15.GBBz, respectively) and examined the ability of transduced T cells to kill, produce effector cytokines, and expand in an antigen-dependent manner. We performed gene-expression and phenotypic analyses of GPC3-CAR T cells and CRISPR-Cas9 knockout of the TCF7 gene. Finally, we measured GPC3-CAR T-cell antitumor activity in murine xenograft models of GPC3+ tumors. The increased proliferation of 21.15.GBBz T cells was at least in part dependent on the upregulation and maintenance of TCF-1 (encoded by TCF7) and associated with a higher percentage of stem cell memory and central memory populations after manufacturing. T cells expressing 21.15.GBBz had superior in vitro and in vivo expansion and persistence, and the most robust antitumor activity in vivo These results provided preclinical evidence to support the clinical evaluation of 21.15.GPC3-CAR T cells in patients with HCC.


Conflict of interest statement

Conflict of interest disclosure statement:

SAB, PR, LSM and AH have pending patent applications covering GPC3-CARs. Other co-authors report no conflict of interest.

Figures

Figure 1.
Figure 1.. Generation of GPC3-CAR T cells that co-express IL21 and IL-15.
A) Schematic of retroviral constructs encoding GPC3-CAR (GBBz) with and without IL15 and/or IL-21. B) CAR expression in T cells transduced (on Day 3 post stimulation with plate bound antibody) using retroviral vectors containing the indicated GPC3-CAR constructs as measured by flow cytometry (on Days 10–14). Data from one representative donor and summary for eight independent donors in independent expansions is shown (mean ± SD). IL15 (C) and IL21 (D) produced by the indicated T cell groups at baseline (left) or after stimulation with GPC3-positive Huh-7 cells (right, E:T = 1:1, +72 hrs) as measured by ELISA (mean ± SD, n=8). One-way ANOVA. * p<0.05, ** p<0.01, ***p<0.001.
Figure 2.
Figure 2.. Co-expression of IL15 and/or IL21 maintained GPC3-specific tumor cell killing but altered effector cytokine release in GPC3-CAR T cells.
A) GPC3-CAR T cells were co-cultured with 51Cr-labeled GPC3-positive (Huh-7, Hep3B, G401, A549-GPC3) and negative (A549) target cells at the indicated effector-to-target (E:T) ratios. 51Cr-release was detected after four hours as a measure of GPC3-CAR T cytotoxicity (mean ± SEM, pooled results from two independent experiments evaluating four donors). B) Indicated T cell groups were cultured with Huh-7 tumor cells at a 1:1 ratio and concentration of indicated effector cytokines released into the supernatant (+24 hrs) was measured by Luminex assay (combined data from three independent experiments evaluating six donors). Comparison with two-way ANOVA. C) Surface expression of CD4 (top) and CD8 (bottom) populations within CAR-positive cells at baseline (left) and after two consecutive stimulations with Huh-7 cells (right, E:T = 1:1) as measured by FACS (mean ± SD, combined data from three independent experiments evaluating six donors), one-way ANOVA. *p<0.05, ** p<0.01, ***p<0.001.
Figure 3.
Figure 3.. Co-expressing IL21 and IL15 enhanced expansion, enriched for less differentiated subsets, and reduced the apoptosis rate of GPC3-CAR T cells.
A) GPC3-CAR T cells were co-cultured with HCC cells at a 1:1 ratio and re-plated every 3–4 days as indicated with fresh HCC cells in the absence of exogenous cytokines (mean ± SEM, combined data from three independent experiments evaluating three donors). One-way ANOVA followed. B) Phenotype of GPC3-CAR T cells as measured by surface expression of CD45RO and CD62L after manufacture. Shown are representative flow plots and summary data for indicated CAR T cell groups (mean ± SEM, combined data from four independent experiments evaluating four donors, asterisks indicate significant differences from GBBz). Tscm/Tn: CD45RO/CD62L+, Tcm: CD45RO+/CD62L+, Tem: CD45RO+/CD62L, Teff: CD45RO/CD62L. C) GPC3-CAR T cells were stimulated once (day 2) or three times (day 9) with HCC cells at a 1:1 ratio and rate of apoptosis was evaluated by staining for annexin V. Representative flow plots and summary bargraph for indicated CAR T cell groups (mean ± SEM, combined data from four independent experiments evaluating four donors). Data in Figures 3B and 3C were analyzed using two-way ANOVA. *p<0.05, **p<0.01, ***p<0.001.
Figure 4.
Figure 4.. Co-expression of IL21 and IL15 altered global gene expression patterns in GPC3-CAR T cells and TCF-1 was maintained in CAR T cells co-expressing both IL15 and IL21.
A) Heat maps showing fold expression changes for top 20 genes with highest or lowest change in expression and reaching significance versus GBBz T cells (arranged with respect to 21.15.GBBz vs GBBz), as measured three days after stimulation with HCC cells (Four independent cocultures evaluating four independent donors, Nanostrings performed as a single batch). B-D) TCF-1 protein expression within CD4+ and CD8+ GPC3-CAR T cells as measured by intracellular flow cytometry. A representative histogram (B) and combined results showing percentage (C) and mean fluorescence intensity (MFI, D) of TCF-1+ cells (mean + SD, combined data from four independent experiments evaluating four independent donors). Two-way ANOVA, * p<0.05, ** p<0.01, ***p<0.001. E) Expansion of indicated GPC3-CAR T cell populations with or without TCF-1 KO after stimulation with GPC3+ tumor cells. (Mean, ± SD, combined results from three independent experiments evaluating five independent donors, Student’s T-test: p< 0.001).
Figure 5.
Figure 5.. Co-expression of IL15 and IL21 enhanced in vivo expansion, persistence, and antitumor activity of GPC3-CAR T cells.
A) Schematic of in vivo evaluation scheme for GPC3-CAR T cell persistence. NSG mice were injected with 2 × 10⁶ Huh-7 cells followed by 2 × 10⁶ Ffluc+ CAR T cells two weeks later. B) Monitoring of bioluminescent GPC3-CAR T cells at indicated time points post-injection. C) GPC3-CAR T cell bioluminescence counts (mean ± SEM) over experimental time course. D) Ratio of CD4+ and CD8+ GPC3-CAR T cells relative to mouse CD45-expressing cells in splenic tissue on day 18 as measured by flow cytometry. (mean + SD, one representative of two independent experiments, n=8–10 / GPC3 CAR T group). E) Schematic of in vivo evaluation scheme for GPC3-CAR T cell antitumor activity. NSG mice were injected with 2 × 10⁶ Huh-7/FfLuc cells followed by 0.5 × 10⁶ CAR T cells on day 7. F) Weekly monitoring of bioluminescent Huh-7 tumor cells. G) Kaplan-Meier survival analysis of tumor-bearing mice pictured in (F) Data in Figures 5C and 5D were analyzed using one-way ANOVA. Combined results from two independent experiments 11–14 animals per GPC3-CAR T cell groups. Survival was estimated by the Kaplan-Meier method and compared by the Gehan-Breslow-Wilcoxon test. * p<0.05, ** p<0.01, *** p<0.001.

References

    1. Villanueva A. Hepatocellular Carcinoma. N Engl J Med 2019;380(15):1450–62 doi 10.1056/NEJMra1713263. - DOI - PubMed
    1. Maude SL, Frey N, Shaw PA, Aplenc R, Barrett DM, Bunin NJ, et al. Chimeric antigen receptor T cells for sustained remissions in leukemia. N Engl J Med 2014;371(16):1507–17 doi 10.1056/NEJMoa1407222. - DOI - PMC - PubMed
    1. Davila ML, Riviere I, Wang X, Bartido S, Park J, Curran K, et al. Efficacy and toxicity management of 19–28z CAR T cell therapy in B cell acute lymphoblastic leukemia. Sci Transl Med 2014;6(224):224ra25 doi 10.1126/scitranslmed.3008226. - DOI - PMC - PubMed
    1. Turtle CJ, Hanafi LA, Berger C, Gooley TA, Cherian S, Hudecek M, et al. CD19 CAR-T cells of defined CD4+:CD8+ composition in adult B cell ALL patients. J Clin Invest 2016;126(6):2123–38 doi 10.1172/JCI85309. - DOI - PMC - PubMed
    1. Turtle CJ, Hanafi LA, Berger C, Hudecek M, Pender B, Robinson E, et al. Immunotherapy of non-Hodgkin’s lymphoma with a defined ratio of CD8+ and CD4+ CD19-specific chimeric antigen receptor-modified T cells. Sci Transl Med 2016;8(355):355ra116 doi 10.1126/scitranslmed.aaf8621. - DOI - PMC - PubMed

Publication types

MeSH terms