. 2020 Jan 17;11(1):338.
doi: 10.1038/s41467-019-14219-6.

MUC1-C regulates lineage plasticity driving progression to neuroendocrine prostate cancer

Affiliations

MUC1-C regulates lineage plasticity driving progression to neuroendocrine prostate cancer

Yota Yasumizu et al. Nat Commun. .

Erratum in

Abstract

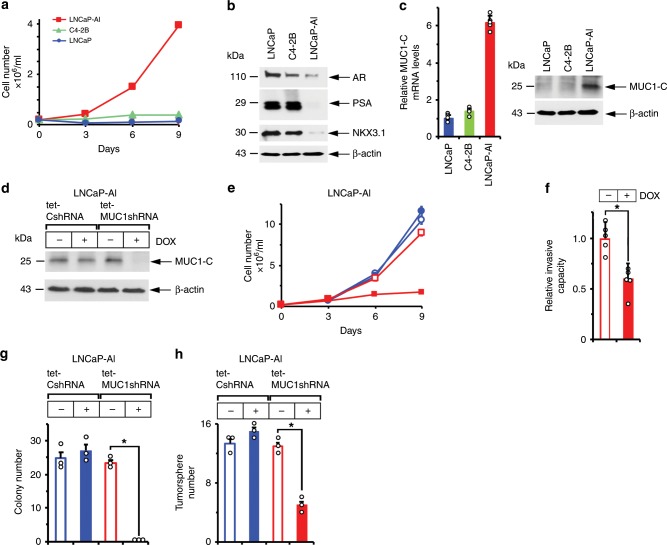
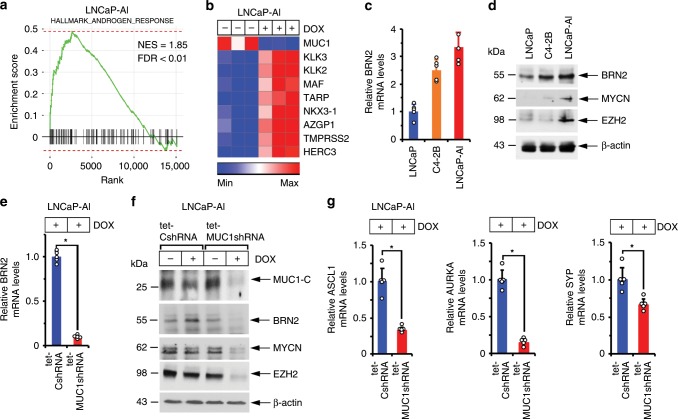
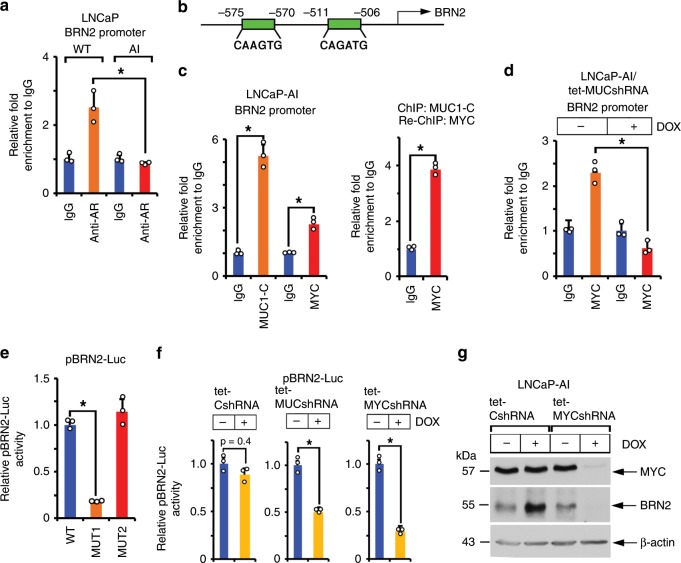
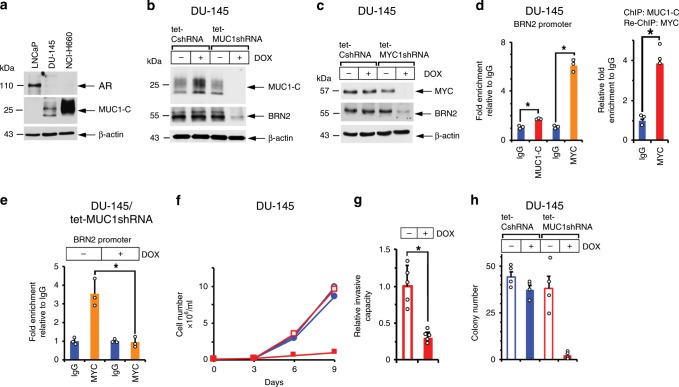
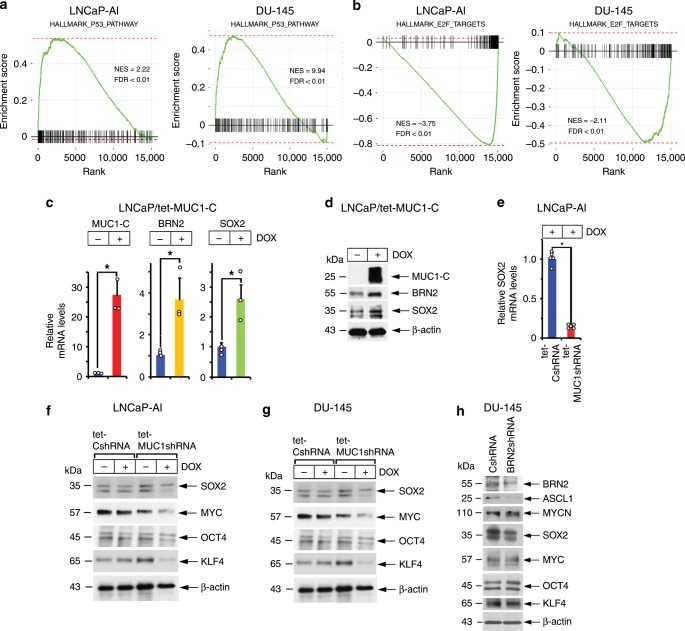
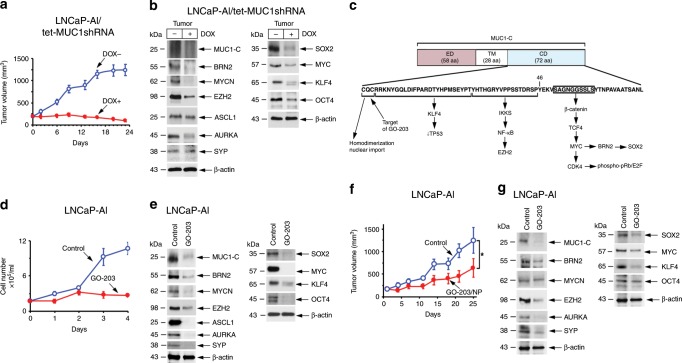
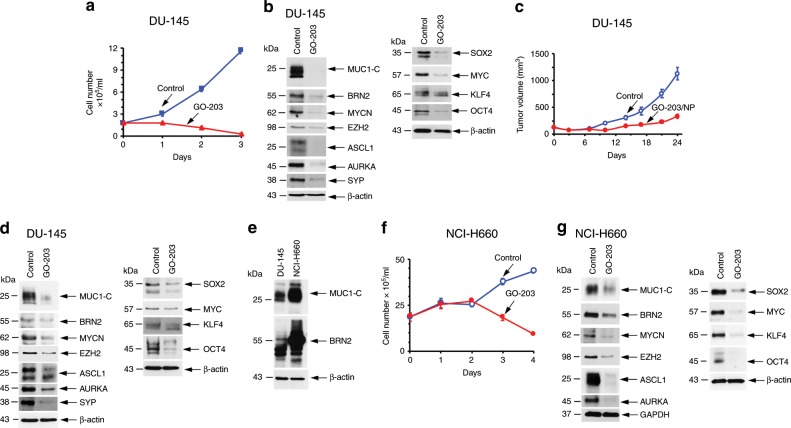
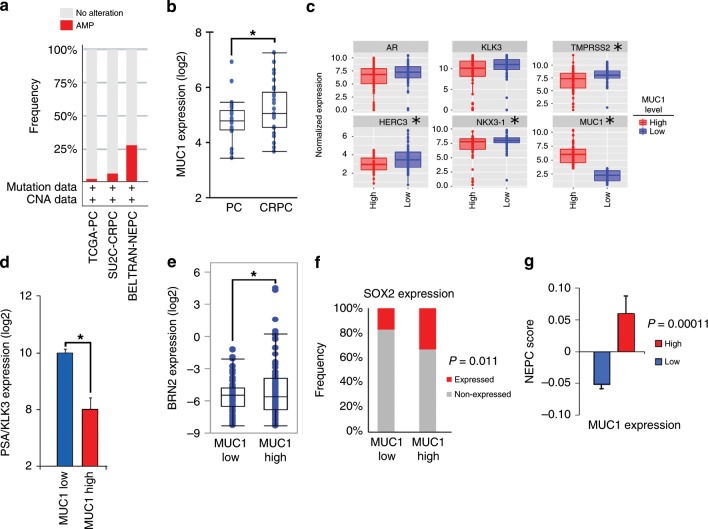
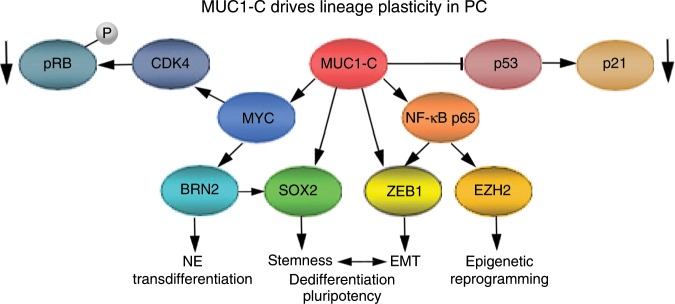
Neuroendocrine prostate cancer (NEPC) is an aggressive malignancy with no effective targeted therapies. The oncogenic MUC1-C protein is overexpressed in castration-resistant prostate cancer (CRPC) and NEPC, but its specific role is unknown. Here, we demonstrate that upregulation of MUC1-C in androgen-dependent PC cells suppresses androgen receptor (AR) axis signaling and induces the neural BRN2 transcription factor. MUC1-C activates a MYC→BRN2 pathway in association with induction of MYCN, EZH2 and NE differentiation markers (ASCL1, AURKA and SYP) linked to NEPC progression. Moreover, MUC1-C suppresses the p53 pathway, induces the Yamanaka pluripotency factors (OCT4, SOX2, KLF4 and MYC) and drives stemness. Targeting MUC1-C decreases PC self-renewal capacity and tumorigenicity, suggesting a potential therapeutic approach for CRPC and NEPC. In PC tissues, MUC1 expression associates with suppression of AR signaling and increases in BRN2 expression and NEPC score. These results highlight MUC1-C as a master effector of lineage plasticity driving progression to NEPC.


Conflict of interest statement

D.K. has equity interests in Genus Oncology, Reata Pharmaceuticals, Hillstream BioPharma, Nanogen Therapeutics and Victa BioTherapeutics, serves as a member of the board of directors of Nanogen and Victa, and is a paid consultant to Reata, CanBas and Victa. The other authors declare no competing interests.

Figures

Fig. 1
Fig. 1. MUC1-C drives AI and self-renewal capacity.
a LNCaP (blue circles), C4-2B (green triangles) and LNCaP-AI (red squares) cells were cultured in androgen-depleted medium for 10 days, seeded at 2 × 104 cells/ml and then monitored for cell growth. Cell number (mean of three biologic replicates) was determined by trypan blue staining. b Lysates from LNCaP, C4-2B and LNCaP-AI cells were immunoblotted with antibodies against the indicated proteins. c LNCaP, C4-2B and LNCaP-AI cells were analyzed for MUC1-C mRNA levels by qRT-PCR using primers listed in Supplementary Table 1. The results (mean±SD of four determinations) are expressed as relative mRNA levels compared to those obtained for LNCaP cells (assigned a value of 1)(left). Lysates were immunoblotted with antibodies against the indicated proteins (right). d LNCaP-AI cells stably expressing a tet-CshRNA or tet-MUC1shRNA were treated with vehicle or 500 ng/ml DOX for 7 days. Lysates were immunoblotted with antibodies against the indicated proteins. e LNCaP-AI/tet-CshRNA (blue circles) and LNCaP-AI/tet-MUC1shRNA (red squares) cells seeded at 2 × 104 cells/ml in androgen-depleted medium were treated with vehicle (open symbols) or 500 ng/ml DOX (closed symbols) for the indicated times. Cell number (mean±SD of three replicates) was determined by trypan blue staining. f LNCaP-AI/tet-MUC1shRNA cells treated with vehicle or 500 ng/ml DOX for 7 days were assayed for invasive capacity in matrigel coated transwell chambers. Results (mean ± SD of five determinations) are expressed as the relative invasive capacity compared to that obtained with the control cells (assigned a value of 1). g LNCaP-AI/tet-CshRNA and LNCaP-AI/tet-MUC1shRNA cells seeded at 500 cells/well in six-well plates were treated with vehicle or 500 ng/ml DOX. Colonies were stained with crystal violet on day 14. The results are expressed as the colony number (mean±SD of three determinations) per well. h LNCaP-AI/tet-CshRNA and LNCaP-AI/tet-MUC1shRNA cells seeded at 5 × 103 cells/well in ultra-low attachment six-well plates were treated with vehicle or 500 ng/ml DOX for 14 days. The results are expressed as the tumorsphere number (mean±SD of three determinations) per well. *p < 0.05 (unpaired Mann–Whitney U test). Dot plots are represented by open circles in the bar graphs. Source data are provided as a Source Data file.
Fig. 2
Fig. 2. MUC1-C induces expression of BRN2 and NE markers.
a,b RNA-seq was performed in triplicate on LNCaP-AI/tet-MUC1shRNA cells treated with vehicle or 500 ng/ml DOX for 7 days. a The datasets were analyzed with GSEA, using the Hallmark gene signature collection. Silencing MUC1 was significantly associated with upregulation of the Androgen Response pathway. b Heatmap depicting the effects of silencing MUC1 on AR pathway genes. c LNCaP, C4-2B and LNCaP-AI cells were analyzed for BRN2 mRNA levels by qRT-PCR. The results (mean±SD of four determinations) are expressed as relative mRNA levels compared to that obtained for LNCaP cells (assigned a value of 1). d Lysates from LNCaP, C4-2B, and LNCaP-AI cells were immunoblotted with antibodies against the indicated proteins. e LNCaP-AI cells stably expressing a tet-CshRNA or tet-MUC1shRNA were treated with 500 ng/ml DOX for 7 days. BRN2 mRNA levels were analyzed by qRT-PCR. The results (mean±SD of four determinations) are expressed as relative mRNA levels compared to that obtained for DOX-treated LNCaP-AI/tet-CshRNA cells (assigned a value of 1). f LNCaP-AI/tet-CshRNA and LNCaP-AI/tet-MUC1shRNA cells were treated with vehicle or 500 ng/ml DOX for 7 days. Lysates were immunoblotted with antibodies against the indicated proteins. g LNCaP-AI cells expressing a tet-CshRNA or tet-MUC1shRNA were treated with 500 ng/ml DOX for 7 days. ASCL1 (left), AURKA (middle) and SYP (right) mRNA levels were analyzed by qRT-PCR. The results (mean±SD of five determinations) are expressed as relative mRNA levels compared to that obtained for DOX-treated LNCaP/tet-CshRNA cells (assigned a value of 1). *p < 0.05 (Student’s t-test). Source data are provided as a Source Data file.
Fig. 3
Fig. 3. MUC1-C induces BRN2 by a MYC-dependent mechanism.
a Soluble chromatin from wild-type (WT) LNCaP and LNCaP-AI cells was precipitated with anti-AR or a control IgG. The DNA samples were amplified by qPCR with primers for the BRN2 promoter. The results (mean±SD of three determinations) are expressed as the relative-fold enrichment compared to that obtained with the IgG control (assigned a value of 1). b Schema of the BRN2 promoter region with positioning of the putative MYC binding motifs. c Soluble chromatin from LNCaP-AI cells was precipitated with anti-MUC1-C, anti-MYC or a control IgG (left). Soluble chromatin from LNCaP-AI cells was precipitated with anti-MUC1-C (ChIP) and then reprecipitated with anti-MYC or a control IgG (re-ChIP) (right). d LNCaP-AI/tet-MUC1shRNA cells were treated with vehicle or 500 ng/ml DOX for 7 days. Soluble chromatin was precipitated with anti-MYC or a control IgG. The DNA samples were amplified by qPCR with primers for the BRN2 promoter. The results (mean ± SD of three determinations) are expressed as the relative-fold enrichment compared to that obtained with the IgG control (assigned a value of 1). e LNCaP-AI cells were transfected with pGL3-Basic Luc, pBRN2-Luc (WT), pBRN2-Luc MUT1 or pBRN2-Luc MUT2 for 48 h and then analyzed for luciferase activity. The results (mean±SD of three determinations) are expressed as relative luciferase activity as compared to that obtained for cells transfected with the pBRN2-Luc (WT) vector (assigned a value of 1). f LNCaP-AI/tet-CshRNA (left panel), LNCaP-AI/tet-MUC1shRNA (middle panel) and LNCaP-AI/tet-MYCshRNA (right panel) cells treated with vehicle or 500 ng/ml DOX for 5 days were transfected with pGL3-Basic Luc or pBRN2-Luc vectors for 48 h and then analyzed for luciferase activity. The results (mean±SD of three determinations) are expressed as relative luciferase activity as compared to that obtained for untreated cells (assigned a value of 1). g LNCaP-AI cells expressing a tet-CshRNA or tet-MYCshRNA were treated with vehicle or 500 ng/ml DOX for 5 days. Lysates were immunoblotted with antibodies against the indicated proteins. *p < 0.05 (Student’s t-test). Source data are provided as a Source Data file.
Fig. 4
Fig. 4. MUC1-C drives BRN2, invasion and self-renewal.
a Lysates from LNCaP, DU-145 and NCI-H660 cells were immunoblotted with antibodies against the indicated proteins. b and c DU-145 cells stably expressing a tet-CshRNA, tet-MUC1shRNA (b) or tet-MYCshRNA (c) were treated with vehicle or 500 ng/ml DOX for 7 days. Lysates were immunoblotted with antibodies against the indicated proteins. d Soluble chromatin from DU-145 cells was precipitated with anti-MUC1-C, anti-MYC or a control IgG (left). Soluble chromatin from DU-145 cells was precipitated with anti-MUC1-C (ChIP) and then reprecipitated with anti-MYC or a control IgG (re-ChIP) (right). e DU-145/tet-MUC1shRNA cells were treated with vehicle or 500 ng/ml DOX for 7 days. Soluble chromatin was precipitated with anti-MYC or a control IgG. The DNA samples were amplified by qPCR with primers for the BRN2 promoter. The results (mean±SD of three determinations) are expressed as the relative-fold enrichment compared to that obtained with the IgG control (assigned a value of 1). f DU-145/tet-CshRNA (blue circles) and DU-145/tet-MUC1shRNA (red squares) cells seeded at 1 × 104 cells/ml were treated with vehicle (open symbols) or 500 ng/ml DOX (closed symbols) for the indicated times. Cell number (mean±SD of three replicates) was determined by trypan blue staining. g DU-145/tet-MUC1shRNA cells treated with vehicle or 500 ng/ml DOX for 7 days were assayed for invasive capacity in matrigel coated transwell chambers. Results (mean±SD of five determinations) are expressed as the relative invasive capacity compared to that obtained with the control cells (assigned a value of 1). h DU-145/tet-CshRNA and DU-145/tet-MUC1shRNA cells seeded at 100 cells/well in six-well plates were treated with vehicle or 500 ng/ml DOX. Colonies were stained with crystal violet on day 9. The results are expressed as the colony number (mean±SD of four determinations) per well. *p < 0.05 (Student’s t-test). Source data are provided as a Source Data file.
Fig. 5
Fig. 5. MUC1-C drives effectors of lineage plasticity.
a RNA-seq was performed in triplicate on LNCaP-AI/tet-MUC1shRNA (left) and DU-145/tet-MUC1shRNA (right) cells treated with vehicle or 500 ng/ml DOX for 7 days. The datasets were analyzed with GSEA, using the Hallmark gene signature collection for the p53 Pathway. b RNA-seq was performed in triplicate on LNCaP-AI/tet-MUC1shRNA (left) and DU-145/tet-MUC1shRNA (right) cells treated with vehicle or 500 ng/ml DOX for 7 days. The datasets were analyzed with GSEA, using the Hallmark gene signature collection for E2F Targets. c and d. LNCaP cells expressing tet-MUC1-C were treated with vehicle or 500 ng/ml DOX for 7 days. MUC1-C, BRN2 and SOX2 mRNA levels were analyzed by qRT-PCR (c). The results (mean±SD of three determinations) are expressed as relative mRNA levels compared to that obtained for vehicle-treated cells (assigned a value of 1). Lysates were immunoblotted with antibodies against the indicated proteins (d). e and f LNCaP-AI cells stably expressing a tet-CshRNA or tet-MUC1shRNA were treated with vehicle or 500 ng/ml DOX for 7 days. SOX2 mRNA levels were analyzed by qRT-PCR (e). The results (mean±SD of five determinations) are expressed as relative mRNA levels compared to that obtained for DOX-treated LNCaP-AI/tet-CshRNA cells (assigned a value of 1). Lysates were immunoblotted with the indicated antibodies (f). g Lysates from DU-145/tet-CshRNA and DU-145/tet-MUC1shRNA cells treated with vehicle or 500 ng/ml DOX for 7 days were immunoblotted with antibodies against the indicated proteins. h Lysates from DU-145/CshRNA and DU-145/BRN2shRNA cells were immunoblotted with antibodies against the indicated proteins. *p < 0.05 (Student’s t-test). Source data are provided as a Source Data file.
Fig. 6
Fig. 6. Targeting MUC1-C suppresses LNCaP-AI tumorigenicity.
a Six-week old nude male mice were injected subcutaneously in the flank with 3 × 106 LNCaP-AI/tet-MUC1shRNA cells. Mice were pair-matched into two groups when tumors reached 100–150 mm3 and were fed without and with DOX. Tumor volumes are expressed as the mean±SD for six mice. b Lysates from tumors obtained on day 24 were immunoblotted with antibodies against the indicated proteins. c Schema of the MUC1-C subunit with the amino acid sequence of the 72 aa cytoplasmic domain. Highlighted is the CQC motif, which is necessary for MUC1-C homodimerization, nuclear localization and function. The CQC motif is targeted by the cell-penetrating GO-203 peptide ((R9)-CQCRRKN). Highlighted is the MUC1-C→IKK→NF-κB p65 pathway that activates EZH2 intron 1. Also highlighted is the region of the MUC1-C cytoplasmic domain that binds directly to β-catenin and TCF4 and induces MYC transcription,. In turn, MYC activates CDK4 with phosphorylation and inhibition of RB,. The MUC1-C cytoplasmic domain also functions in regulating p53 expression and function. d LNCaP-AI cells seeded at 2 × 104 cells/ml in androgen-depleted medium were left untreated or treated with 5 μM GO-203 for the indicated days. Cell number (mean±SD of three determinations) was determined by trypan blue staining. e Lysates obtained on day 3 were immunoblotted with antibodies against the indicated proteins. f Castrated 6-week old nude male mice were injected subcutaneously in the flank with 3 × 106 LNCaP-AI cells. Mice were pair-matched into two groups when tumors reached 100–150 mm3 and were treated IV with vehicle or GO-203/NPs weekly for 3 weeks. Tumor volumes are expressed as the mean±SD for six mice. g Lysates from tumors obtained on day 25 were immunoblotted with antibodies against the indicated proteins. Source data are provided as a Source Data file.
Fig. 7
Fig. 7. Targeting MUC1-C suppresses BRN2 and self-renewal.
a DU-145 cells seeded at 5 × 104 cells/ml in androgen-depleted medium were left untreated or treated with 5 μM GO-203 for the indicated times. Cell number (mean±SD of three determinations) was determined by trypan blue staining. b Lysates obtained on day 3 were immunoblotted with antibodies against the indicated proteins. c Castrated 6-week old nude male mice were injected subcutaneously in the flank with 3 × 106 DU-145 cells. Mice were pair-matched into two groups when tumors reached 100–150 mm3 and were treated IV with vehicle or GO-203/NPs weekly for 3 weeks. Tumor volumes are expressed as the mean±SD for six mice. d Lysates from tumors obtained on day 25 were immunoblotted with antibodies against the indicated proteins. e Lysates from DU-145 and NCI-H660 cells were immunoblotted with antibodies against the indicated proteins. f NCI-H660 cells seeded at 1 × 106 cells/ml in androgen-depleted medium were left untreated or treated with 5 μM GO-203 for the indicated times. Cell number (mean±SD of three determinations) was determined by trypan blue staining. g Lysates obtained on day 2 were immunoblotted with antibodies against the indicated proteins. Source data are provided as a Source Data file.
Fig. 8
Fig. 8. MUC1 overexpression associates with NE differentiation.
a MUC1 copy-number alteration (CNA) data for the TCGA-PRAD, SU2C-CRPC, and NEPC cohorts. b Localized prostate cancer, hormone-naïve samples (n = 22) were compared to metastatic CRPC samples (n = 29),. Multiple probe set IDs for MUC1 were averaged for each patient sample after normalization to obtain a representative expression value for the gene. The center line indicates the median value, bounds of the box denote 25th (lower) and 75th (upper) percentiles, and whiskers indicate minimum (lower) and maximum (upper) values excluding outliers. Student’s t-test was used to compare groups (p-value = 0.038). c Normalized expression data for the SU2C-CRPC cohort were downloaded from cBioPortal, and median expression used to group samples into MUC1 high and MUC1 low groups. Expression of AR and AR target genes was assessed in MUC1 high and MUC1 low groups using a Wilcoxon rank-sum test. Boxplots represent the 1st quartile, median and 3rd quartile of each distribution. Whiskers extend to the maximum and minimum values up to 1.5*interquartile range (IQR). dg Data were downloaded from cbioportal. NEPCs and CRPCs were analyzed together. d Samples were dichotomized by MUC1 high (n = 105) and MUC1 low (n = 106) expression defined by the normalized median expression value. Samples were analyzed for KLK3 expression. Student’s t-test was used to compare groups (p< 0.0001). e Samples were dichotomized by MUC1 high (n = 116) and MUC1 low (n = 96) expression defined as normalized expression value ≥ 1.4 or < 1.4. Samples with undetectable BRN2 values were excluded. Student’s t-test was used to compare groups (p= 0.038). f Samples were dichotomized by MUC1 high (n = 106) and MUC1 low (n = 106) expression defined as normalized median expression value. Presence of SOX2 expression was defined as an FKPM value > 0. Fisher’s exact test was used to compare groups. g Samples were dichotomized by MUC1 high (n = 80) and MUC1 low (n = 66) expression defined as normalized expression value. Samples with NEPC values were retained for analysis. NEPC score was calculated using polyA RNA-seq data as described. Student’s t-test was used to compare groups (p= 0.0001).
Fig. 9
Fig. 9. Proposed model for MUC1-C in driving PC lineage plasticity.
MUC1-C activates the MYC gene, binds directly to the MYC HLH/LZ domain and contributes to induction of MYC target genes, including CDK4 with phosphorylation of RB,,. MUC1-C also promotes inactivation of RB by MYC/BMI1-mediated suppression of CDKN2A/p16 (ref. ). In the present studies, we found that MUC1-C induces MYC occupancy on the BRN2 promoter with induction of BRN2 expression. In turn, BRN2 induces SOX2 expression. In addition to MYC and SOX2, we show that MUC1-C drives KLF4 and OCT4 (OSKM), which are collectively sufficient for inducing pluripotency and dedifferentiation of somatic cells. MUC1-C also suppresses the p53 signaling pathway and CDKN1A/p21. In addition to MYC, MUC1-C activates the inflammatory TAK1→IKK→NF-κB p65 pathway and, by binding directly to NF-κB p65, promotes activation of NF-κB p65 target genes, including (i) ZEB1 and thereby EMT and stemness, and (ii) EZH2 with increases in H3K27me3 (refs. ,). In this way, MUC1-C integrates activation of the MYC and NF-κB p65 pathways with suppression of p53 and regulation of the RB-E2F axis to drive PC lineage plasticity with dedifferentiation and pluripotency.

References

    1. Puca L, Vlachostergios PJ, Beltran H. Neuroendocrine differentiation in prostate cancer: emerging biology, models, and therapies. Cold Spring Harb. Perspect. Med. 2019;9:a030593. doi: 10.1101/cshperspect.a030593. - DOI - PMC - PubMed
    1. Davies AH, Beltran H, Zoubeidi A. Cellular plasticity and the neuroendocrine phenotype in prostate cancer. Nat. Rev. Urol. 2018;15:271–286. doi: 10.1038/nrurol.2018.22. - DOI - PubMed
    1. Aggarwal R, et al. Clinical and genomic characterization of treatment-emergent small-cell neuroendocrine prostate cancer: a multi-institutional prospective study. J. Clin. Oncol. 2018;36:2492–2503. doi: 10.1200/JCO.2017.77.6880. - DOI - PMC - PubMed
    1. Abida W, et al. Genomic correlates of clinical outcome in advanced prostate cancer. Proc. Natl Acad. Sci. USA. 2019;116:11428–11436. doi: 10.1073/pnas.1902651116. - DOI - PMC - PubMed
    1. Rickman DS, Beltran H, Demichelis F, Rubin MA. Biology and evolution of poorly differentiated neuroendocrine tumors. Nat. Med. 2017;23:1–10. doi: 10.1038/nm.4341. - DOI - PubMed

Publication types

MeSH terms

Substances