. 2020 Jan 17;11(1):347.
doi: 10.1038/s41467-019-14159-1.

Functional brain architecture is associated with the rate of tau accumulation in Alzheimer's disease

Collaborators, Affiliations

Functional brain architecture is associated with the rate of tau accumulation in Alzheimer's disease

Nicolai Franzmeier et al. Nat Commun. .

Abstract

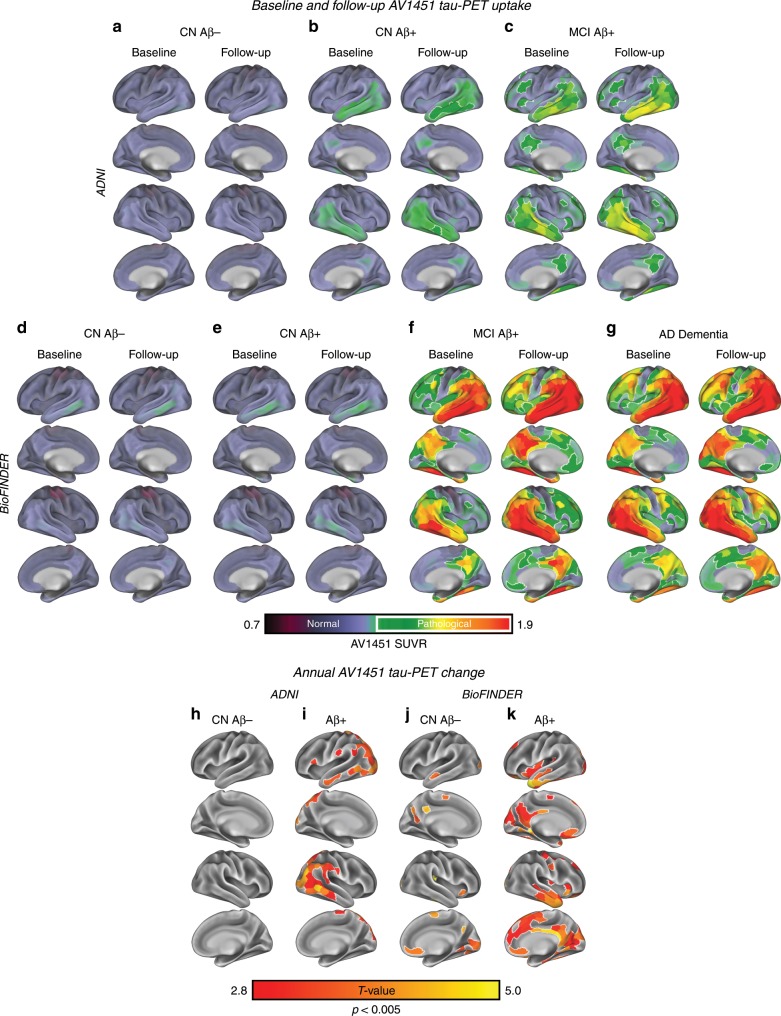
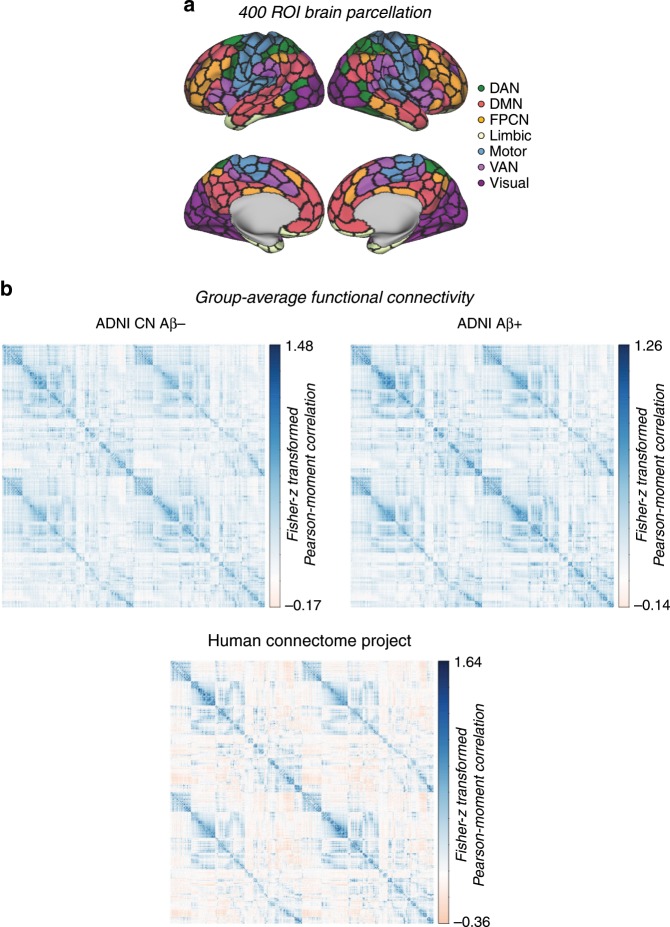
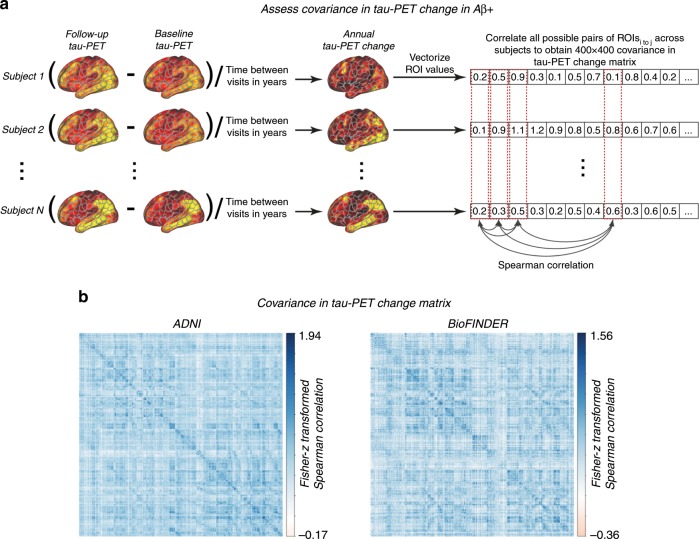
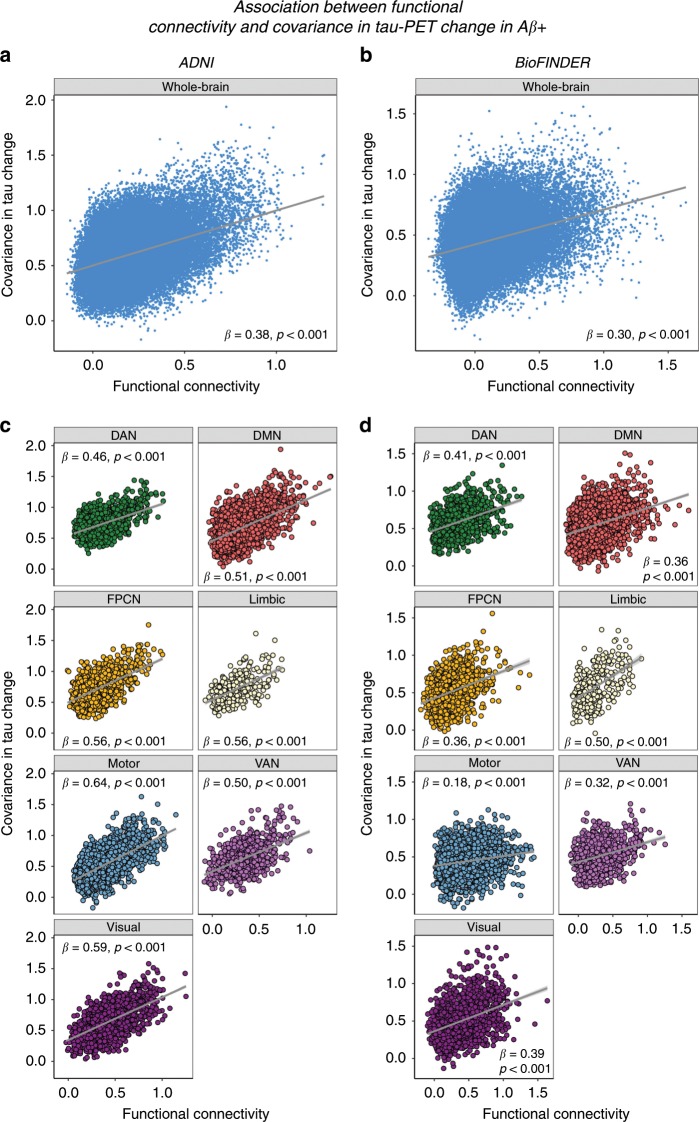
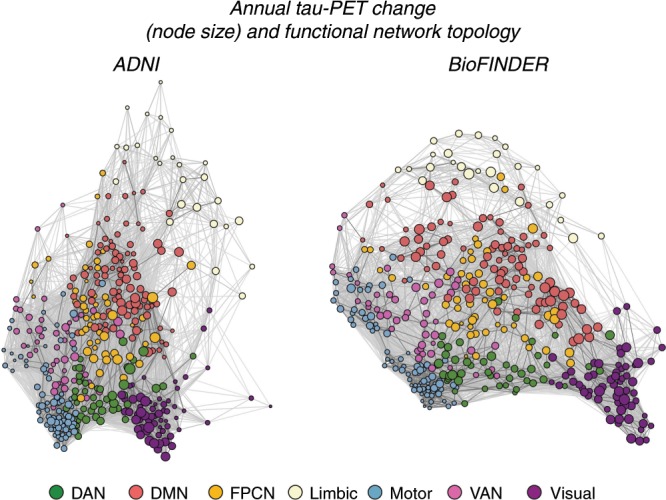
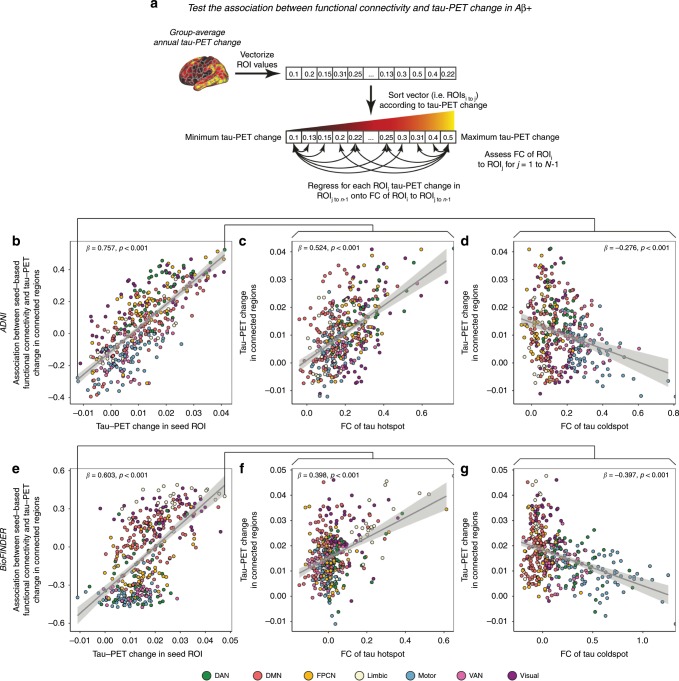
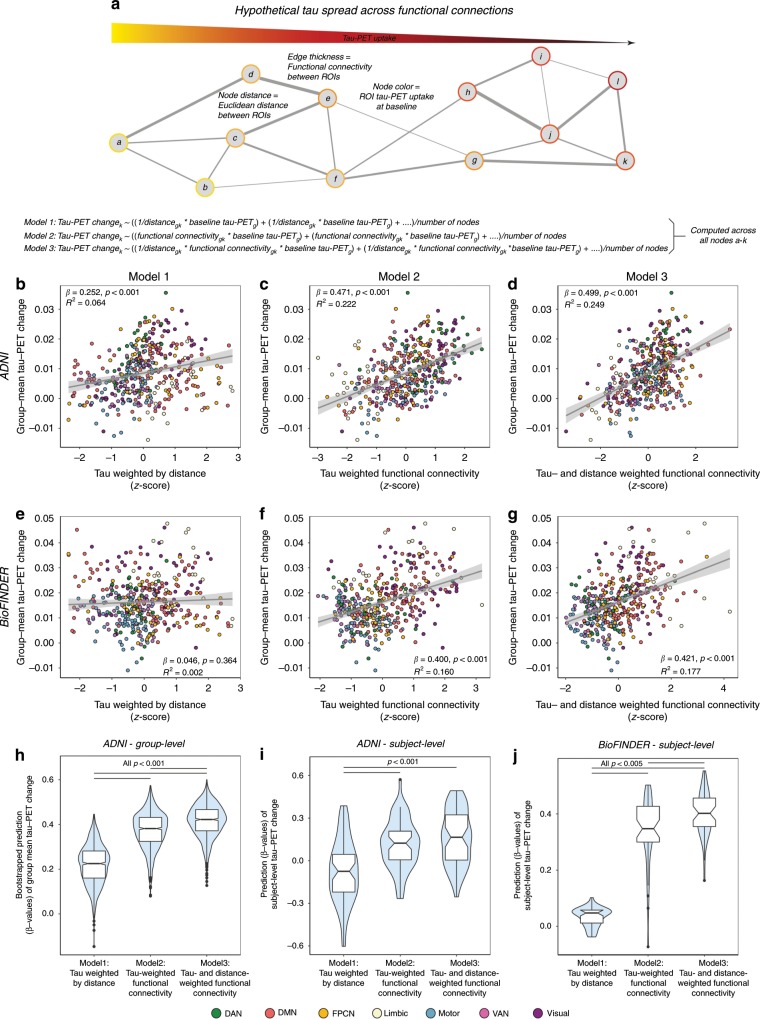
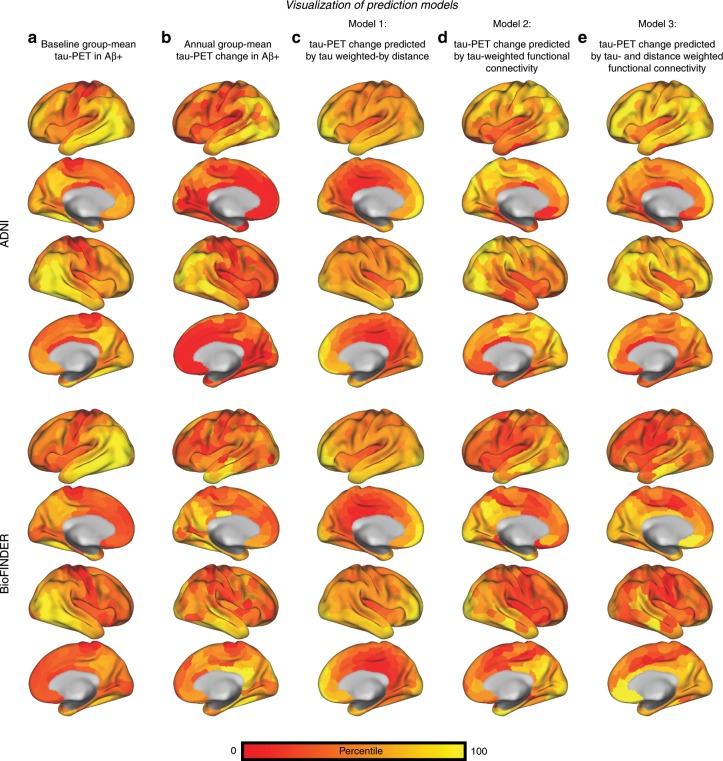
In Alzheimer's diseases (AD), tau pathology is strongly associated with cognitive decline. Preclinical evidence suggests that tau spreads across connected neurons in an activity-dependent manner. Supporting this, cross-sectional AD studies show that tau deposition patterns resemble functional brain networks. However, whether higher functional connectivity is associated with higher rates of tau accumulation is unclear. Here, we combine resting-state fMRI with longitudinal tau-PET in two independent samples including 53 (ADNI) and 41 (BioFINDER) amyloid-biomarker defined AD subjects and 28 (ADNI) vs. 16 (BioFINDER) amyloid-negative healthy controls. In both samples, AD subjects show faster tau accumulation than controls. Second, in AD, higher fMRI-assessed connectivity between 400 regions of interest (ROIs) is associated with correlated tau-PET accumulation in corresponding ROIs. Third, we show that a model including baseline connectivity and tau-PET is associated with future tau-PET accumulation. Together, connectivity is associated with tau spread in AD, supporting the view of transneuronal tau propagation.


Conflict of interest statement

The authors declare no competing interests.

Figures

Fig. 1
Fig. 1. Group-average tau-PET levels.
Group-average tau-PET levels for the ADNI (ac) and BioFINDER (de) samples, stratified by diagnostic group. Tau-PET levels are showed as continuous values, where pathological tau-PET levels (i.e., surpassing an SUVR of 1.3) are highlighted by white outlines in Panels ag. Group-average data are shown in ADNI for 28 CN Aβ− (a), 32 CN Aβ+ (b) and 21 MCI Aβ+ (c) at baseline and follow-up. For BioFINDER, group-average data are shown for 16 CN Aβ− (d), 16 CN Aβ+ (e), 7 MCI Aβ+ (f) and 18 AD Dementia patients (g). In ADNI, ROI-wise t-tests against zero show no significant annual tau-PET increases in 28 CN Aβ− (h), but significant (p < 0.005) temporo-parietal tau-PET changes in 53 Aβ+ (i). In BioFINDER, t-tests against zero show minor annual tau-PET increases in the 16 CN Aβ− (j), but widespread temporal, parietal and frontal tau-PET increases in the 41 Aβ+ subjects (k).
Fig. 2
Fig. 2. Brain parcellation and resting-state fMRI.
a Surface rendering of the 400 ROI brain parcellation that was applied to tau-PET and resting-state fMRI data for ROI based analyses. b Group-average functional connectivity matrices for 28 CN Aβ− and 53 Aβ+ of the ADNI sample, as well as for 500 subjects from the human-connectome project (HCP). In ADNI, no Bonferroni-corrected differences (p < 0.05) in functional connectivity were found between the Aβ+ and CN-Aβ− in ANCOVAS controlling for age, sex, education and diagnosis.
Fig. 3
Fig. 3. Assessment of covariance in tau-PET change.
a Assessment of covariance in tau-PET change. In a first step, annual change in tau-PET was determined as the ROI-wise difference in tau-PET between baseline and follow-up divided by the time between both tau-PET assessments in years. ROI-specific annual tau-PET change scores were vectorized for each of the Aβ + subjects within each sample, yielding subject-specific 400-element vectors. Within the Aβ+ groups of the ADNI (N = 53) and BioFINDER (N = 41) samples, the subject-specific 400-element vectors were concatenated across subjects to a 53 × 400 (ADNI) and 41 × 400 (BioFINDER) matrix, where we assessed the Spearman correlation in tau-PET change between ROIs across subjects, yielding a (b) 400 × 400 covariance in tau-PET change matrix for each sample that was subsequently Fisher-z transformed.
Fig. 4
Fig. 4. Association between functional connectivity and covariance in tau-PET change.
Scatterplots illustrating the association between group-average functional connectivity and covariance in tau-PET change in the Aβ+ groups of the ADNI (N = 53) and BioFINDER (N = 41) samples, for the whole brain (a, b) or for the seven canonical brain networks (c, d). Standardized β- and p-values were derived from linear regression. Source data are provided in a Source data file.
Fig. 5
Fig. 5. Tau-PET change and functional network topology.
Force-directed graphs illustrating ROI-specific annual tau-PET change in the Aβ+ (node size) subjects (ADNI, N = 53, left panel; BioFINDER, N = 41, right panel) within the context of functional connectivity (node distance, defined based on the Fruchtermann-Reingold algorithm applied to group-average functional connectivity data).
Fig. 6
Fig. 6. Associations between functional connectivity and tau-PET change.
a Pipeline for testing the association between group-average functional connectivity and annual tau-PET change in the 53 Aβ+ from ADNI and 41 Aβ+ subjects from BioFINDER. subjects. For both ADNI (b) and BioFINDER (e), we plotted the association between annual tau-PET change of a seed-ROI (x-axis) and the regression-derived association between its’ functional connectivity to target regions and tau-PET change in the respective target regions (y-axis). Positive y-values indicate that higher FC to target regions is associated with higher annual tau-PET change, while negative y-values indicate that higher FC to target regions is associated with lower annual tau-PET changes. Illustration of the association between seed-based functional connectivity (x-axis) and annual tau-PET change in connected regions (y-axis) for ROIs with maximum (ADNI: c; BioFINDER: f) and minimum (ADNI: d; BioFINDER: g) annual tau-PET change. Linear model fits are indicated together with 95% confidence intervals. Source data are provided in a Source data file.
Fig. 7
Fig. 7. Prediction of longitudinal tau-PET change.
a Hypothetical network spreading model of tau pathology. Each node within the network represents a brain region, where color indicates local tau pathology, distance between regions indicates connection length (i.e. Euclidean distance) and edge thickness indicates functional connectivity strength. Example formulas for models 1–3 illustrate how we computed tau-weighted distance (Model 1), tau-weighted functional connectivity (Model 2) or tau- & distance-weighted functional connectivity (Model 3) that were used to model group-mean annual tau-PET change in the 53 Aβ + ADNI (bd) and 41 Aβ + BioFINDER subjects (eg). For ADNI, we computed the association illustrated in (bd) for 1000 bootstrapped samples (h). Resulting β-value distributions (y-axis) were compared between Models 1–3 using an ANOVA with post-hoc Tukey-test (x-axis). f Prediction models 1–3 were assessed on the subject-level for 53 ADNI Aβ+ and 41 BioFINDER Aβ+ subjects using subject-level annual tau-PET change and subject-level connectivity (ADNI) or HCP-derived group-level functional connectivity (BioFINDER). Subject-derived β-value distributions were compared across Models 1–3 using an ANOVA. Source data are provided in a Source data file. Linear model fits are indicated together with 95% confidence intervals.
Fig. 8
Fig. 8. Surface rendering of predicted tau-PET change.
Surface renderings of percentile-transformed group-mean tau-PET at baseline (a) and annual tau-PET change (b) for Aβ+ subjects of the ADNI (N = 53) and BioFINDER (N = 41) sample. The prediction of tau-PET change from Models 1–3 shown in Fig. 7 is illustrated via surface renderings in (ce).

References

    1. Jack CR, Jr, et al. NIA-AA Research Framework: toward a biological definition of Alzheimer's disease. Alzheimers Dement. 2018;14:535–562. doi: 10.1016/j.jalz.2018.02.018. - DOI - PMC - PubMed
    1. Selkoe DJ, Hardy J. The amyloid hypothesis of Alzheimer's disease at 25 years. EMBO Mol. Med. 2016;8:595–608. doi: 10.15252/emmm.201606210. - DOI - PMC - PubMed
    1. Braak H, Braak E. Neuropathological stageing of Alzheimer-related changes. Acta Neuropathol. 1991;82:239–259. doi: 10.1007/BF00308809. - DOI - PubMed
    1. Braak H, Thal DR, Ghebremedhin E, Del Tredici K. Stages of the pathologic process in Alzheimer disease: age categories from 1 to 100 years. J. Neuropathol. Exp. Neurol. 2011;70:960–969. doi: 10.1097/NEN.0b013e318232a379. - DOI - PubMed
    1. Saper CB, Wainer BH, German DC. Axonal and transneuronal transport in the transmission of neurological disease: potential role in system degenerations, including Alzheimer's disease. Neuroscience. 1987;23:389–398. doi: 10.1016/0306-4522(87)90063-7. - DOI - PubMed

Publication types