. 2020 Jan 17;11(1):357.
doi: 10.1038/s41467-019-14199-7.

Self-assembled single-atom nanozyme for enhanced photodynamic therapy treatment of tumor

Affiliations

Self-assembled single-atom nanozyme for enhanced photodynamic therapy treatment of tumor

Dongdong Wang et al. Nat Commun. .

Abstract

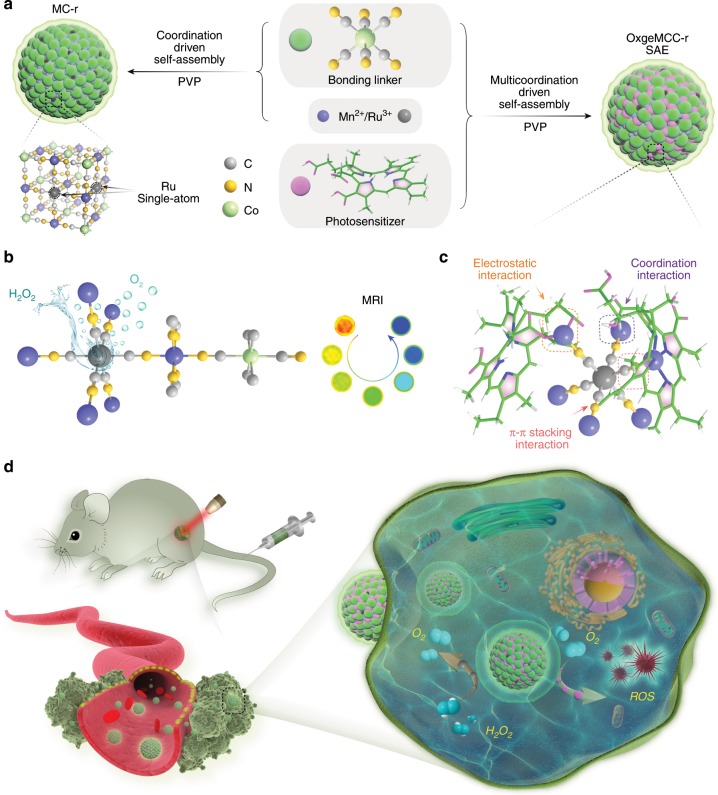
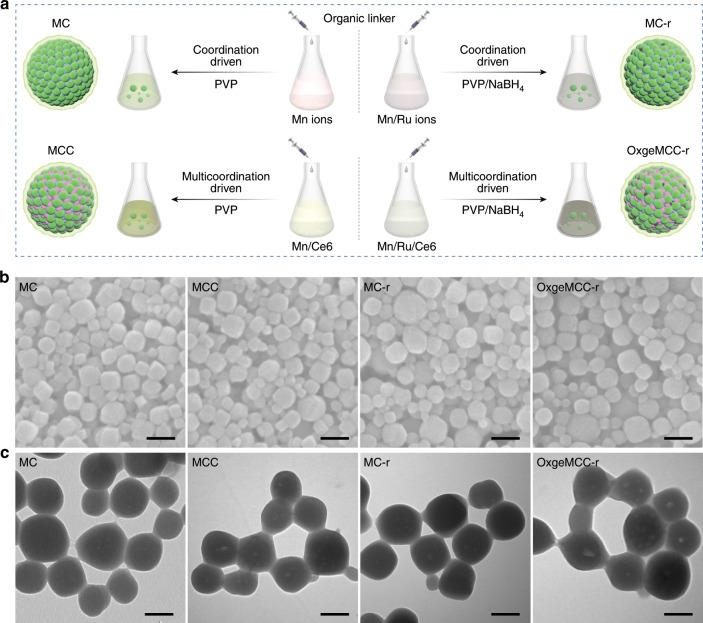
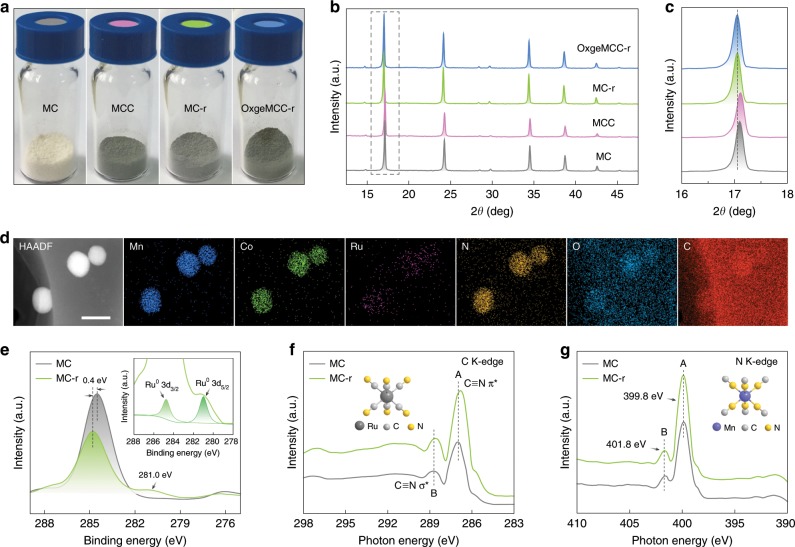
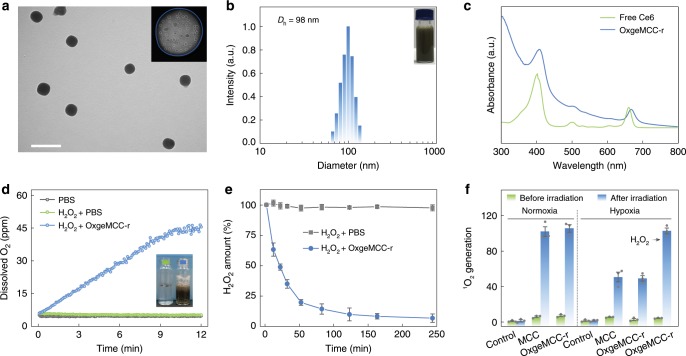
Hypoxia of solid tumor compromises the therapeutic outcome of photodynamic therapy (PDT) that relies on localized O2 molecules to produce highly cytotoxic singlet oxygen (1O2) species. Herein, we present a safe and versatile self-assembled PDT nanoagent, i.e., OxgeMCC-r single-atom enzyme (SAE), consisting of single-atom ruthenium as the active catalytic site anchored in a metal-organic framework Mn3[Co(CN)6]2 with encapsulated chlorin e6 (Ce6), which serves as a catalase-like nanozyme for oxygen generation. Coordination-driven self-assembly of organic linkers and metal ions in the presence of a biocompatible polymer generates a nanoscale network that adaptively encapsulates Ce6. The resulted OxgeMCC-r SAE possesses well-defined morphology, uniform size distribution and high loading capacity. When conducting the in situ O2 generation through the reaction between endogenous H2O2 and single-atom Ru species of OxgeMCC-r SAE, the hypoxia in tumor microenvironment is relieved. Our study demonstrates a promising self-assembled nanozyme with highly efficient single-atom catalytic sites for cancer treatment.


Conflict of interest statement

The authors declare no competing interests.

Figures

Fig. 1
Fig. 1. Design of OxgeMCC-r nanozyme with single-atom Ru for cancer treatment.
a Schematic illustration of OxgeMCC-r. OxgeMCC-r consists of catalytically active single-atom Ru site anchored in MCC with outer PVP protection layer. b Partial molecular structure of OxgeMCC-r with active single-atom Ru site serving as catalase-like nanozyme for oxygen generation. c Multicomponent coordination interactions within the OxgeMCC-r SAE. d Scheme of continuously catalytic oxygen generation and ROS production for enhanced PDT of cancer by OxgeMCC-r SAE.
Fig. 2
Fig. 2. Synthesis and morphology characterizations.
a Schematic illustration for the self-assembly of MC, MCC, MC-r nanoparticles, and OxgeMCC-r SAE. The organic linker [Co(C≡N)6] in syringe was added dropwise into four conical flasks filled with different systems under vigorous stirring. Turbidity was observed immediately upon the addition of [Co(C≡N)6] in the presence of PVP surfactant. b SEM images of the as-prepared MC, MCC, MC-r, and OxgeMCC-r. Scale bar is 100 nm. c Corresponding TEM images. Scale bar is 50 nm.
Fig. 3
Fig. 3. Structure characterizations.
a Photograph of MC, MCC, MC-r, and OxgeMCC-r SAE. b Powder XRD of corresponding materials. c Enlarged powder XRD (2θ from 16 to 18 degree) of b. d HAADF-STEM image and corresponding EDS elemental mapping (Mn, Co, Ru, N, O, and C elements) of OxgeMCC-r SAEs. Scale bar is 100 nm. e C 1s XPS spectrum magnified from Supplementary Figs. 1 and 3. Inset is the enlarged Ru 3d spectrum of MC-r. f C K-edge NEXAFS spectra of MC and MC-r. g N K-edge NEXAFS spectra of MC and MC-r.
Fig. 4
Fig. 4. Structure, oxygen generation, and singlet oxygen generation of OxgeMCC-r SAE.
a Representative TEM image. Inset is the enlarged image of one single OxgeMCC-r SAE after reversed-phase treatment. White dotted circles indicate the encapsulated Ce6. Scale bar is 200 nm. b DLS profile with the inset picture of the sample dispersed in water. c UV-vis absorption spectra of free Ce6 and OxgeMCC-r SAE. d O2 generation after treating OxgeMCC-r SAE with H2O2 in PBS. Inset is a photograph of H2O2 solutions in the presence or absence of OxgeMCC-r SAE. e Degradation profiles of H2O2 with or without of OxgeMCC-r SAE. f Singlet oxygen (1O2) generation ability determined by DPBF indicator under different conditions before and after laser irradiation (671 nm, 100 mW cm−2, 30 s). Data are presented as mean ± s.e.m. (n = 3).
Fig. 5
Fig. 5. In vitro biocompatibility, alleviation of hypoxic condition, and intracellular O2 generation.
a 4T1 cells viability after treated with MC-r nanoparticles with different concentrations. Data are presented as mean ± s.e.m. (n = 4). b Fluorescence imaging of 4T1 cells with stained HIF-1α (green) and tubulin (red) after treated with PBS under normoxic condition (21% O2, 5% CO2, and 74% N2) as well as PBS (Hypoxia) and MC-r (Hypoxia/25 ppm and Hypoxia/50 ppm) under hypoxic condition (1% O2, 5% CO2, and 94% N2). Scale bar is 10 µm. c Relative intensity of corresponding green fluorescence from HIF-1α under different treating conditions. Data are presented as mean ± s.e.m. (n = 3). Statistical analysis was performed via one-way ANOVA. *p < 0.05, **p < 0.01, ***p < 0.001. d Western blot analysis of HIF-1α expression in 4T1 cells under different treating conditions. e Fluorescence imaging of 4T1 cells stained by O2 indicator after treatments with different conditions. Scale bar is 100 µm.
Fig. 6
Fig. 6. In vitro PDT evaluation of OxgeMCC-r SAE on 4T1 tumor cells.
Cell viability assay of free Ce6, MCC, and OxgeMCC-r SAE treated 4T1 cells in a normoxic and b hypoxic conditions under 671 nm light irradiation (concentration of Ce6: 8 ppm; 671 nm laser power density: 100 mW cm−2; irradiation time: 30 s). Data are presented as mean ± s.e.m. (n = 4). Statistical analysis was performed via one-way ANOVA. *p < 0.05, **p < 0.01, ***p < 0.001. c Live/dead staining of 4T1 cells treated with PBS, free Ce6, MCC, and OxgeMCC-r SAE in the presence of 671 nm laser irradiation under hypoxic conditions. Green signal from calcein AM indicates live cells and red signal from propidium iodide (PI) indicates dead cells (concentration of Ce6: 8 ppm). Scale bar is 50 µm. d Cell death mechanism after the treatment of PBS, free Ce6, MCC, and OxgeMCC-r SAE in the presence of 671 nm laser irradiation under hypoxic conditions assessed with Annexin V-FITC/PI by flow cytometry.
Fig. 7
Fig. 7. In vitro/vivo MR imaging and biocompatibility of OxgeMCC-r SAE.
a Accumulation of OxgeMCC-r SAE at the tumor site through the EPR effect. b In vitro T1-weighted magnetic resonance images of OxgeMCC-r SAE in aqueous solution with various Mn concentrations (mM). c Transverse relativity (r1) value of 5.44 mM−1 s−1 for OxgeMCC-r SAE. Inset is magnetic resonance phantom images of OxgeMCC-r SAE. Data are presented as mean ± s.e.m. (n = 3). d T1-weighted MR imaging of 4T1 cells treated with PBS, OxgeMCC-r SAE for 2 h, and OxgeMCC-r SAE for 6 h. e Corresponding relative MR imaging intensity of (d). Data are presented as mean ± s.e.m. (n = 3). f In vivo T1-weighted magnetic resonance images of 4T1 tumor-bearing mouse at various time points post-injection. Tumor regions are marked with white dashed lines. g Quantitative T1-weighted MR imaging signals within the tumor site. Data are presented as mean ± s.e.m. (n = 3). h Micrographs of major organs stained with H&E. Scale bar is 50 µm.
Fig. 8
Fig. 8. In vivo PDT efficiency assessments.
a Relative tumor volumes of mice after various treatments (control, Ce6, MCC, and OxgeMCC-r, n = 5). The last three groups were treated with laser irradiation: 5 min with a power density of 100 mW cm−2. Injection dose is 100 µL, with a Ce6 concentration of 4 mg kg−1. b Photographic images of tumors excised from different groups after various treatments indicated. c Average weights of tumors from different groups of mice after various treatments indicated. d Representative hypoxia immunofluorescence images of tumor slices. Nuclei, blood vessels, and hypoxic regions were stained by 4’,6-diamidino-2-phenylindole (DAPI, blue), anti-CD31 antibody (red), and anti-pimonidazole antibody (green), respectively. Scale bar is 100 µm. e H&E staining and f Ki-67 staining of tumor slices from different groups after various treatments. Scale bar is 50 µm. g TUNEL staining of tumor slices from different groups indicated. Scale bar is 50 µm. h MR imaging of tumor-bearing mouse at different treatment points. Data are presented as mean ± s.e.m. (n = 5). Statistical analysis was performed via one-way ANOVA. *p < 0.05, **p < 0.01, ***p < 0.001.

References

    1. Felsher DW. Cancer revoked: oncogenes as therapeutic targets. Nat. Rev. Cancer. 2003;3:375–380. doi: 10.1038/nrc1070. - DOI - PubMed
    1. Lucky SS, Soo KC, Zhang Y. Nanoparticles in photodynamic therapy. Chem. Rev. 2015;115:1990–2042. doi: 10.1021/cr5004198. - DOI - PubMed
    1. Hopper C. Photodynamic therapy: a clinical reality in the treatment of cancer. Lancet Oncol. 2000;1:212–219. doi: 10.1016/S1470-2045(00)00166-2. - DOI - PubMed
    1. Lovell JF, Liu TWB, Chen J, Zheng G. Activatable photosensitizers for imaging and therapy. Chem. Rev. 2010;110:2839–2857. doi: 10.1021/cr900236h. - DOI - PubMed
    1. Tian B, Wang C, Zhang S, Feng L, Liu Z. Photothermally enhanced photodynamic therapy delivered by nano-graphene oxide. ACS Nano. 2011;5:7000–7009. doi: 10.1021/nn201560b. - DOI - PubMed

Publication types

MeSH terms