. 2020 Jan 17;10(1):614.
doi: 10.1038/s41598-019-57234-9.

Endothelial Autophagy: an Effective Target for Radiation-induced Cerebral Capillary Damage

Affiliations

Endothelial Autophagy: an Effective Target for Radiation-induced Cerebral Capillary Damage

Xiaolin Ai et al. Sci Rep. .

Abstract

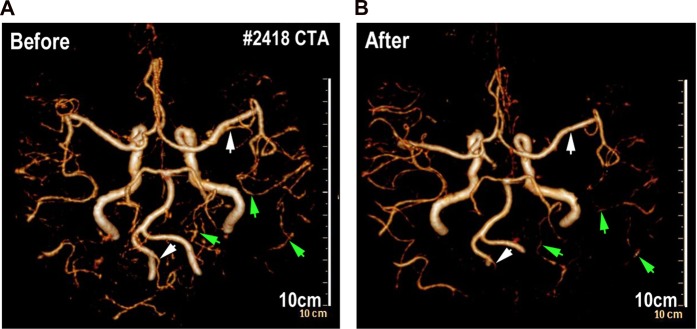
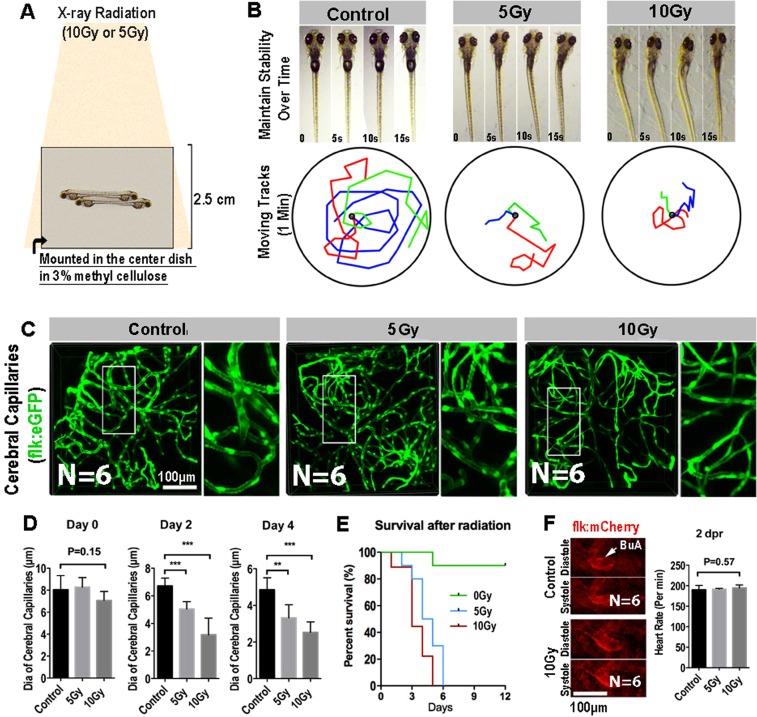
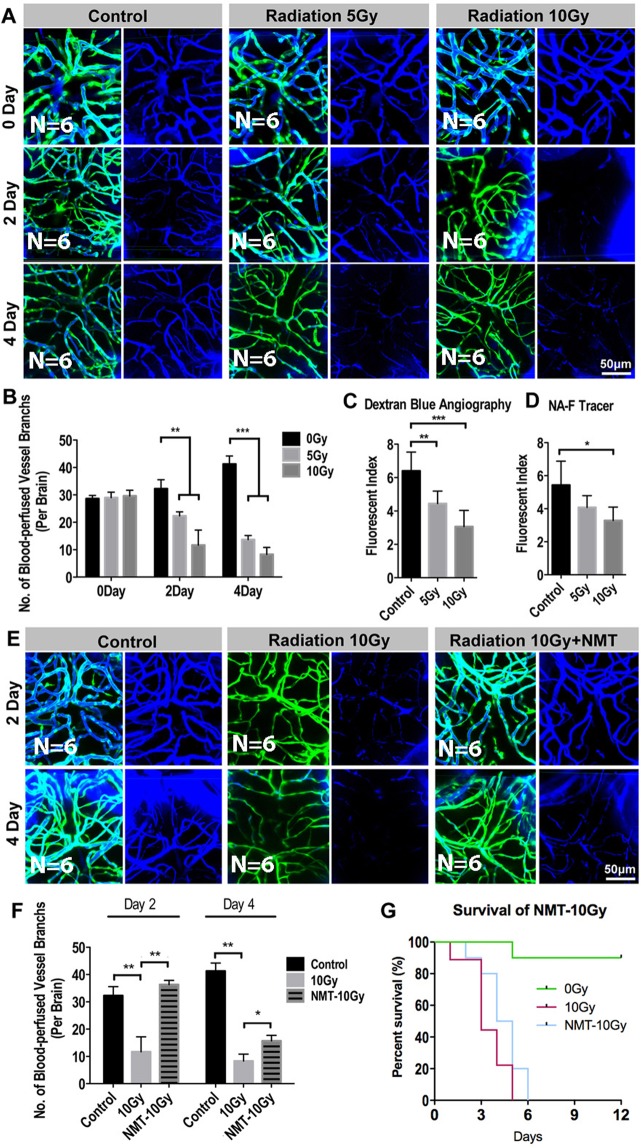
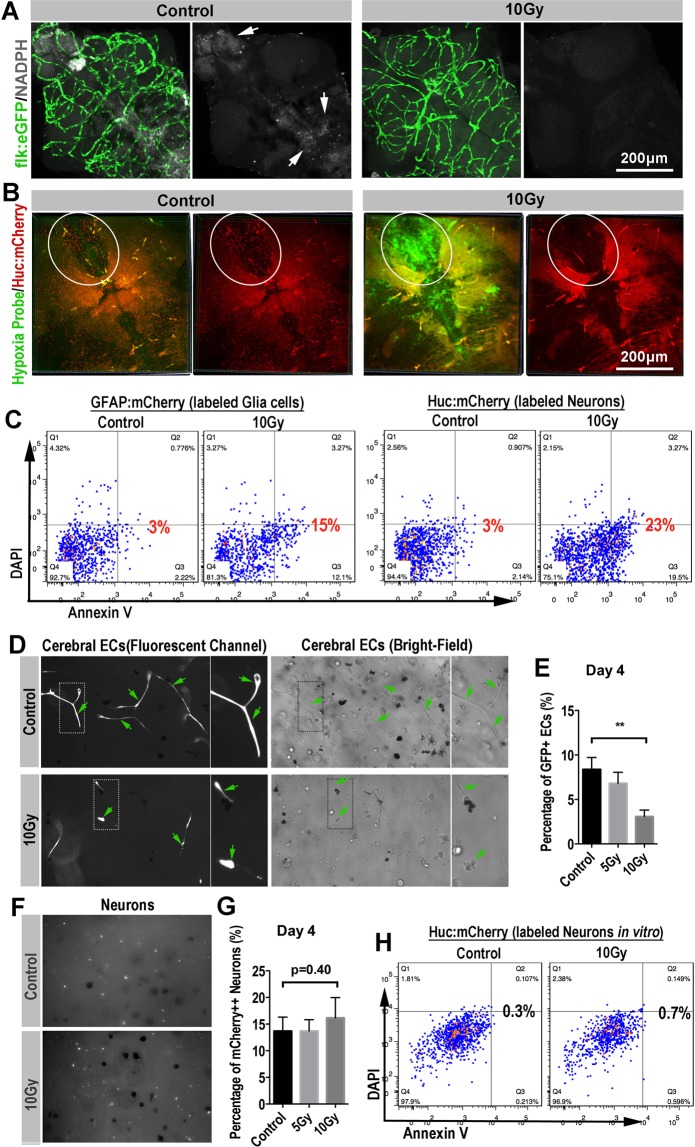
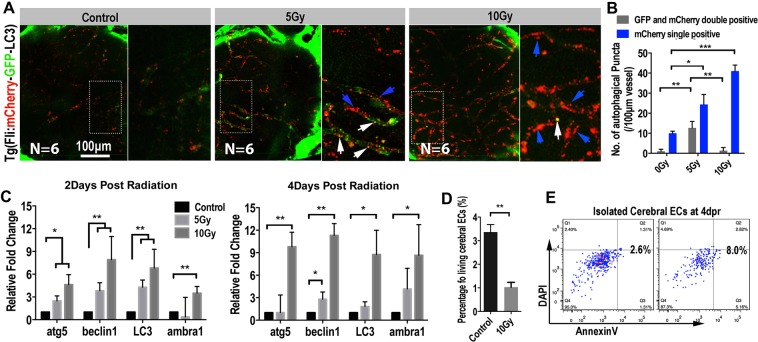
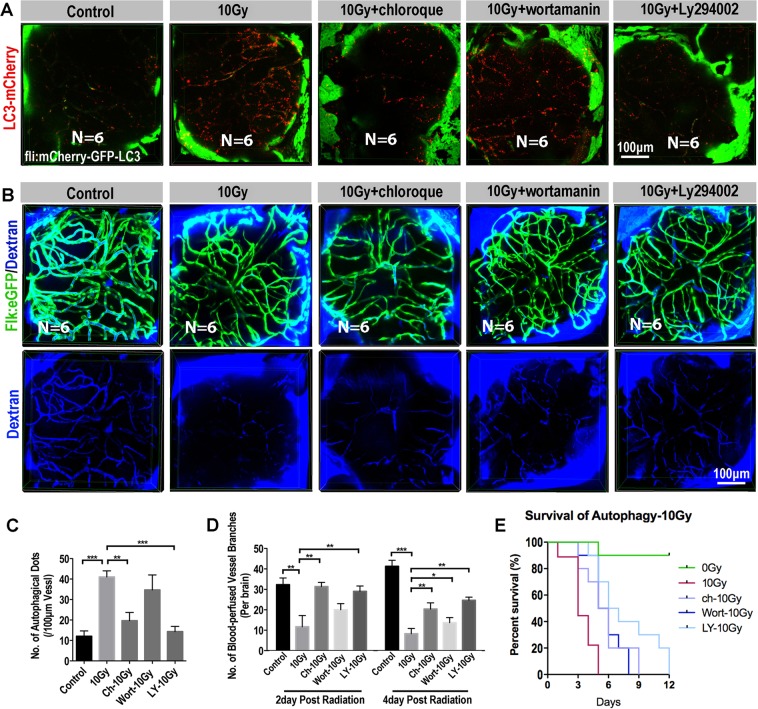
Toxicity to central nervous system tissues is the common side effects for radiotherapy of brain tumor. The radiation toxicity has been thought to be related to the damage of cerebral endothelium. However, because of lacking a suitable high-resolution vivo model, cellular response of cerebral capillaries to radiation remained unclear. Here, we present the flk:eGFP transgenic zebrafish larvae as a feasible model to study the radiation toxicity to cerebral capillary. We showed that, in living zebrafish larvae, radiation could induce acute cerebral capillary shrinkage and blood-flow obstruction, resulting brain hypoxia and glycolysis retardant. Although in vivo neuron damage was also observed after the radiation exposure, further investigation found that they didn't response to the same dosage of radiation in vitro, indicating that radiation induced neuron damage was a secondary-effect of cerebral vascular function damage. In addition, transgenic labeling and qPCR results showed that the radiation-induced acute cerebral endothelial damage was correlated with intensive endothelial autophagy. Different autophagy inhibitors could significantly alleviate the radiation-induced cerebral capillary damage and prolong the survival of zebrafish larvae. Therefore, we showed that radiation could directly damage cerebral capillary, resulting to blood flow deficiency and neuron death, which suggested endothelial autophagy as a potential target for radiation-induced brain toxicity.


Conflict of interest statement

The authors declare no competing interests.

Figures

Figure 1
Figure 1
Whole brain radiations decrease the density of cerebral vessels in human patient. (A) CTA vascular reconstruction images depicting cerebral vascular of patients before whole-brain radiotherapy (left) and 4 months after whole-brain radiotherapy (right). The arrowheads indicate cerebral vascular before whole-brain radiotherapy (left) and after (right).
Figure 2
Figure 2
Radiation specifically damages the brain capillaries of transgenic zebrafish. (A) A schematic representation of X-ray radiation for transgenic zebrafish at 0, 5 and 10 Gy respectively. (B) The ability of maintain stability over 15 s (top) and moving tracks of zebrafish over 1 minute (bottom) at 2-day post radiation in 0, 5 and 10 Gy group (n = 3 zebrafishes per group). (C) Live example of images (each representative of 6 zebrafishes) showing the midbrain region of the zebrafish larva, and depicting endothelial cells (green) of cerebral capillaries in 0, 5 and 10 Gy group at 4-day post radiation. The right images are magnifications of the boxed areas in left images. Scale bars, 100 µm. (D) Morphometric analyses of cerebral capillaries diameter in 0, 5 and 10 Gy group at 0 day, 2-day, 4-day post radiation respectively (n = 6 zebrafishes per group). (E) The survival analysis of zebrafishes in 0, 5 and 10 Gy group (n = 10 zebrafishes per group). (F) Live example of images (each representative of 6 zebrafishes) depicting systole and diastole of heart (red) in 0 and 10 Gy group at 2-day post radiation (left), and heart rate of zebrafishes per minute in control, 5 and 10 Gy group at 2-day post radiation (right). Statistical analysis in D and F was performed using t-test: **P < 0.05, ***P < 0.01. Data represent the mean ± s.e.m.
Figure 3
Figure 3
Radiation-induced endothelial damage results insufficient blood perfusion into the brain. (A) Live example of images (each representative of 6 zebrafishes) depicting endothelial cells (green) of cerebral capillaries (right) and the tracer Dextran blue (MW 10 kDa) pericardial injected (left) in 0, 5 and 10 Gy group at 0 day, 2-day and 4-day post radiation. Scale bars, 100 µm. (B) Morphometric analyses of blood-perfused vessel branches in 0, 5 and 10 Gy group at 0 day, 2-day, 4-day post radiation respectively (n = 6 zebrafishes per group). (C,D) The fluorescence index of the zebrafishes whole brain injected with Dextran blue (C) and fluorescein sodium (Sigma F6337, 376 Da) (D) tested by fluorescein microplate reader in 0, 5 and 10 Gy group at 4-day post radiation (n = 6 zebrafishes per group). (E) Live example of images (each representative of 6 zebrafishes) depicting blood perfusion of zebrafishes brain in 0, 10 Gy and 10 Gy + Nimodipine group at 2-day and 4-day post radiation. Scale bars, 100 µm. (F) Morphometric analyses of blood-perfused vessel branches in 0, 10 Gy and 10 Gy + Nimodipine group at 2-day and 4-day post radiation (n = 6 zebrafishes per group). (G) The survival analysis of zebrafishes in 0, 10 Gy and 10 Gy + Nimodipine group (n = 10 zebrafishes per group). Statistical analysis in (C,D,F) was performed using t-test: **P < 0.05, ***P < 0.01. Data represent the mean ± s.e.m.
Figure 4
Figure 4
Secondary blood-perfusion insufficiency induced the apoptosis of neuron and glial (in vivo/in vitro). (A) Example of images (each representative of 6 zebrafishes) depicting endothelial cells (green) of cerebral capillaries (left) and spontaneous fluorescence (white) of NADPH (right) in 0 and 10 Gy group at 4-day post radiation. Scale bars, 100 µm. (B) Example of images (each representative of 6 zebrafishes) depicting intracranial injection of hypoxia probe (green) and neurons (red) of HuC:mCherry zebrafish in 0 and 10 Gy group at 4-day post radiation. The boxed areas indicated the changes in severity of hypoxia and changes in the number of neurons between 0 and 10 Gy groups. Scale bars, 100 µm. (C) In vivo, glial cells (GFAP:mCherry zebrafish lines) and neurons (HuC:mCherry zebrafish lines) were gated for apoptosis staining in control and 10 Gy group at 4-day post radiation (n = 6 zebrafishes per group). (D) Example of images (each representative of 6 visions) depicting vitro 3-D culture of cerebral endothelial cells in 0 and 10 Gy groups at the fluorescence channel (left) and bright field (right). The arrowheads and boxes indicate the apoptosis of endothelial cells in 10 Gy group compared with 0 Gy group. (E) Flow analysis of percentage of endothelial cells in vitro 3-D culture at 4-day post radiation among 0, 5 and 10 Gy groups. (F) Example of images (each representative of 6 visions) depicting vitro 3-D culture of neurons (white) in 0 and 10 Gy groups at 4-day post radiation. (G) Flow analysis of percentage of neurons in vitro 3-D culture at 4-day post radiation among 0, 5 and 10 Gy groups. (H) Neurons (HuC:mCherry zebrafish lines) in vitro 3-D culture were gated for apoptosis staining in 0 and 10 Gy group at 4-day post radiation (n = 6 zebrafishes per group). Statistical analysis in (E,G) was performed using t-test: **P < 0.05, ***P < 0.01. Data represent the mean ± s.e.m.
Figure 5
Figure 5
Extensive endothelial autophagy was induced by the radiation in the brain. (A) Example of images (each representative of 6 zebrafishes) depicting autophagosome (green) of endothelial cells and autolysosome (red) of endothelial cells in 0 and 10 Gy group at 4-day post radiation. The right images are magnifications of the boxed areas in left images. Scale bars, 100 µm. (B) Morphometric analyses of GFP and mCherry double positive puncta (yellow puncta) and mCherry single positive puncta in 0, 5 and 10 Gy group at 4-day post radiation. The right images are magnifications of the boxed areas in left images. Scale bars, 100 µm. (C) Real-time quantification of single-cell mRNA expression levels of autophagy-related genes in radiation induced zebrafish endothelial cells at 2-day, 4-day post radiation respectively (n = 3 endothelial cells per group). Gene expression levels were normalized to those of β-actin in the control group. (D) Endothelial cells (flk:eGFP zebrafish lines) in vitro 3-D culture were gated for apoptosis staining in 0 and 10 Gy group at 4-day post radiation (n = 6 zebrafishes per group). Statistical analysis in (C) was performed using t-test: **P < 0.05, ***P < 0.01. Data represent the mean ± s.e.m.
Figure 6
Figure 6
Inhibition of autophagy enhanced the blood perfusion into the brain b (A) Example of images (each representative of 6 zebrafishes) depicting autophagosome (green) of endothelial cells and autolysosome (red) of endothelial cells in 0, 10 Gy group, 10 Gy + chloroque group, 10 Gy + wortamanin group and 10 Gy + Ly294002 group at 4-day post radiation. Scale bars, 100 µm. (B) Live example of images (each representative of 6 zebrafishes) depicting endothelial cells (green) of cerebral capillaries (top) and the tracer Dextran blue (MW 10 kDa) pericardial injected (bottom) in 0, 10 Gy group, 10 Gy + chloroque group, 10 Gy + wortamanin group and 10 Gy + Ly294002 group at 4-day post radiation. Scale bars, 100 µm. (C) Morphometric analyses of autophagical puncta in 0, 10 Gy group, 10 Gy + chloroque group, 10 Gy + wortamanin group and 10 Gy + Ly294002 group at 4-day post radiation (n = 6 zebrafishes per group). (D) Morphometric analyses of blood-perfused vessel branches in 0, 10 Gy group, 10 Gy + chloroque group, 10 Gy + wortamanin group and 10 Gy + Ly294002 group at 2-day and 4-day post radiation (n = 6 zebrafishes per group). (E) The survival analysis of zebrafishes in 0, 10 Gy group, 10 Gy + Cloroquine (n = 10, p = 0.0126), 10 Gy + ly294002 (n = 10, p < 0.01) and 10 Gy + Wortamanin (n = 10, p < 0.01). Statistical analysis in C and D was performed using t-test: **P < 0.05, ***P < 0.01. Data represent the mean ± s.e.m.

References

    1. Greene-Schloesser D, Moore E, Robbins ME. Molecular pathways: radiation-induced cognitive impairment. Clin. Cancer Res. 2013;19:2294–2300. doi: 10.1158/1078-0432.CCR-11-2903. - DOI - PMC - PubMed
    1. Greene-Schloesser D, et al. Radiation-induced brain injury: A review. Front. Oncol. 2012;2:73. doi: 10.3389/fonc.2012.00073. - DOI - PMC - PubMed
    1. McTyre E, Scott J, Chinnaiyan P. Whole brain radiotherapy for brain metastasis. Surgical Neurol. Int. 2013;4:S236–244. doi: 10.4103/2152-7806.111301. - DOI - PMC - PubMed
    1. Lippitz B, et al. Stereotactic radiosurgery in the treatment of brain metastases: the current evidence. Cancer Treat. Rev. 2014;40:48–59. doi: 10.1016/j.ctrv.2013.05.002. - DOI - PubMed
    1. Khuntia D, Brown P, Li J, Mehta MP. Whole-brain radiotherapy in the management of brain metastasis. J. Clin. Oncol. 2006;24:1295–1304. doi: 10.1200/JCO.2005.04.6185. - DOI - PubMed

Publication types

MeSH terms