

Mix and Match: Phenotypic Coexistence as a Key Facilitator of Cancer Invasion
- PMID: 31953602
- PMCID: PMC6968991
- DOI: 10.1007/s11538-019-00675-0
Mix and Match: Phenotypic Coexistence as a Key Facilitator of Cancer Invasion
Abstract
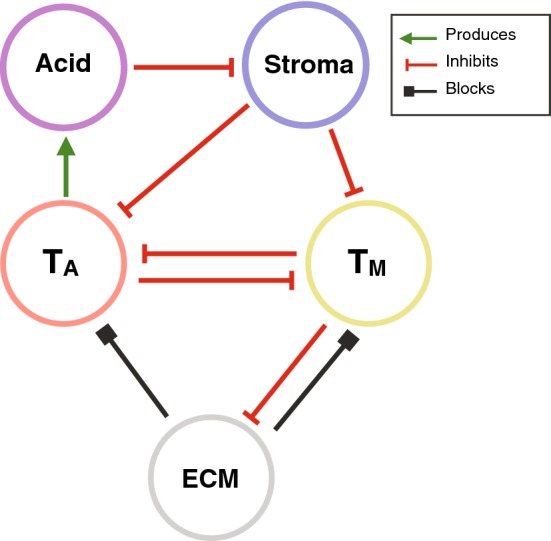
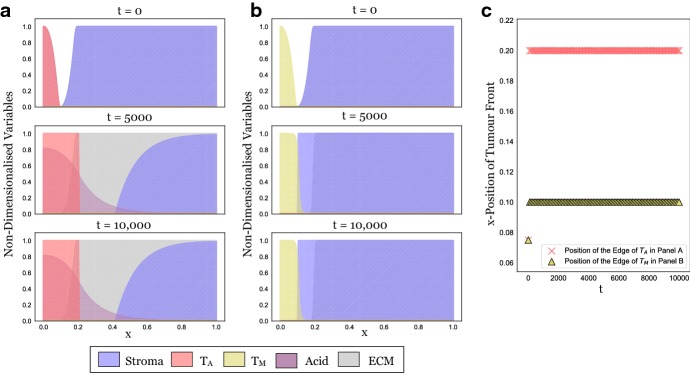
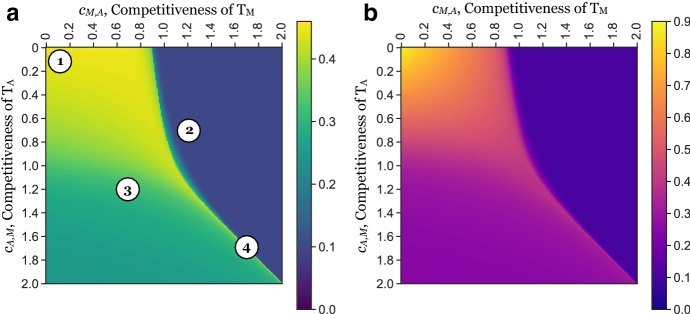
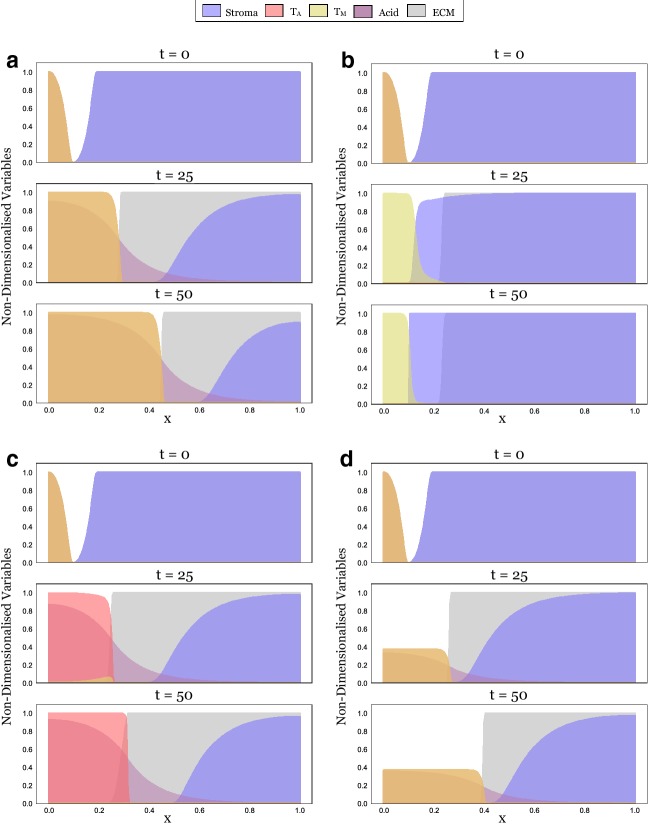
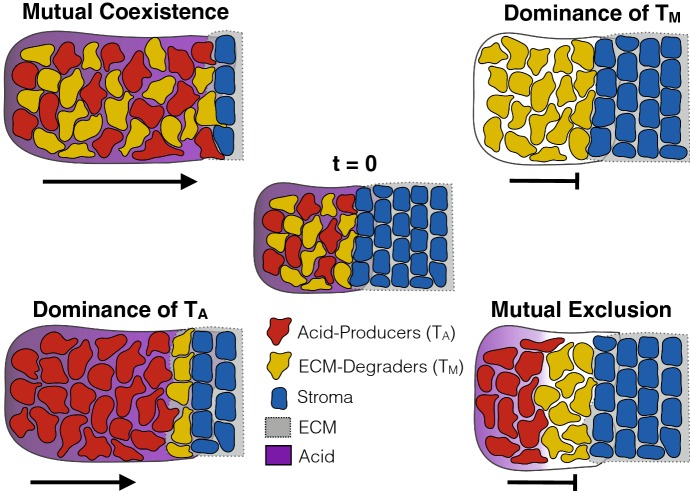
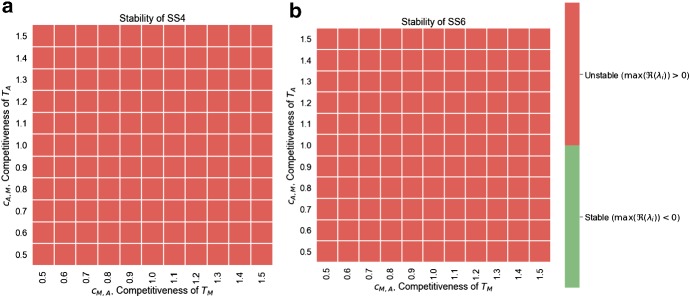
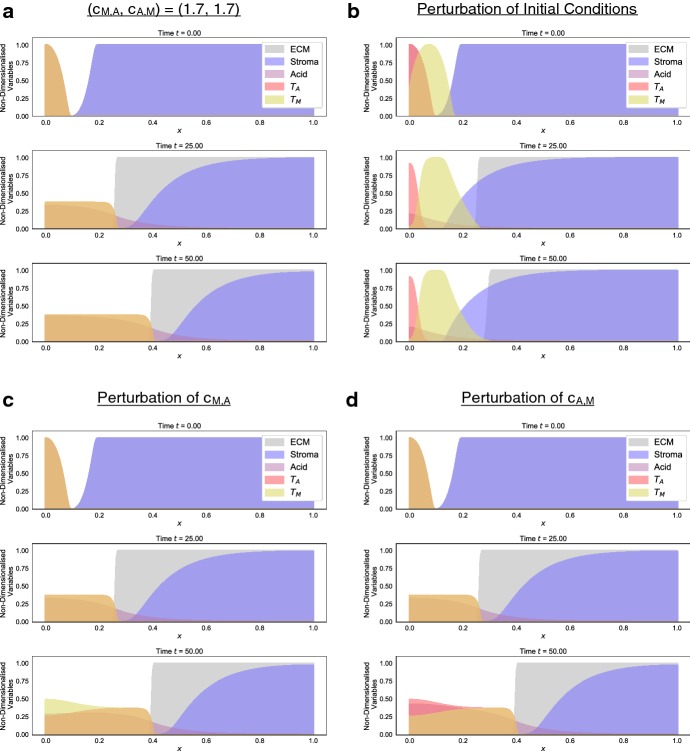
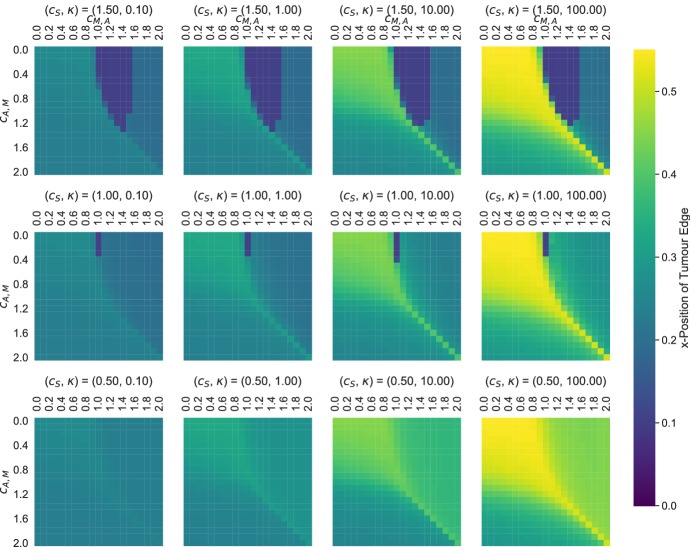
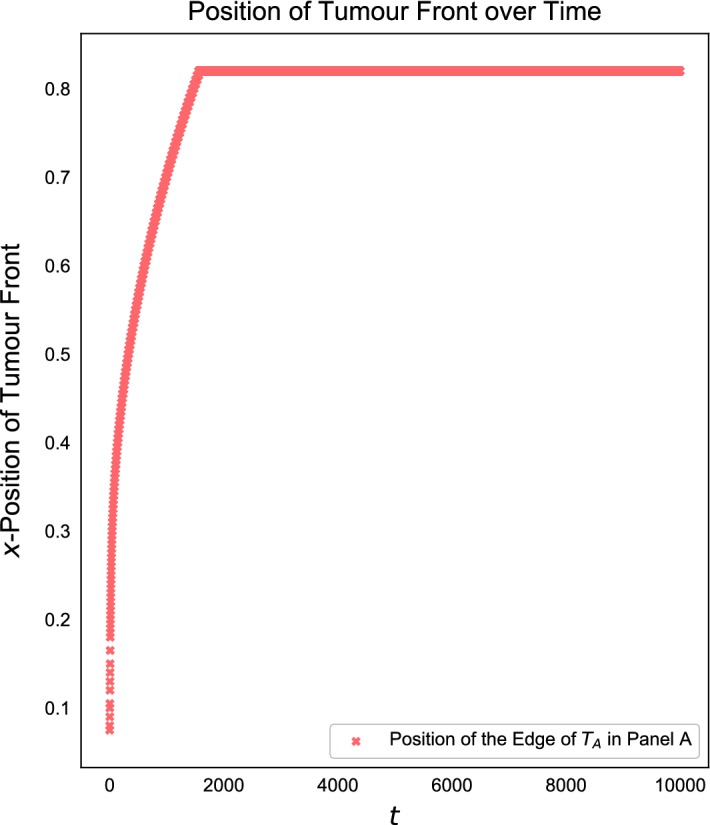
Invasion of healthy tissue is a defining feature of malignant tumours. Traditionally, invasion is thought to be driven by cells that have acquired all the necessary traits to overcome the range of biological and physical defences employed by the body. However, in light of the ever-increasing evidence for geno- and phenotypic intra-tumour heterogeneity, an alternative hypothesis presents itself: could invasion be driven by a collection of cells with distinct traits that together facilitate the invasion process? In this paper, we use a mathematical model to assess the feasibility of this hypothesis in the context of acid-mediated invasion. We assume tumour expansion is obstructed by stroma which inhibits growth and extra-cellular matrix (ECM) which blocks cancer cell movement. Further, we assume that there are two types of cancer cells: (i) a glycolytic phenotype which produces acid that kills stromal cells and (ii) a matrix-degrading phenotype that locally remodels the ECM. We extend the Gatenby-Gawlinski reaction-diffusion model to derive a system of five coupled reaction-diffusion equations to describe the resulting invasion process. We characterise the spatially homogeneous steady states and carry out a simulation study in one spatial dimension to determine how the tumour develops as we vary the strength of competition between the two phenotypes. We find that overall tumour growth is most extensive when both cell types can stably coexist, since this allows the cells to locally mix and benefit most from the combination of traits. In contrast, when inter-species competition exceeds intra-species competition the populations spatially separate and invasion arrests either: (i) rapidly (matrix-degraders dominate) or (ii) slowly (acid-producers dominate). Overall, our work demonstrates that the spatial and ecological relationship between a heterogeneous population of tumour cells is a key factor in determining their ability to cooperate. Specifically, we predict that tumours in which different phenotypes coexist stably are more invasive than tumours in which phenotypes are spatially separated.
Keywords: Coexistence theory; Cooperation; Reaction–diffusion; Travelling waves; Tumour invasion.
Figures
Similar articles
-
Tumour-stromal interactions in acid-mediated invasion: a mathematical model.J Theor Biol. 2010 Dec 7;267(3):461-70. doi: 10.1016/j.jtbi.2010.08.028. Epub 2010 Sep 8. J Theor Biol. 2010. PMID: 20816684 Free PMC article.
-
Cell-Scale Degradation of Peritumoural Extracellular Matrix Fibre Network and Its Role Within Tissue-Scale Cancer Invasion.Bull Math Biol. 2020 May 26;82(6):65. doi: 10.1007/s11538-020-00732-z. Bull Math Biol. 2020. PMID: 32458057 Free PMC article.
-
A Multiscale Mathematical Model of Tumour Invasive Growth.Bull Math Biol. 2017 Mar;79(3):389-429. doi: 10.1007/s11538-016-0237-2. Epub 2017 Feb 16. Bull Math Biol. 2017. PMID: 28210916
-
The matrix environmental and cell mechanical properties regulate cell migration and contribute to the invasive phenotype of cancer cells.Rep Prog Phys. 2019 Jun;82(6):064602. doi: 10.1088/1361-6633/ab1628. Epub 2019 Apr 4. Rep Prog Phys. 2019. PMID: 30947151 Review.
-
Matrix Metalloproteinases Shape the Tumor Microenvironment in Cancer Progression.Int J Mol Sci. 2021 Dec 23;23(1):146. doi: 10.3390/ijms23010146. Int J Mol Sci. 2021. PMID: 35008569 Free PMC article. Review.
Cited by
-
Spatial structure impacts adaptive therapy by shaping intra-tumoral competition.Commun Med (Lond). 2022 Apr 25;2:46. doi: 10.1038/s43856-022-00110-x. eCollection 2022. Commun Med (Lond). 2022. PMID: 35603284 Free PMC article.
-
Deformations of acid-mediated invasive tumors in a model with Allee effect.J Math Biol. 2025 May 5;90(6):55. doi: 10.1007/s00285-025-02209-w. J Math Biol. 2025. PMID: 40323351 Free PMC article.
-
Identifying key questions in the ecology and evolution of cancer.Evol Appl. 2021 Feb 8;14(4):877-892. doi: 10.1111/eva.13190. eCollection 2021 Apr. Evol Appl. 2021. PMID: 33897809 Free PMC article.
-
A Continuum Mathematical Model of Substrate-Mediated Tissue Growth.Bull Math Biol. 2022 Mar 2;84(4):49. doi: 10.1007/s11538-022-01005-7. Bull Math Biol. 2022. PMID: 35237899 Free PMC article.
-
Pattern Formation as a Resilience Mechanism in Cancer Immunotherapy.Bull Math Biol. 2025 Jul 1;87(8):106. doi: 10.1007/s11538-025-01485-3. Bull Math Biol. 2025. PMID: 40591070 Free PMC article.
References
-
- Andasari V, Gerisch A, Lolas G, South AP, Chaplain MAJ. Mathematical modeling of cancer cell invasion of tissue: biological insight from mathematical analysis and computational simulation. J Math Biol. 2011;63(1):141–171. - PubMed
-
- Anderson ARA, Maini PK. Mathematical oncology. Bull Math Biol. 2018;80(5):945–953. - PubMed
-
- Anderson ARA, Chaplain MAJ, Newman LE, Steele RJC, Thompson AM. Mathematical modelling of tumour invasion and metastasis. Comput Math Methods Med. 2000;2(2):129–154.
-
- Araujo RP, McElwain DLS. A history of the study of solid tumour growth: the contribution of mathematical modelling. Bull Math Biol. 2004;66(5):1039–1091. - PubMed
Publication types
MeSH terms
Substances
Grants and funding
LinkOut - more resources
Full Text Sources
