. 2020 Mar 18;105(6):1036-1047.e5.
doi: 10.1016/j.neuron.2019.12.026. Epub 2020 Jan 15.

Dopamine-Evoked Synaptic Regulation in the Nucleus Accumbens Requires Astrocyte Activity

Affiliations

Dopamine-Evoked Synaptic Regulation in the Nucleus Accumbens Requires Astrocyte Activity

Michelle Corkrum et al. Neuron. .

Abstract

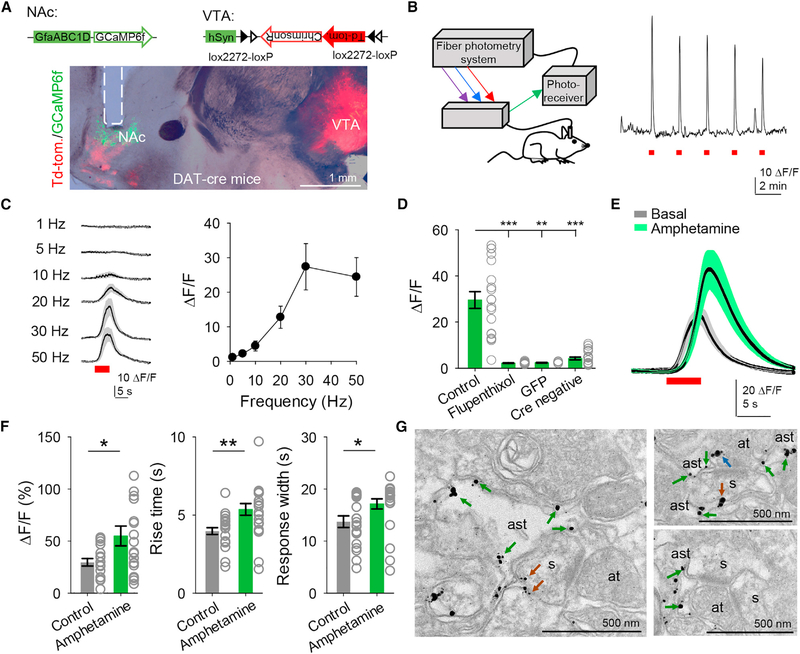
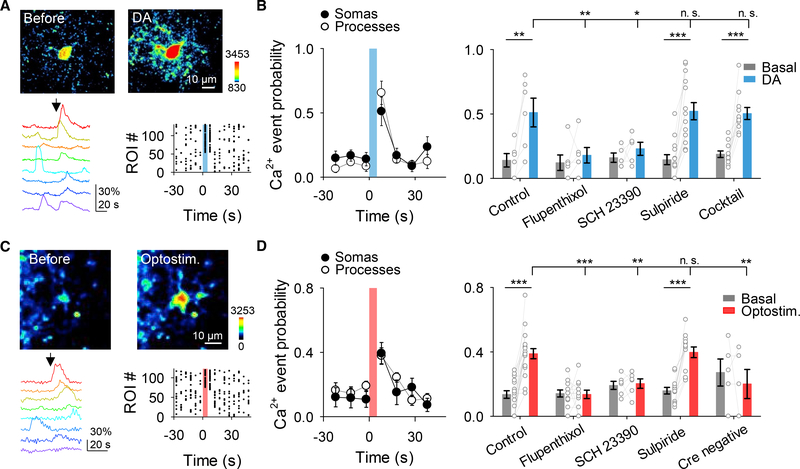
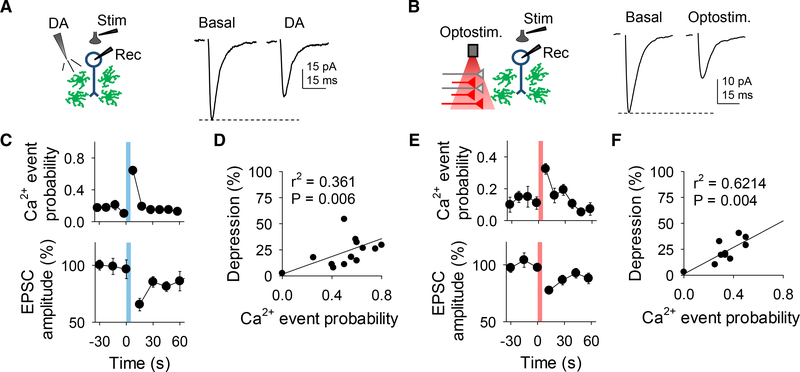
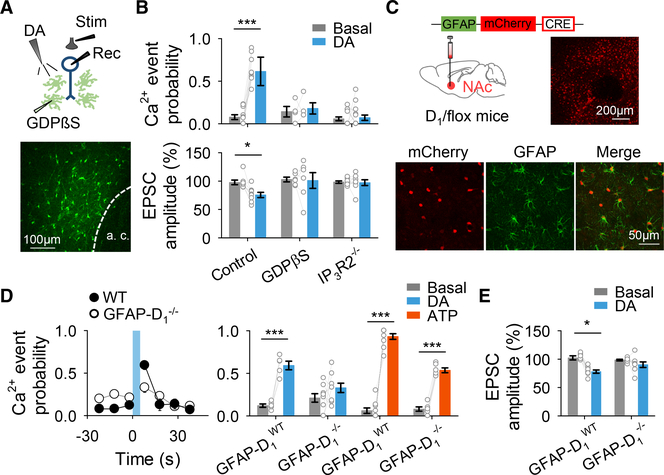
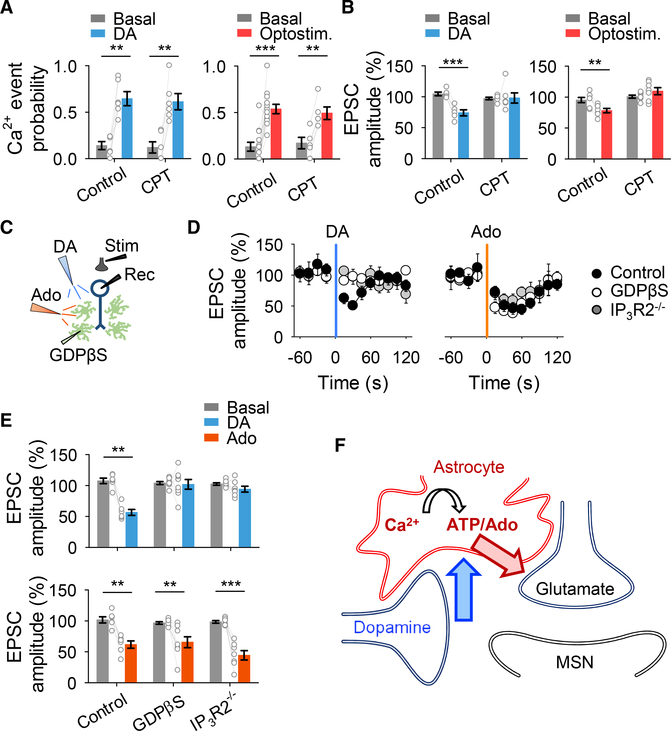
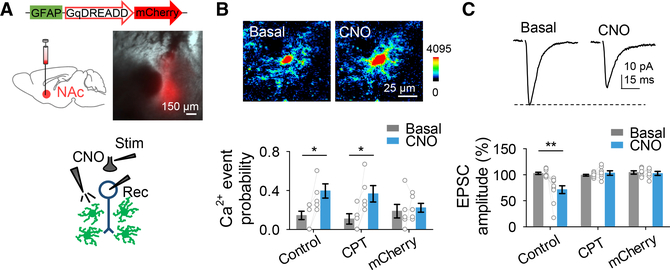
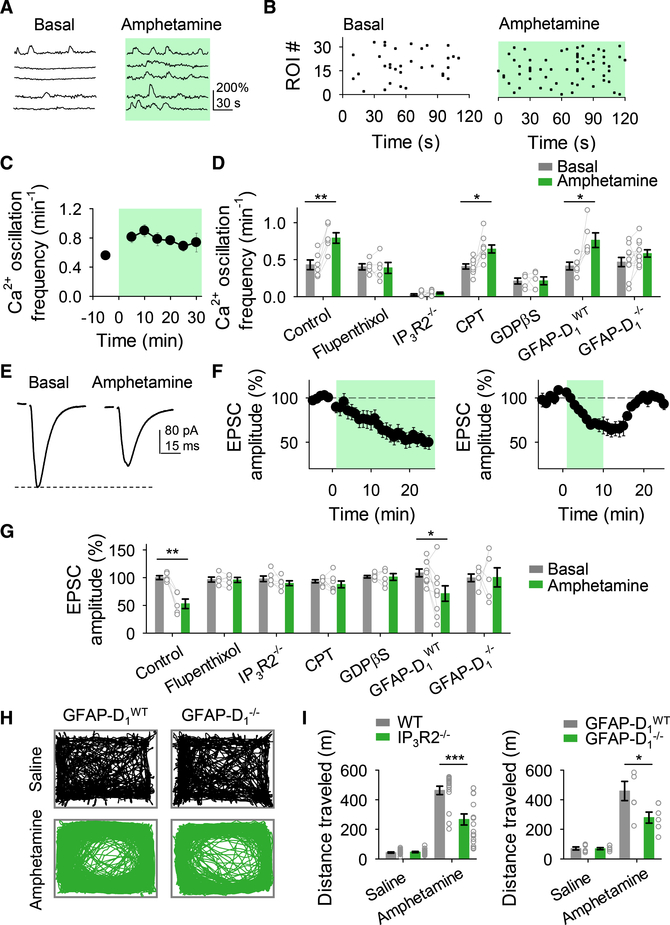
Dopamine is involved in physiological processes like learning and memory, motor control and reward, and pathological conditions such as Parkinson's disease and addiction. In contrast to the extensive studies on neurons, astrocyte involvement in dopaminergic signaling remains largely unknown. Using transgenic mice, optogenetics, and pharmacogenetics, we studied the role of astrocytes on the dopaminergic system. We show that in freely behaving mice, astrocytes in the nucleus accumbens (NAc), a key reward center in the brain, respond with Ca2+ elevations to synaptically released dopamine, a phenomenon enhanced by amphetamine. In brain slices, synaptically released dopamine increases astrocyte Ca2+, stimulates ATP/adenosine release, and depresses excitatory synaptic transmission through activation of presynaptic A1 receptors. Amphetamine depresses neurotransmission through stimulation of astrocytes and the consequent A1 receptor activation. Furthermore, astrocytes modulate the acute behavioral psychomotor effects of amphetamine. Therefore, astrocytes mediate the dopamine- and amphetamine-induced synaptic regulation, revealing a novel cellular pathway in the brain reward system.

Keywords: amphetamine; astrocytes; brain reward system; calcium imaging; dopamine; nucleus accumbens; synaptic transmission.


Conflict of interest statement

Declaration of Interests The authors declare no competing financial interests.

Figures

Figure 1.
Figure 1.. Astrocytes Respond to Dopamine In Vivo
A) Viral vectors used and image from DAT-Cre mice showing expression of ChrimsonR in the VTA and expression of GCaMP6f and the optic fiber track (dotted line) in the NAc. NAc, nucleus accumbens; VTA, ventral tegmental area. (B) Scheme showing the fiber photometry system (left) and astrocyte responses to ChrimsonR activation (5 s, 30 Hz) in the NAc (right). (C) Mean astrocyte responses to distinct stimulation frequencies. (D) Mean fluorescence amplitude in response to ChrimsonR activation in the different experimental conditions (n = 19 stimuli from 5 animals for control, n = 14 stimuli from 2 animals for flupenthixol, n = 6 stimuli from 2 animals for GFP, and n = 23 stimuli from 4 animals for Cre negative). Kruskal-Wallis one-way ANOVA. (E) Mean astrocyte responses to ChrimsonR activation before and after amphetamine administration. (F) Mean fluorescence amplitude, response rise time, and width before and after amphetamine administration (n = 19 responses from 5 animals). Two-tailed Student’s unpaired t test. (G) Electron microscopy images showing D1 receptors in astrocytes (green arrows), spines (brown arrows), and axon terminals (blue arrows). ast, astrocyte; s, spine; at, axon terminal. Data are expressed as mean ± SEM, *p < 0.05, **p < 0.01.
Figure 2.
Figure 2.. Astrocytes Respond to Dopamine through D1 Receptors
A) Pseudocolor images showing the fluorescence intensities of GCaMP3-expressing astrocytes before and after dopamine (DA) application (top), representative Ca2+ traces of astrocytes (bottom left; arrow indicates DA application), and raster plot showing the Ca2+ events recorded from all ROIs including astrocyte somas and processes (bottom right). (B) Ca2+ event probability over time in somas and processes (left) and Ca2+ event probability before (basal) and after DA application in different experimental conditions (right). All experimental conditions were performed in TTX (1 μM). Cocktail of neurotransmitter receptor antagonists contained: CNQX (20 μM), AP5 (50 μM), MPEP (50 μM), LY367385 (100 μM), picrotoxin (50 μM), CGP5462 (1 μM), atropine (50 μM), CPT (10 μM), and suramin (100 μM). One-way ANOVA and two-tailed Student’s paired t test. (C and D) Same as (A) and (B) but using opto-stimulation of dopaminergic axons instead of DA application. Experiments were performed in CNQX (20 μM), AP5 (50 μM), MPEP (50 mM), LY367385 (100 μM), picrotoxin (50 μM), CGP5462 (1 μM), atropine (50 μM), CPT (10 μM), and suramin (100 μM). One-way ANOVA and two-tailed Student’s paired t test. Blue and red shadows indicate DA application and optical stimulation, respectively. Data are expressed as mean ± SEM, *p < 0.05, **p < 0.01, ***p < 0.001.
Figure 3.
Figure 3.. Dopamine Stimulates Astrocyte Ca2+ Increases and Neuronal Excitatory Transmission Depression
(A) Scheme of the experimental approach (left) and representative EPSC traces before (basal) and after DA application (right). (B) As in (A) but for optical stimulation. (C) Ca2+ event probability and relative EPSC amplitude over time. (D) Relationship between Ca2+ event probability and change in EPSC amplitude after DA application. (E and F) The same as (C) and (D) but for optical stimulation. Blue and red shadows indicate DA application and optical stimulation, respectively. Data are expressed as mean ± SEM.
Figure 4.
Figure 4.. Astrocyte Ca2+ Is Necessary for DA-Evoked Synaptic Depression
(A) Scheme of the experimental approach (top) and fluorescence image of an astrocyte network loaded with biocytin through a patched astrocyte (bottom). (B) Ca2+ event probability and relative EPSC amplitude before (basal) and after DA application. Two-tailed Student’s paired t test. (C) Viral vector injected into the NAc of D1-flox mice and fluorescence image showing mCherry-Cre expression in the NAc (top), and immunohisto-chemistry images showing co-localization between mCherry-cre and GFAP (bottom). (D) Ca2+ event probability over time (left) and Ca2+ event probability before (basal) and after DA or ATP application (right). Blue shadow indicates DA application. Two-tailed Student’s paired t test. (E) Relative EPSC amplitude before (basal) and after DA application. Two-tailed Student’s paired t test. Data are expressed as mean ± SEM, *p < 0.05, ***p < 0.001.
Figure 5.
Figure 5.. Astrocytes Mediate DA-Evoked Synaptic Depression via Adenosine Signaling
(A) Ca2+ event probability before (basal) and after DA application or opto-stimulation. Two-tailed Student’s paired t test. (B) Relative EPSC amplitude before (basal) and after DA application or opto-stimulation. Two-tailed Student’s paired t test. (C) Scheme of experimental approach. (D) Relative EPSC amplitude over time. Blue and orange shadows indicate DA application and adenosine application, respectively. (E) Relative EPSC amplitude before (basal) and after DA application or adenosine application. Two-tailed Student’s paired t test. (F) Schematic summary depicting the signaling pathways involved in DA-evoked synaptic depression. Data are expressed as mean ± SEM, **p < 0.01, ***p < 0.001.
Figure 6.
Figure 6.. Astrocyte Ca2+ Is Sufficient for Excitatory Synaptic Depression
(A) Viral vector injected into the NAc and fluorescence image showing DREADD-mCherry expression in the NAc (top). Scheme of the experimental approach appears at bottom. (B) Pseudocolor images showing the fluorescence intensities of GCaMP6f-expressing astrocytes before and after CNO application (top) and Ca2+ event probability before (basal) and after CNO application (bottom). Two-tailed Student’s paired t test. (C) Representative EPSC traces before (basal) and after CNO application (top) and relative EPSC amplitude before (basal) and after CNO application (bottom). Two-tailed Student’s paired t test. Data are expressed as mean ± SEM, *p<0.05, **p< 0.01.
Figure 7.
Figure 7.. Astrocytes Are Involved in Amphetamine Synaptic Effects
(A) Representative Ca2+ traces of astrocytes in control (basal) and in the presence of amphetamine. (B) Raster plots showing the Ca2+ events recorded from all ROIs including astrocyte somas and processes in control (basal) and in the presence of amphetamine. (C) Ca2+ oscillation frequency over time. (D) Ca2+ oscillation frequency in control (basal) and in the presence of amphetamine. Two-tailed Student’s paired t test. (E) Representative EPSC traces before (basal) and after amphetamine application. (F) Relative EPSC amplitude over time. (G) Relative EPSC amplitude before (basal) and in the presence of amphetamine. Two-tailed Student’s paired t test. (H) Representative traces of locomotor activity of mice injected with saline or amphetamine. (I) Distances traveled by different mice injected with saline or amphetamine (for IP3R2−/− mice: n = 18; n = 8 males and n = 10 females; for IP3R2−/− control wild-type mice: n = 16; n = 5 males and n = 11 females; for GFAP-D1−/− mice: n = 6; n = 3 males and n = 3 females; for GFAP-D1WT mice: n = 6; n = 3 males and n = 3 females). Two-tailed Student’s unpaired t test. Green shadow indicates amphetamine application. Data are expressed as mean ± SEM, *p < 0.05, **p < 0.01, ***p < 0.001.

Comment in

References

    1. Araque A, Parpura V, Sanzgiri RP, and Haydon PG (1999). Tripartite synapses: glia, the unacknowledged partner. Trends Neurosci. 22, 208–215. - PubMed
    1. Araque A, Carmignoto G, and Haydon PG (2001). Dynamic signaling between astrocytes and neurons. Annu. Rev. Physiol 63, 795–813. - PubMed
    1. Araque A, Carmignoto G, Haydon PG, Oliet SH, Robitaille R, and Volterra A (2014). Gliotransmitters travel in time and space. Neuron 81, 728–739. - PMC - PubMed
    1. Bamford NS, Zhang H, Joyce JA, Scarlis CA, Hanan W, Wu NP, André VM, Cohen R, Cepeda C, Levine MS, et al. (2008). Repeated exposure to methamphetamine causes long-lasting presynaptic corticostriatal depression that is renormalized with drug readministration. Neuron 58, 89–103. - PMC - PubMed
    1. Beaulieu JM, and Gainetdinov RR (2011). The physiology, signaling, and pharmacology of dopamine receptors. Pharmacol. Rev 63, 182–217. - PubMed

Publication types

MeSH terms