. 2020 Apr;14(4):896-913.
doi: 10.1002/1878-0261.12639. Epub 2020 Jan 29.

Metabolism-associated molecular classification of hepatocellular carcinoma

Affiliations

Metabolism-associated molecular classification of hepatocellular carcinoma

Chen Yang et al. Mol Oncol. 2020 Apr.

Abstract

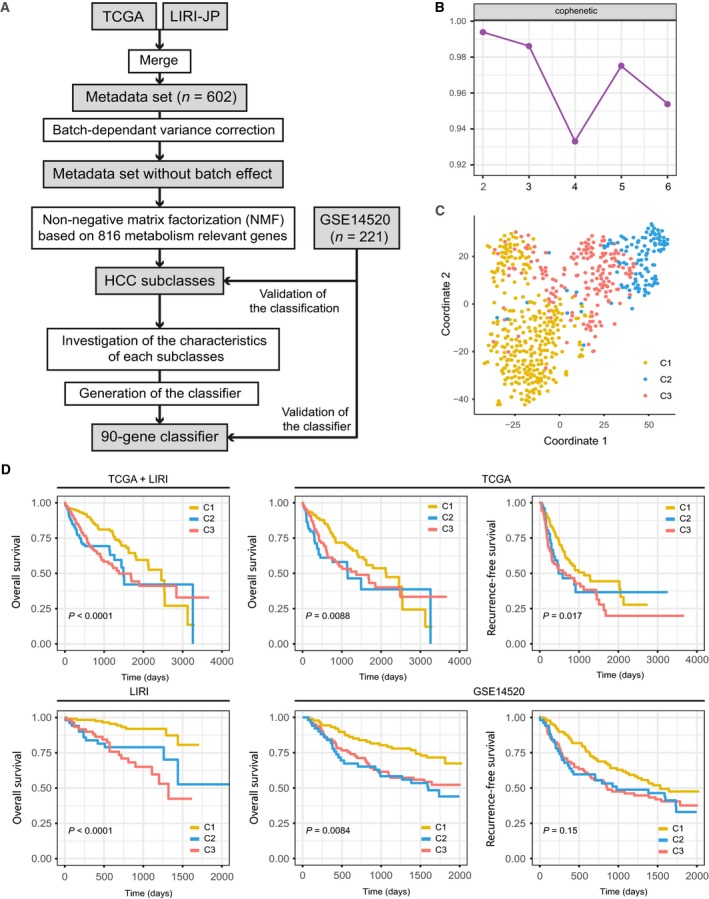
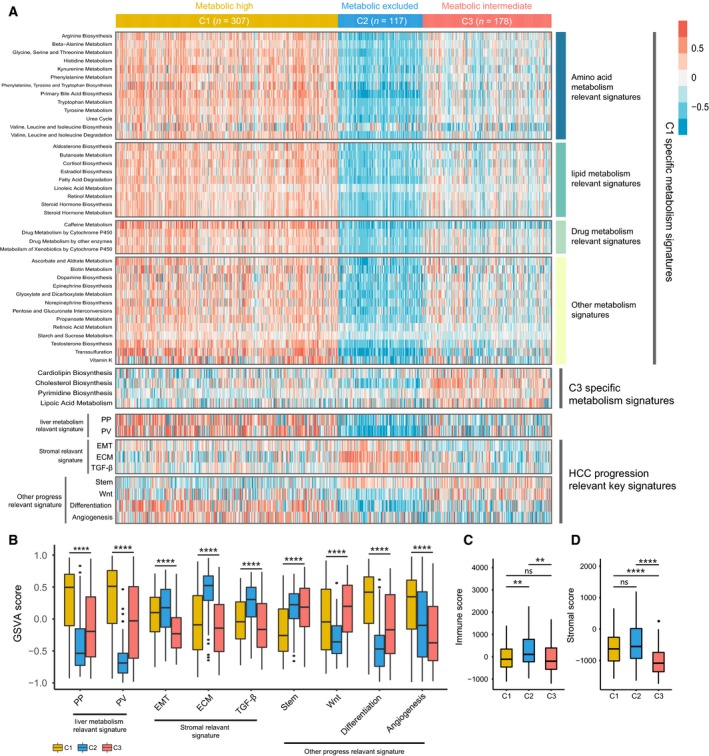
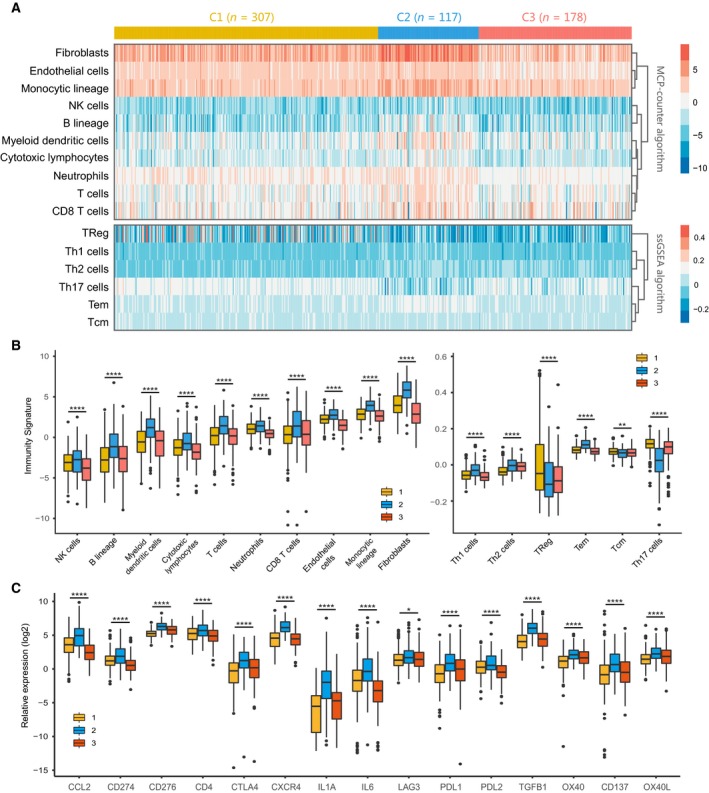
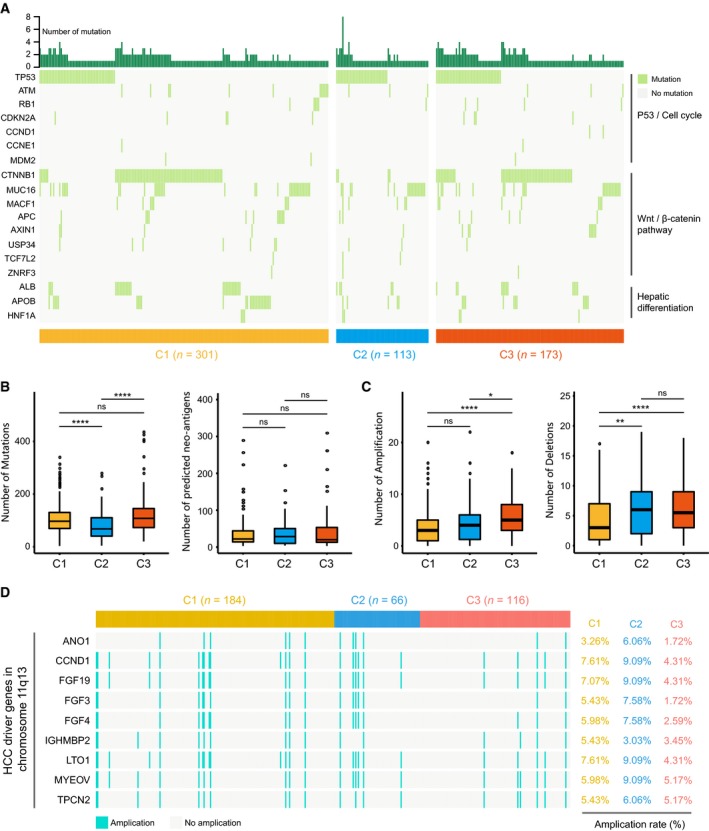
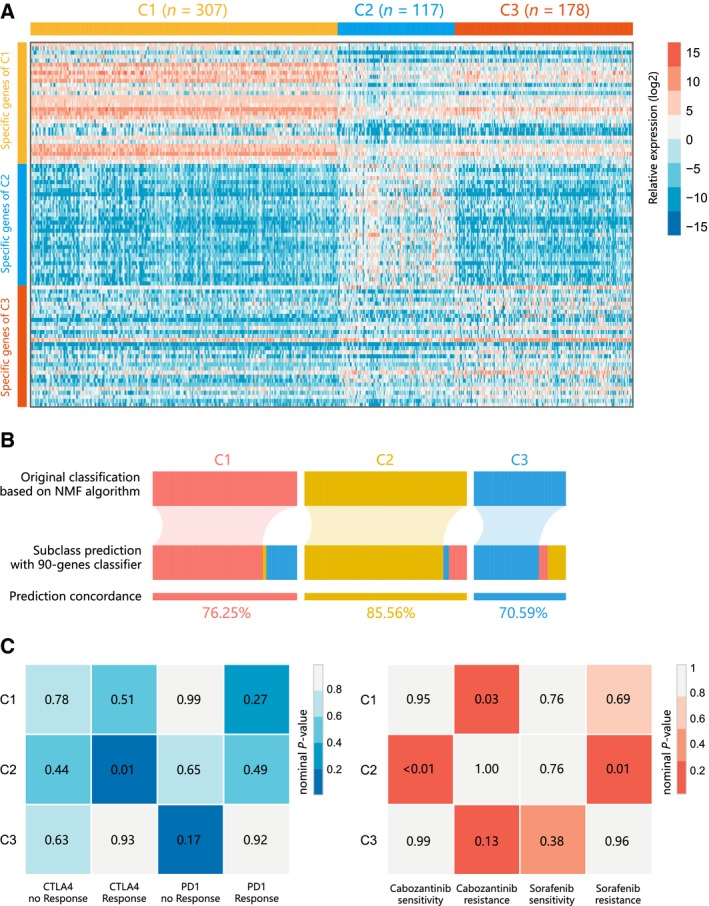
Hepatocellular carcinoma (HCC) is a disease with unique management complexity because it displays high heterogeneity of molecular phenotypes. We herein aimed to characterize the molecular features of HCC by the development of a classification system that was based on the gene expression profile of metabolic genes. Integrative analysis was performed with a metadata set featuring 371 and 231 HCC human samples from the Cancer Genome Atlas and the International Cancer Genome Consortium, respectively. All samples were linked with clinical information. RNA sequencing data of 2752 previously characterized metabolism-related genes were used for non-negative matrix factorization clustering, and three subclasses of HCC (C1, C2, and C3) were identified. We then analyzed the metadata set for metabolic signatures, prognostic value, transcriptome features, immune infiltration, clinical characteristics, and drug sensitivity of subclasses, and compared the resulting subclasses with previously published classifications. Subclass C1 displayed high metabolic activity, low α-fetoprotein (AFP) expression, and good prognosis. Subclass C2 was associated with low metabolic activities and displayed high expression of immune checkpoint genes, demonstrating drug sensitivity toward cytotoxic T-lymphocyte-associated protein-4 inhibitors and the receptor tyrosine kinase inhibitor cabozantinib. Subclass C3 displayed intermediate metabolic activity, high AFP expression level, and bad prognosis. Finally, a 90-gene classifier was generated to enable HCC classification. This study establishes a new HCC classification based on the gene expression profiles of metabolic genes, thereby furthering the understanding of the genetic diversity of human HCC.

Keywords: classification; hepatocellular carcinoma; immune signatures; metabolic genes.


Conflict of interest statement

The authors declare no conflict of interest.

Figures

Figure 1
Figure 1
Identification of HCC subclasses using NMF consensus clustering in the metadata set. (A) Flow chart of the study. (B) NMF clustering using 816 metabolism‐associated genes. Cophenetic correlation coefficient for k = 2–5 is shown. (C) t‐SNE analysis supported the stratification into three HCC subclasses. (D). OS and RFS of three subclasses (C1, C2, and C3) in metadata set, independent TCGA or ICGC cohort, and http://www.ncbi.nlm.nih.gov/geo/query/acc.cgi?acc=GSE14520 cohort. The statistical significance of differences was determined by log‐rank test.
Figure 2
Figure 2
Association between metabolism and progression‐associated signatures and the HCC subclasses. (A) Heatmap of the specific metabolism‐associated signatures. (B) Boxplot of the signature score for HCC progression‐associated signatures distinguished by different subclasses. Boxplot of immune score (C) and stromal score (D) from ESTIMATE of three subclasses. For boxplots, the line within the boxes represents the median value, and the bottom and top of the boxes are the 25th and 75th percentiles (interquartile range), and the vertical line represents 1.5 times the interquartile range. The statistical difference was compared through the Kruskal–Wallis test, and the P values are labeled above each boxplot with asterisks (ns represents no significance, **P < 0.01, ****P < 0.0001).
Figure 3
Figure 3
Immune characteristics of three subclasses in the metadata set. (A) Heatmap describing the abundance of immune and stromal cell populations in C1, C2, and C3. (B) Boxplot of the abundance of immune and stromal cell populations distinguished by different subclasses. (C) Expression level (normalized count) of 15 immune checkpoint genes in three HCC subclasses. The statistical difference was compared through the Kruskal–Wallis test, and the P values are labeled above each boxplot with asterisks (ns represents no significance, *P < 0.05, **P < 0.01, ****P < 0.0001).
Figure 4
Figure 4
Clinical characteristics of HCC subclasses in the TCGA and http://www.ncbi.nlm.nih.gov/geo/query/acc.cgi?acc=GSE14520 cohort. (A) Correlation of our classification (C1, C2, and C3) with clinical characteristics and previous HCC subclasses in the TCGA cohort. (B) Correlation of our classification with clinical characteristics and previous HCC subclasses in http://www.ncbi.nlm.nih.gov/geo/query/acc.cgi?acc=GSE14520 cohort.
Figure 5
Figure 5
Association between HCC subclasses and mutations, neoantigens, and copy number aberrations. (A) Oncoprint of mutation status of genes in P53/cell cycle pathway, Wnt/β‐catenin pathway, and hepatic differentiation (see detailed statistical analysis in Table S9). The number of mutations, predicted neoantigens (B), and copy number aberrations (C) in HCC subclasses. Statistical difference was compared through Wilcoxon rank‐sum test (ns represents no significance, *P < 0.05, **P < 0.01, ****P < 0.0001). (D) Amplification rate of HCC driver genes on chromosome 11q13 in HCC subclasses.
Figure 6
Figure 6
Identification of predictive classifier and putative targeted therapeutic and immunotherapeutic response. (A) Heatmap of the expression level of the 90‐gene classifier. (B) Concordance of HCC molecular subclass prediction between the 90‐gene classifier and original prediction based on NMF. (C) C2 may be more sensitive to the CTLA‐4 inhibitor (nominal P = 0.01) and cabozantinib (nominal P < 0.01) by SubMap analysis.

References

    1. Barbie DA, Tamayo P, Boehm JS, Kim SY, Moody SE, Dunn IF, Schinzel AC, Sandy P, Meylan E, Scholl C et al (2009) Systematic RNA interference reveals that oncogenic KRAS‐driven cancers require TBK1. Nature 462, 108–112. - PMC - PubMed
    1. Becht E, Giraldo NA, Lacroix L, Buttard B, Elarouci N, Petitprez F, Selves J, Laurent‐Puig P, Sautes‐Fridman C, Fridman WH et al (2016) Estimating the population abundance of tissue‐infiltrating immune and stromal cell populations using gene expression. Genome Biol 17, 218. - PMC - PubMed
    1. Boroughs LK and DeBerardinis RJ (2015) Metabolic pathways promoting cancer cell survival and growth. Nat Cell Biol 17, 351–359. - PMC - PubMed
    1. Boyault S, Rickman DS, de Reynies A, Balabaud C, Rebouissou S, Jeannot E, Herault A, Saric J, Belghiti J, Franco D et al (2007) Transcriptome classification of HCC is related to gene alterations and to new therapeutic targets. Hepatology (Baltimore, MD) 45, 42–52. - PubMed
    1. Brunet JP, Tamayo P, Golub TR and Mesirov JP (2004) Metagenes and molecular pattern discovery using matrix factorization. Proc Natl Acad Sci USA 101, 4164–4169. - PMC - PubMed