. 2020 Jan 23;180(2):373-386.e15.
doi: 10.1016/j.cell.2019.12.029. Epub 2020 Jan 16.

Cell-Surface Proteomic Profiling in the Fly Brain Uncovers Wiring Regulators

Affiliations

Cell-Surface Proteomic Profiling in the Fly Brain Uncovers Wiring Regulators

Jiefu Li et al. Cell. .

Abstract

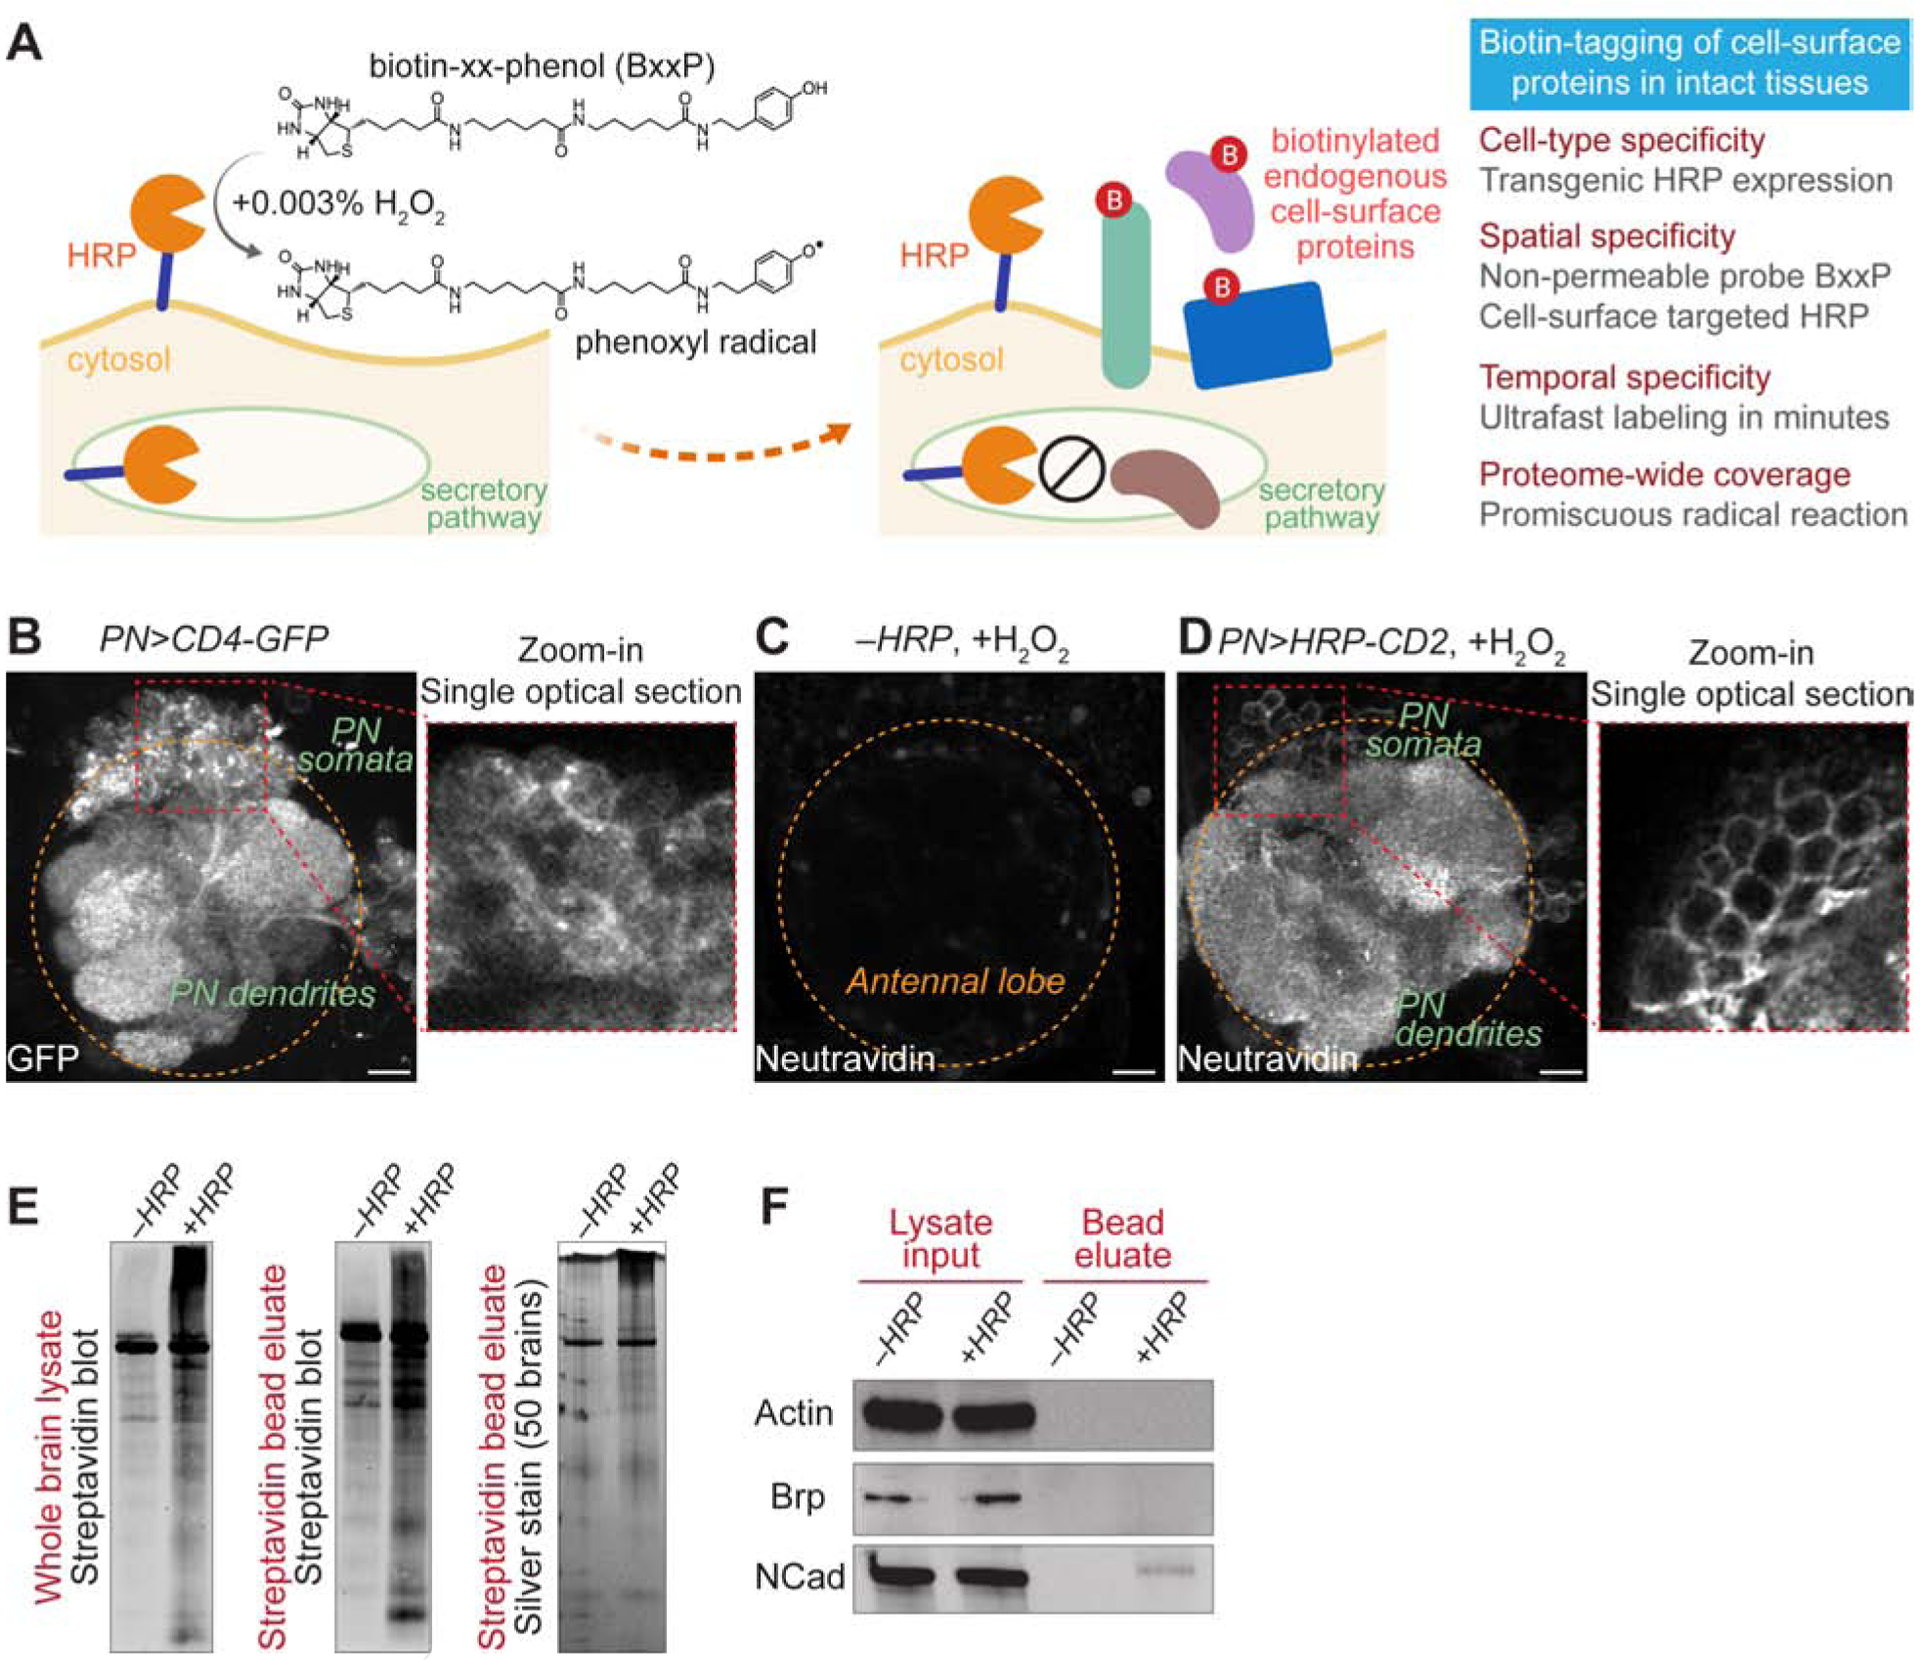
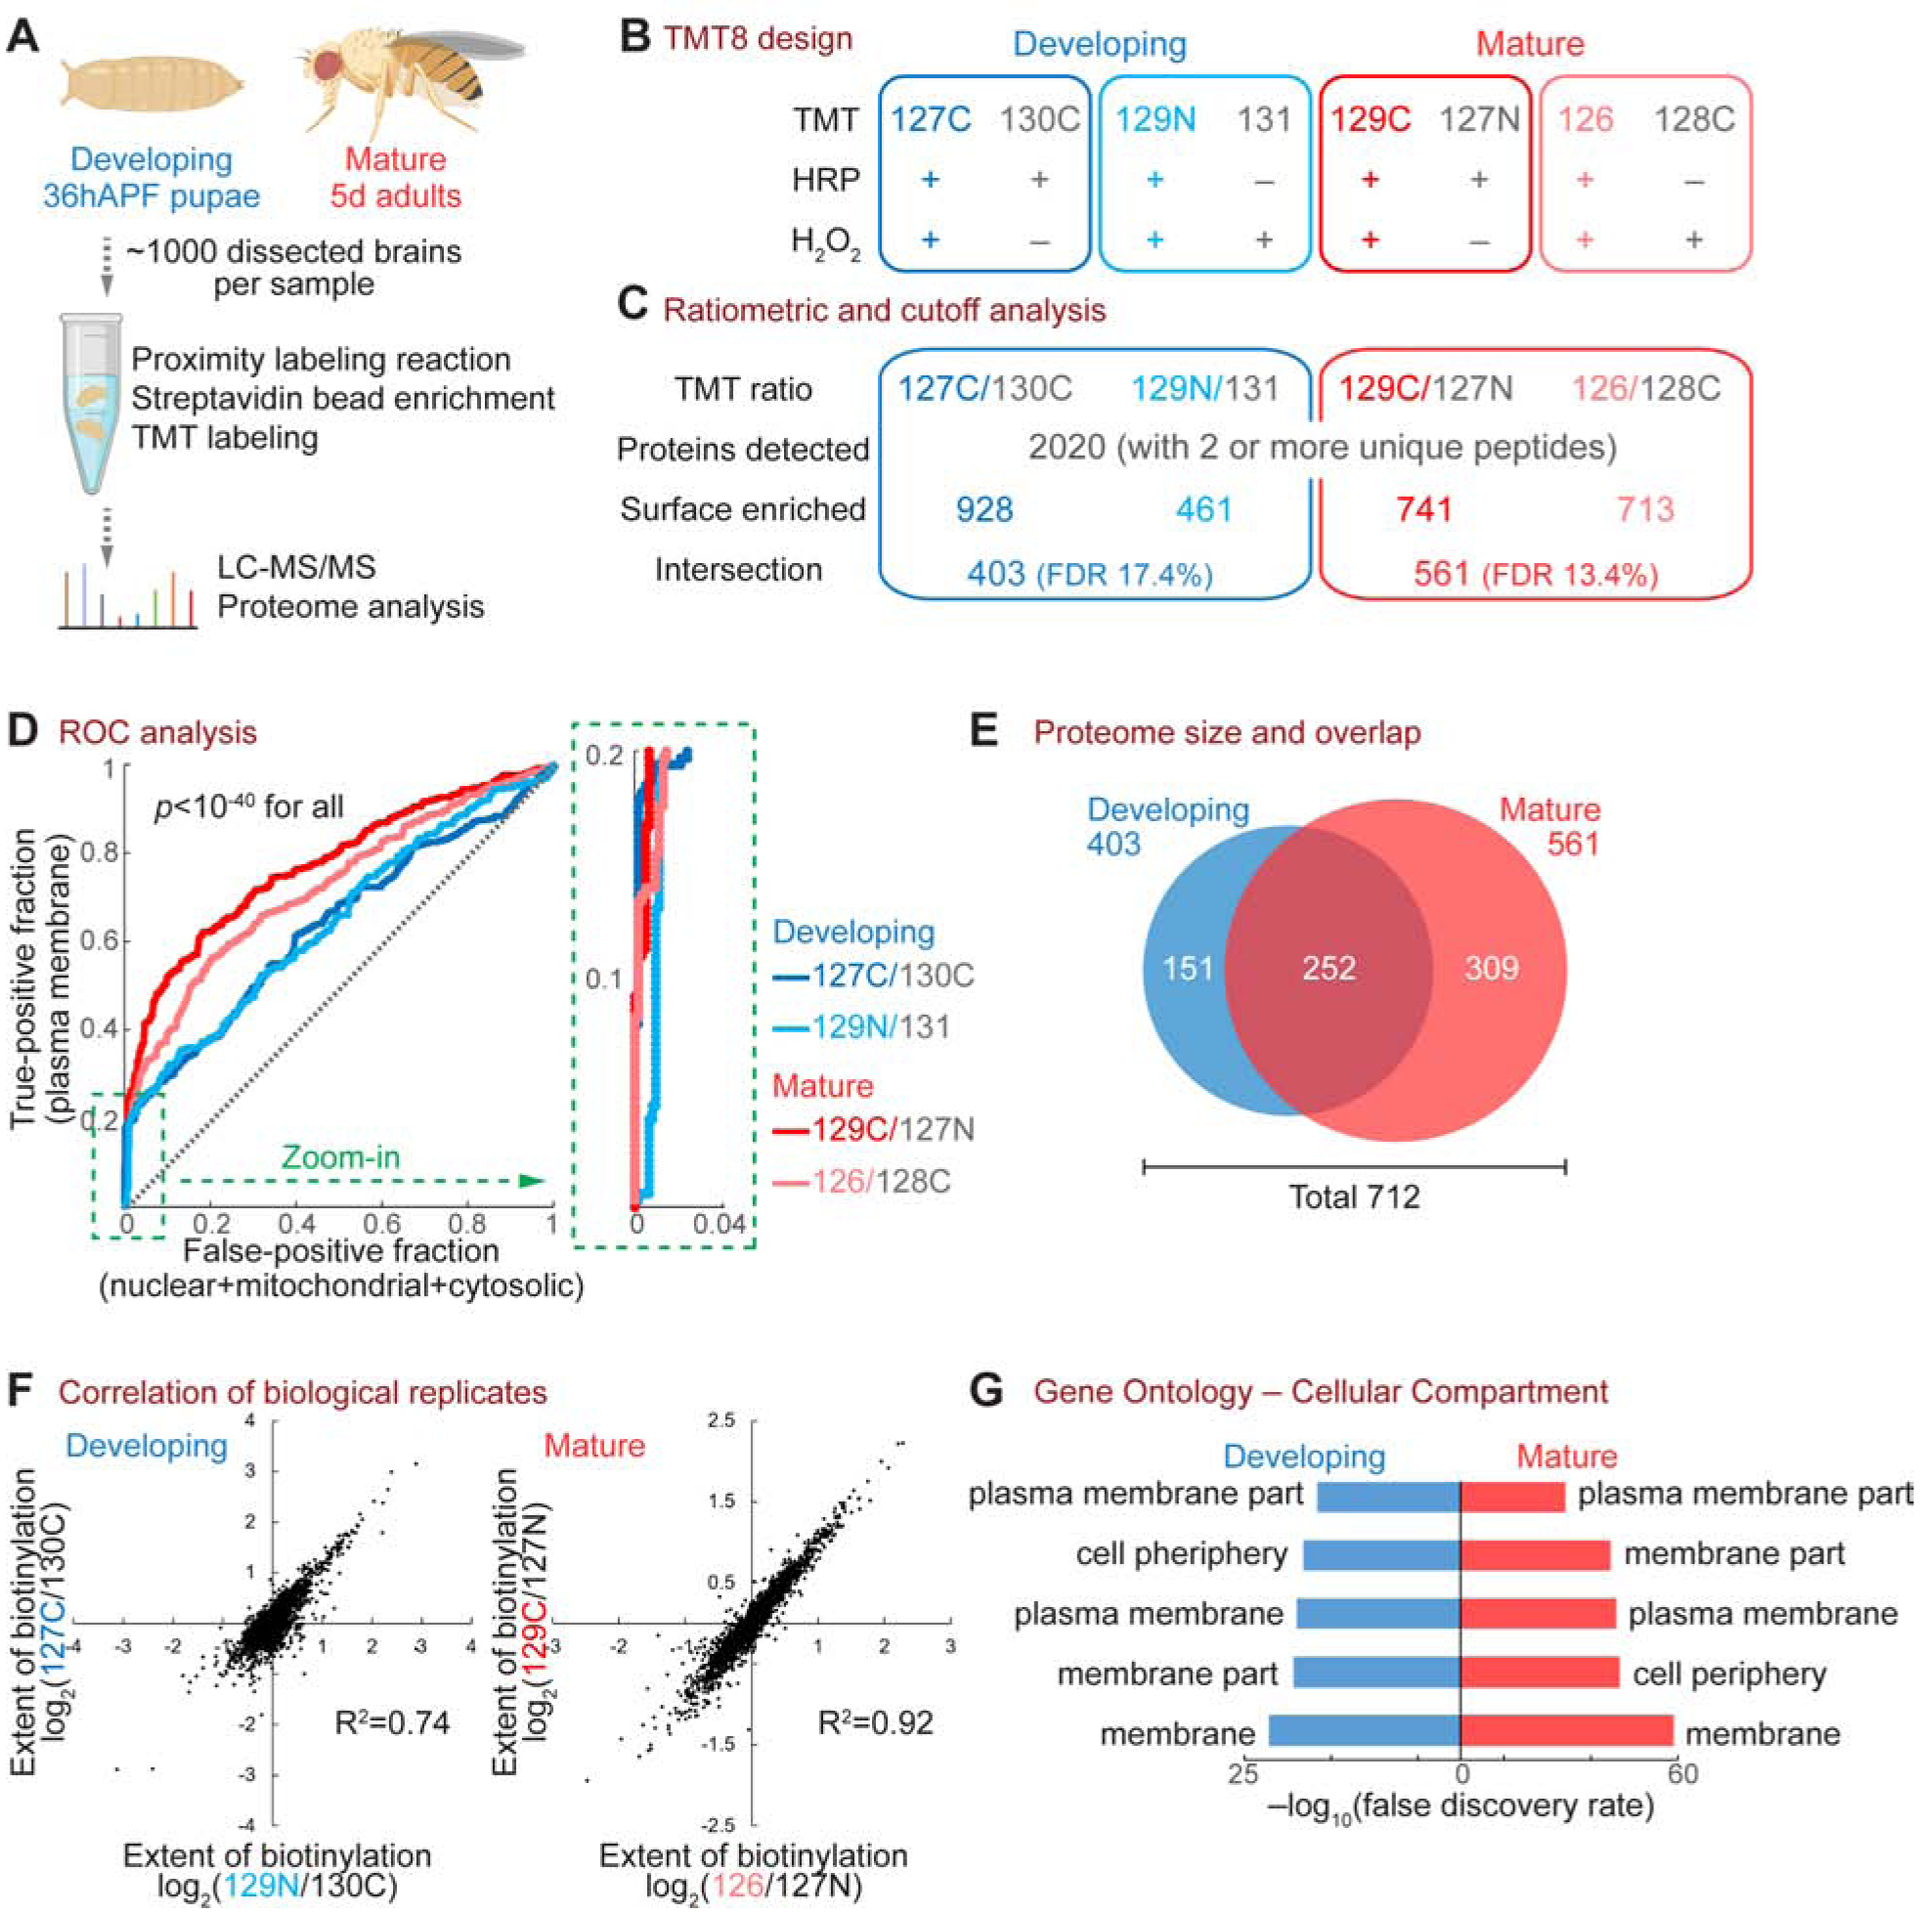
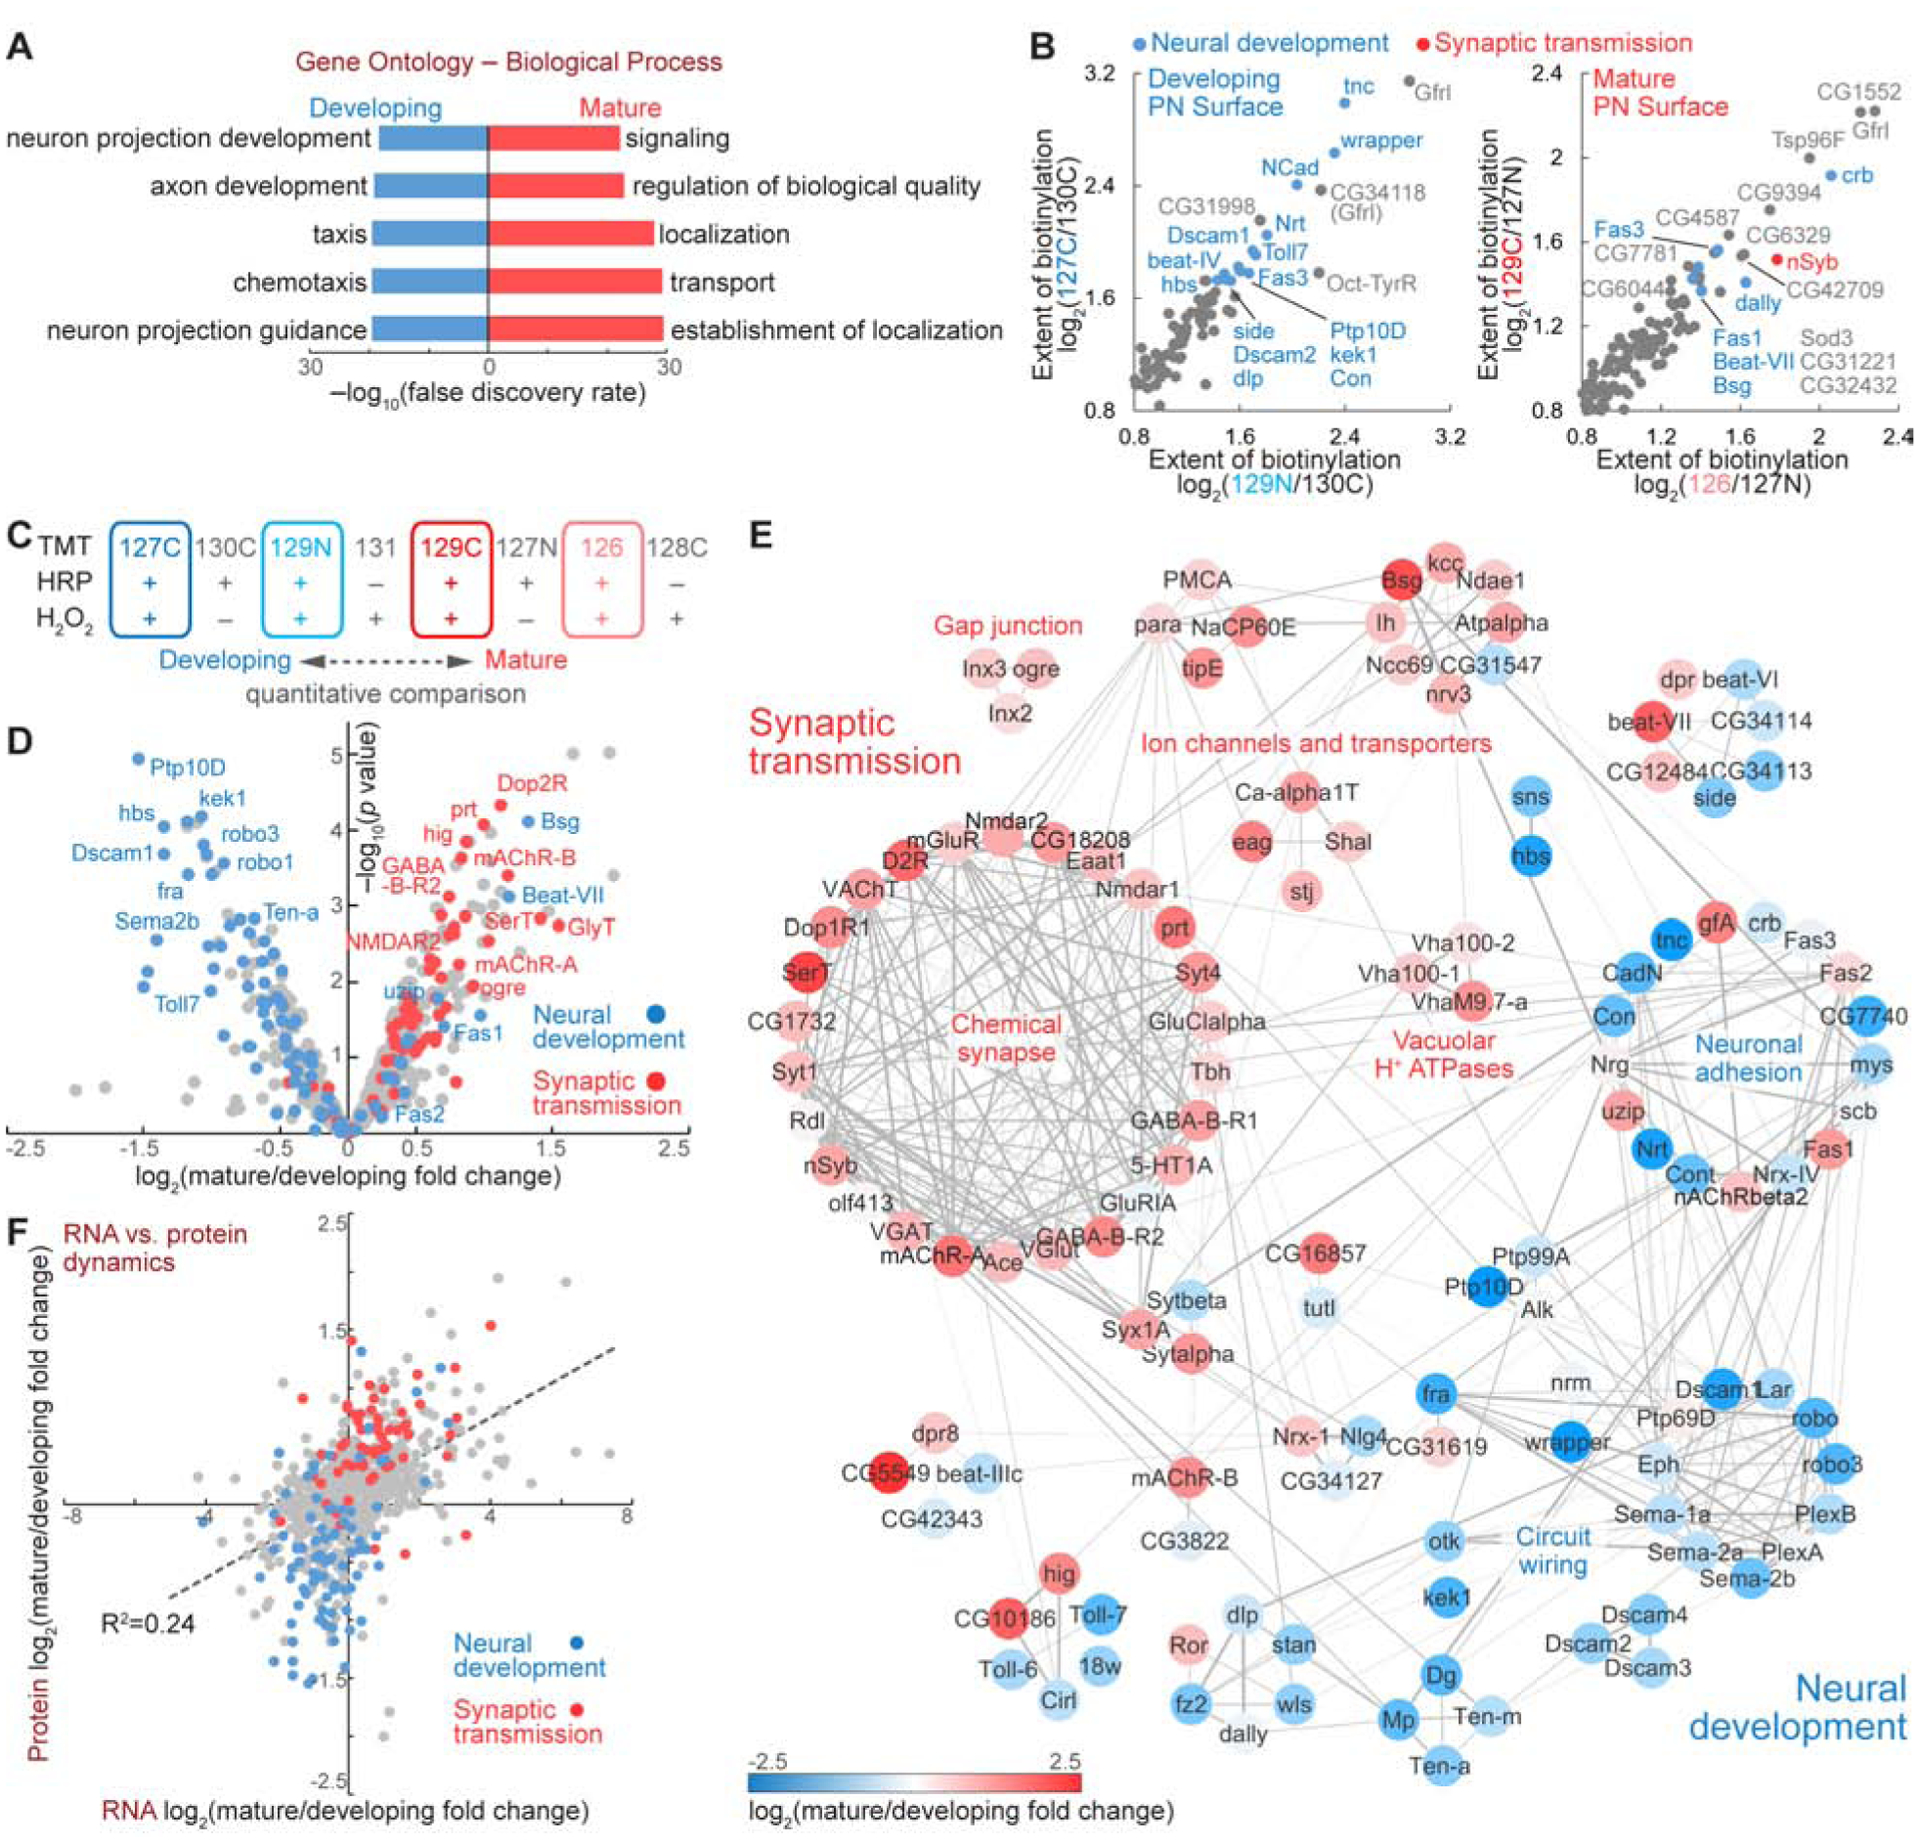
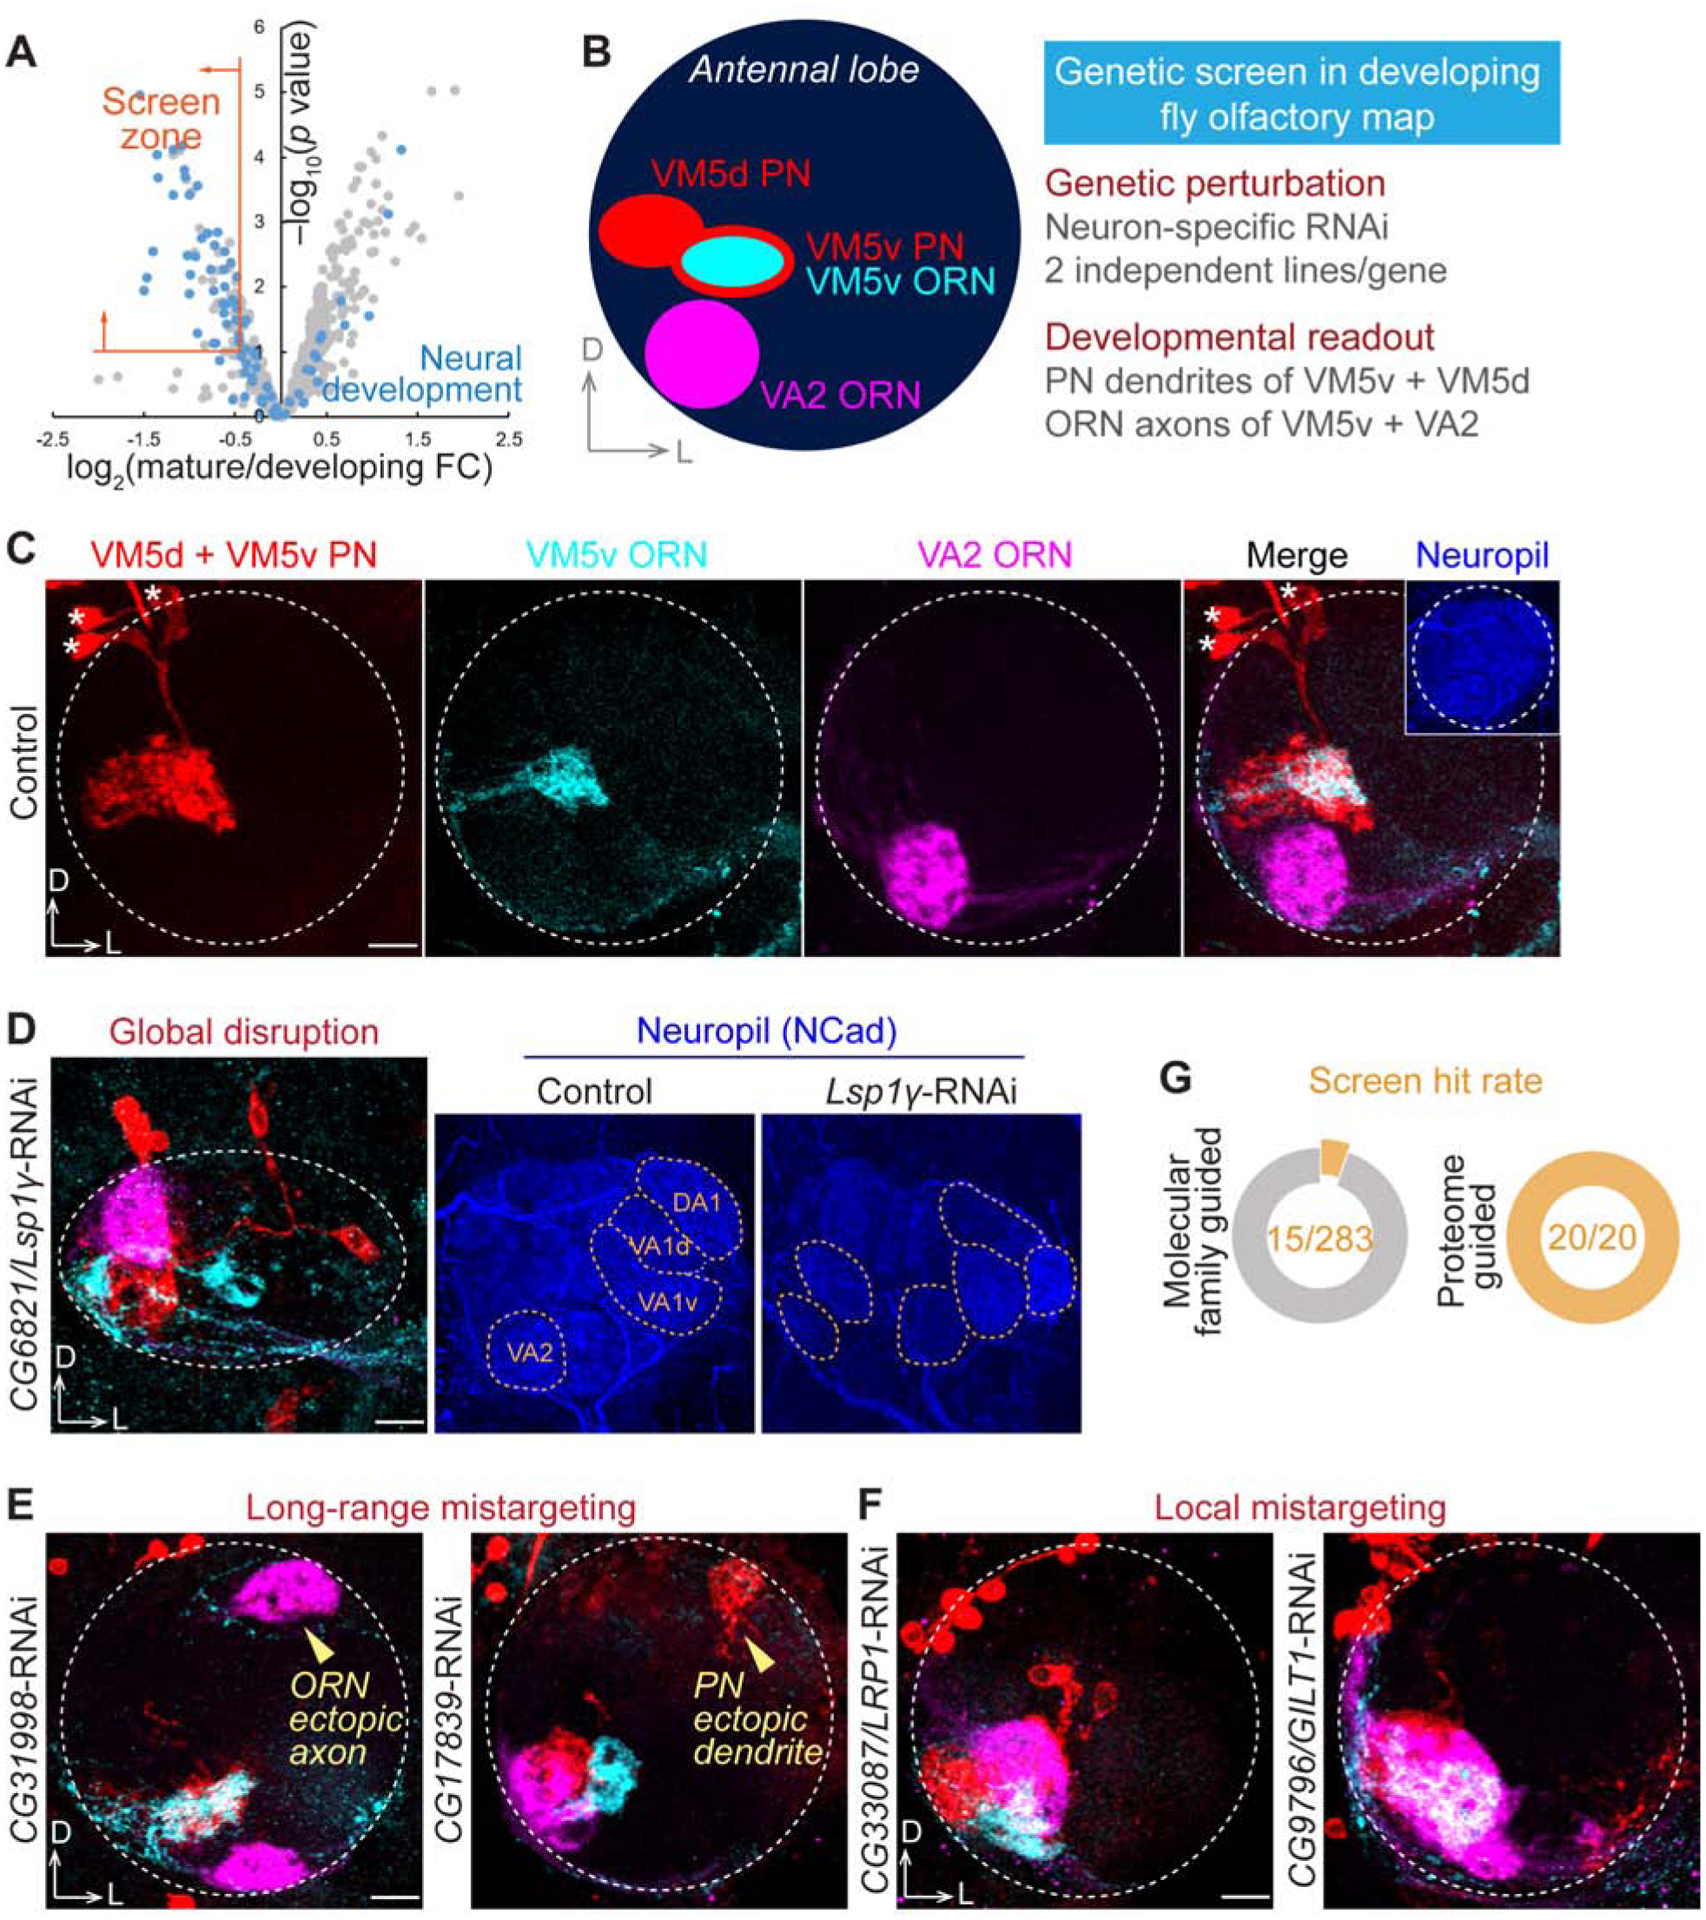
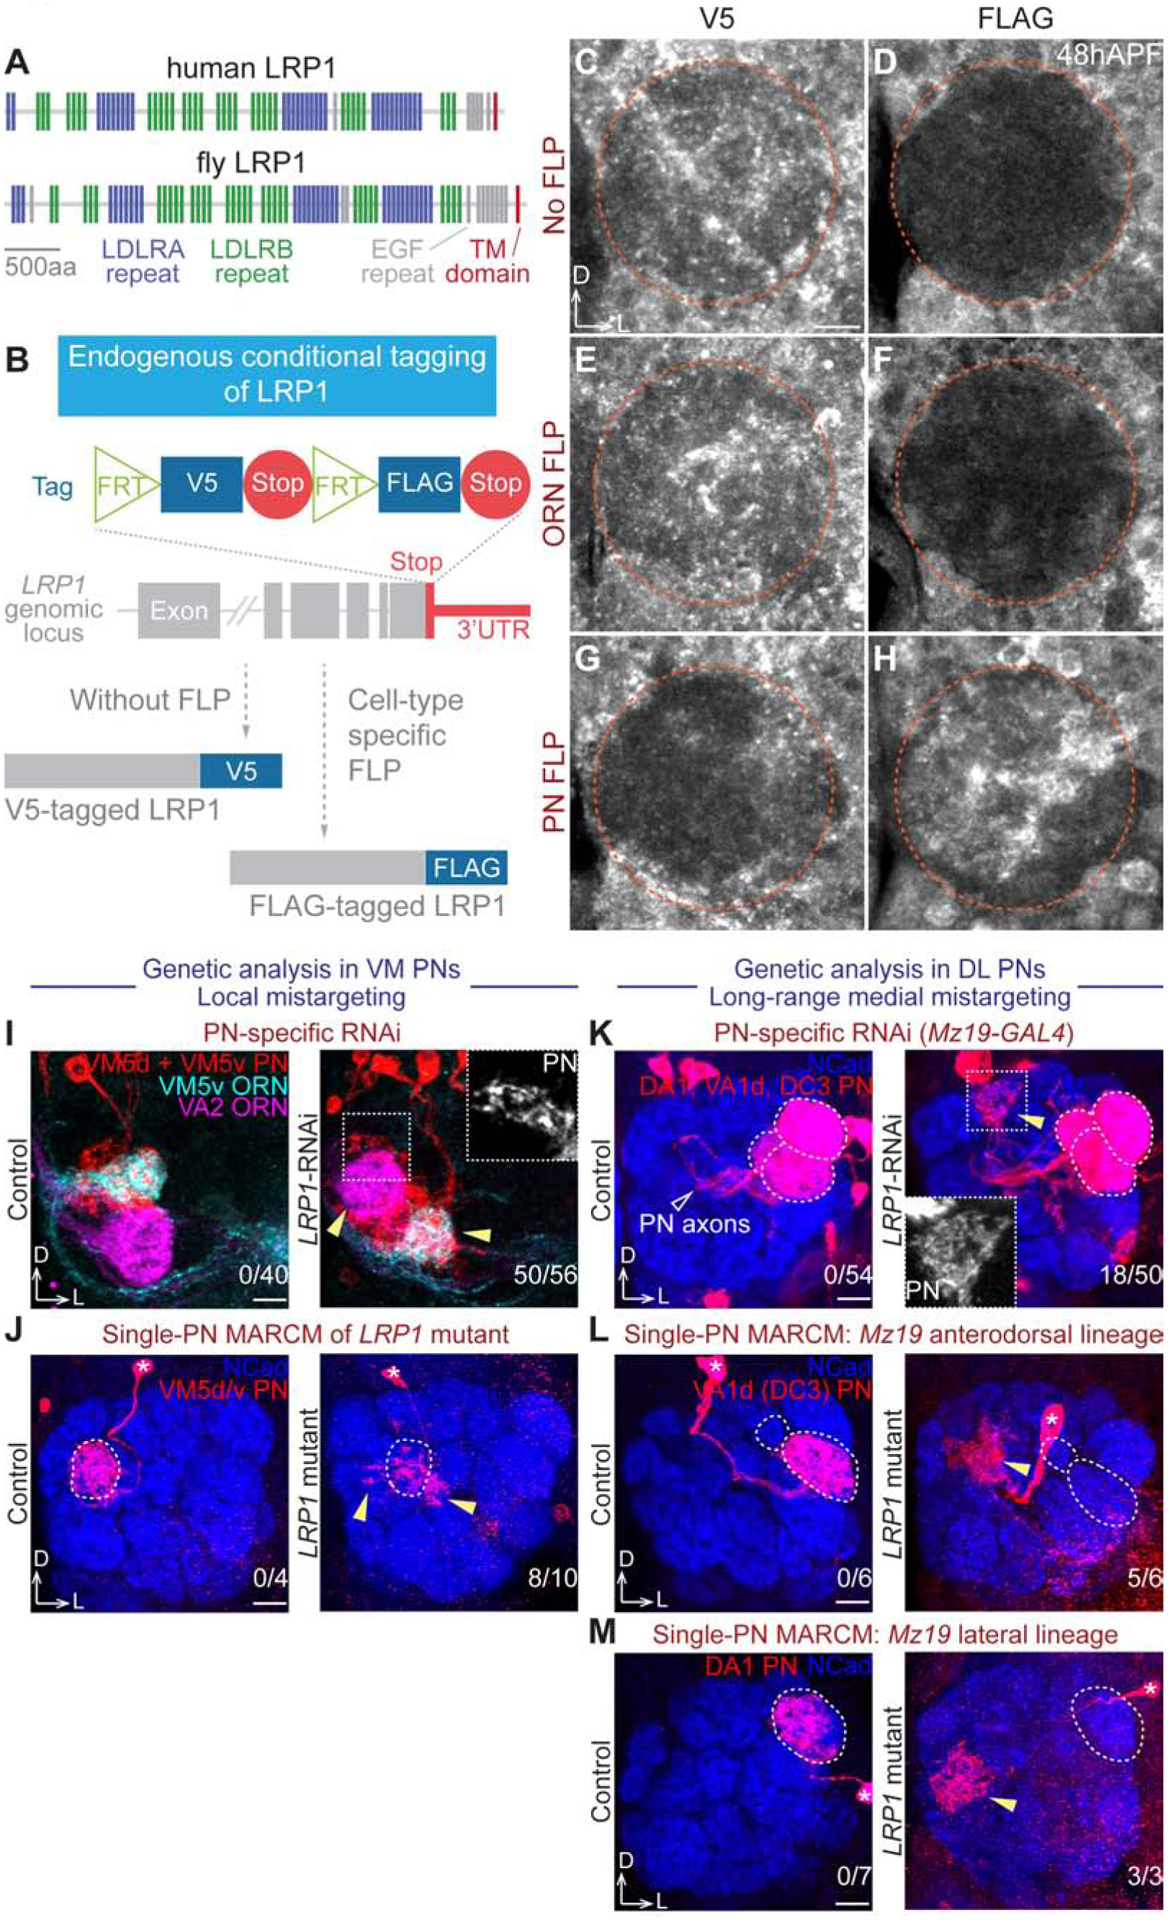
Molecular interactions at the cellular interface mediate organized assembly of single cells into tissues and, thus, govern the development and physiology of multicellular organisms. Here, we developed a cell-type-specific, spatiotemporally resolved approach to profile cell-surface proteomes in intact tissues. Quantitative profiling of cell-surface proteomes of Drosophila olfactory projection neurons (PNs) in pupae and adults revealed global downregulation of wiring molecules and upregulation of synaptic molecules in the transition from developing to mature PNs. A proteome-instructed in vivo screen identified 20 cell-surface molecules regulating neural circuit assembly, many of which belong to evolutionarily conserved protein families not previously linked to neural development. Genetic analysis further revealed that the lipoprotein receptor LRP1 cell-autonomously controls PN dendrite targeting, contributing to the formation of a precise olfactory map. These findings highlight the power of temporally resolved in situ cell-surface proteomic profiling in discovering regulators of brain wiring.

Keywords: Drosophila; LRP1; cell surface; developmental dynamics; neural development; olfactory circuit; proteomics; wiring specificity.


Conflict of interest statement

DECLARATION OF INTERESTS

The authors declare no competing interests.

Figures

Figure 1.
Figure 1.. Cell-Surface Biotinylation of Olfactory Projection Neurons in Intact Brains
(A) Scheme and features of cell-surface biotinylation in intact tissues. (B) Olfactory projection neuron (PN) specific VT033006-GAL4 (PN-GAL4, hereafter) drove the expression of membrane-targeted GFP (CD4-GFP). The zoom-in panel shows a single optical section of the PN soma area. Orange circle, antennal lobe. (C and D) Neutravidin staining of antennal lobes after the cell-surface biotinylation reaction. (C) HRP was not expressed by omitting the GAL4 driver. (D) PN-GAL4 drove the expression of cell surface-targeted HRP (HRP-CD2). The zoom-in panel shows a single optical section of the PN soma area. (E) Left and middle, streptavidin blots of the whole-brain lysate (left) and the post-enrichment bead eluate (middle). Right, silver stain of the post-enrichment bead eluate. −HRP, PN-GAL4 omitted; +HRP, PN>HRP-CD2. (F) Immunoblots of intracellular proteins, actin and bruchpilot (Brp), and neuronal surface protein N-cadherin (NCad) in the whole-brain lysate and the post-enrichment bead eluate. −HRP, PN-GAL4 omitted; +HRP, PN>HRP-CD2. Scale bar, 10 μm. See also Figure S1.
Figure 2.
Figure 2.. Cell-Surface Proteomic Profiling of Developing and Mature PNs
(A) Workflow of the PN surface proteomic profiling. (B) Design of the 8-plex tandem mass tag (TMT8)-based quantitative proteomic experiment. Each time point comprised two biological replicates (blue or red) and two negative controls (grey). Labels in the “TMT” row (e.g., 127C) depict the TMT tag used for each condition. (C) Numbers of proteins after each step of the ratiometric and cutoff analyses. (D) Receiver operating characteristic (ROC) curve of each biological replicate. Proteins were ranked in a descending order based on the TMT ratio. True-positive denotes plasma membrane proteins curated by the UniProt database. False-positive includes nuclear, mitochondrial, and cytosolic proteins without membrane annotation by UniProt. The top 20% region (dotted green box) is enlarged on the right. A two-sample Wilcoxon rank-sum test was used to determine the statistical significance. (E) Venn diagram of developing and mature PN surface proteomes, after ratiometric and cutoff analyses. These two proteomes contain 712 proteins in total, with 252 proteins shared by both stages. (F) Correlation of biological replicates. (G) Top 5 Cellular Compartment terms of the developing and mature PN surface proteomes in gene ontology analysis. See also Figure S2 and Figure S3.
Figure 3.
Figure 3.. Temporal Evolution of the Cell-Surface Proteome in Accord with PN Development and Function
(A) Top 5 Biological Process terms of the developing and mature PN surface proteomes in gene ontology analysis. (B) Most enriched proteins on the developing and mature PN surface, respectively. Blue, known neural development molecules; red, known synaptic transmission molecules. (C and D) TMT-based quantification revealed the expression change of cell-surface proteins in PN development and maturation. (E) Coordinated expression change of functionally associated molecular complexes in developing and mature PNs. Markov clustering was performed with protein-protein interaction scores from the STRING database. Grey lines denote protein-protein interactions. Nodes are color-coded based on the expression change (color scale at the bottom). (F) RNA vs. protein changes of PN surface molecules. Dashed line depicts the linear regression. See also Figure S3 and Figure S4.
Figure 4.
Figure 4.. Genetic Screen Identified Regulators of Neural Circuit Assembly
(A) Selection criteria for the genetic screen. Screen zone cutoffs: log2(mature/developing FC) < −0.4 and −log10(p value) > 1. FC, fold change. (B) Scheme and features of the genetic screen in ventromedial (VM) PNs and ORNs. VM5d and VM5v PNs were labelled by GMR86C10-LexA-driven membrane-targeted tdTomato (LexAop-mtdTomato; red). VM5v and VA2 ORNs were labelled by Or98a promoter-driven membrane-targeted GFP (Or98a-mCD8-GFP; cyan) and Or92a promoter-driven rat CD2 transmembrane motif (Or92a-rCD2; magenta), respectively. The pan-neuronal C155-GAL4 drove the expression of gene-specific RNAi. (C) Targeting of VM5d/v PN dendrites and VM5v/VA2 ORN axons in a control antennal lobe. None of the 62 examined antennal lobes in controls exhibited any targeting defects. Dashed circle, antennal lobe; asterisk, PN soma. (D) CG6821/Lsp1γ knockdown caused global disruption of the antennal lobe structure. Yellow dashed circles in neuropil staining (blue) represent stereotyped glomeruli that are easily identified in control but are misshapen and unrecognizable in Lsp1γ knockdown. (E) CG31998 and CG17839 knockdown caused long-range mistargeting of ORN axons and PN dendrites, respectively, to the dorsolateral (DL) antennal lobe. (F) CG33087/LRP1 and CG9796/GILT1 knockdown caused VM local mistargeting of ORN axons and PN dendrites. (G) Hit rates of our previous molecular family-based screen (Xie et al., 2019) and the current cell-surface proteome-guided screen, with the identical assay (scheme in B). Scale bar, 10 μm. D, dorsal; L, lateral. RNAi phenotypic penetrances are listed in Table 2. See also Figure S5.
Figure 5.
Figure 5.. LRP1 Cell-Autonomously Controls PN Dendrite Targeting
(A) Domain structures of human and fruit fly LRP1 proteins. TM, transmembrane. (B) Schematic of conditional tagging of LRP1 to reveal its cell-type-specific endogenous protein expression pattern. (C–H) V5 (C, E, G) or FLAG (D, F, H) staining of tagged LRP1 under different conditions: without FLP (C and D), ORN-specific eyFLP (E and F), and PN-specific VT033006>FLP (G and H). 48hAPF, 48 hours after puparium formation. Orange circle, antennal lobe. Cortex glia outside of the antennal lobe have high background signal in FLAG staining. (I) PN-specific LRP1-RNAi knockdown caused local mistargeting of VM5d/v PN dendrites and VM5v/VA2 ORN axons (zoom-in square and arrowheads). (J) Mosaic analysis of LRP1 mutant in single VM5d/v PNs showed dendrite local mistargeting (arrowheads). Dotted circle, normal targeting area. (K) PN-specific LRP1-RNAi knockdown caused long-range medial mistargeting (zoom-in square and yellow arrowhead) of Mz19+ PN dendrites, which normally target the dorsolateral (DL) DA1, VA1d, and DC3 glomeruli (dotted circles). (L and M) Mosaic analysis of LRP1 mutant in single Mz19+ PNs showed long-range medial dendrite mistargeting (arrowheads). Dotted circle, normal targeting area. (L) Mz19+ anterodorsal lineage PNs, which normally target dendrites to VA1d or DC3. (M) Mz19+ lateral lineage PNs, which normally target dendrites to DA1. Scale bar, 10 μm. D, dorsal; L, lateral. Asterisk, PN soma. The number of antennal lobes with mistargeting over the total number of antennal lobes examined is noted at the bottom-right corner of each panel. See also Figure S6 and Figure S7.

References

    1. Aebersold R, and Mann M (2016). Mass-spectrometric exploration of proteome structure and function. Nature 537, 347–355. - PubMed
    1. Almagro Armenteros JJ, Sønderby CK, Sønderby SK, Nielsen H, and Winther O (2017). DeepLoc: prediction of protein subcellular localization using deep learning. Bioinformatics 33, 3387–3395. - PubMed
    1. Alvarez-Castelao B, Schanzenbächer CT, Hanus C, Glock C, Tom Dieck S, Dörrbaum AR, Bartnik I, Nassim-Assir B, Ciirdaeva E, Mueller A, et al. (2017). Cell-type-specific metabolic labeling of nascent proteomes in vivo. Nat. Biotechnol 35, 1196–1201. - PubMed
    1. Anders S, Pyl PT, and Huber W (2015). HTSeq — a Python framework to work with high-throughput sequencing data. Bioinformatics 31, 166–169. - PMC - PubMed
    1. Barish S, Nuss S, Strunilin I, Bao S, Mukherjee S, Jones CD, and Volkan PC (2018). Combinations of DIPs and Dprs control organization of olfactory receptor neuron terminals in Drosophila. PLoS Genet 14, e1007560. - PMC - PubMed

Publication types

MeSH terms