. 2020 May;4(5):535-544.
doi: 10.1016/j.oret.2019.11.014. Epub 2019 Nov 22.

Visual Acuity and Foveal Structure in Eyes with Fragmented Foveal Avascular Zones

Affiliations

Visual Acuity and Foveal Structure in Eyes with Fragmented Foveal Avascular Zones

Rachel E Linderman et al. Ophthalmol Retina. 2020 May.

Abstract

Purpose: To assess the frequency and impact of abnormal foveal avascular zone (FAZ) topography (i.e., a fragmented FAZ) on visual acuity and foveal anatomic features.

Design: Prospective, cross-sectional study from March 2018 through July 2019.

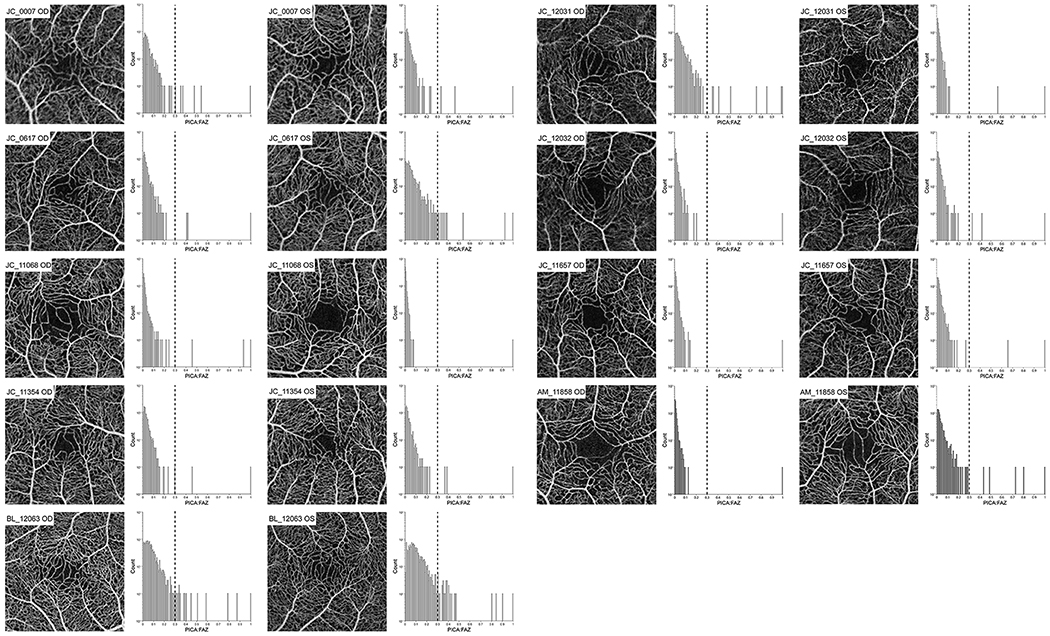
Participants: Two-hundred fifty participants were screened from a normative OCT angiography database. Of those, 12 participants were found to have at least 1 eye with a fragmented FAZ. Eight returned for follow-up imaging, along with an additional 3 participants with ocular disease (amblyopia, autosomal recessive bestrophinopathy, premature birth) having a similar FAZ phenotype.

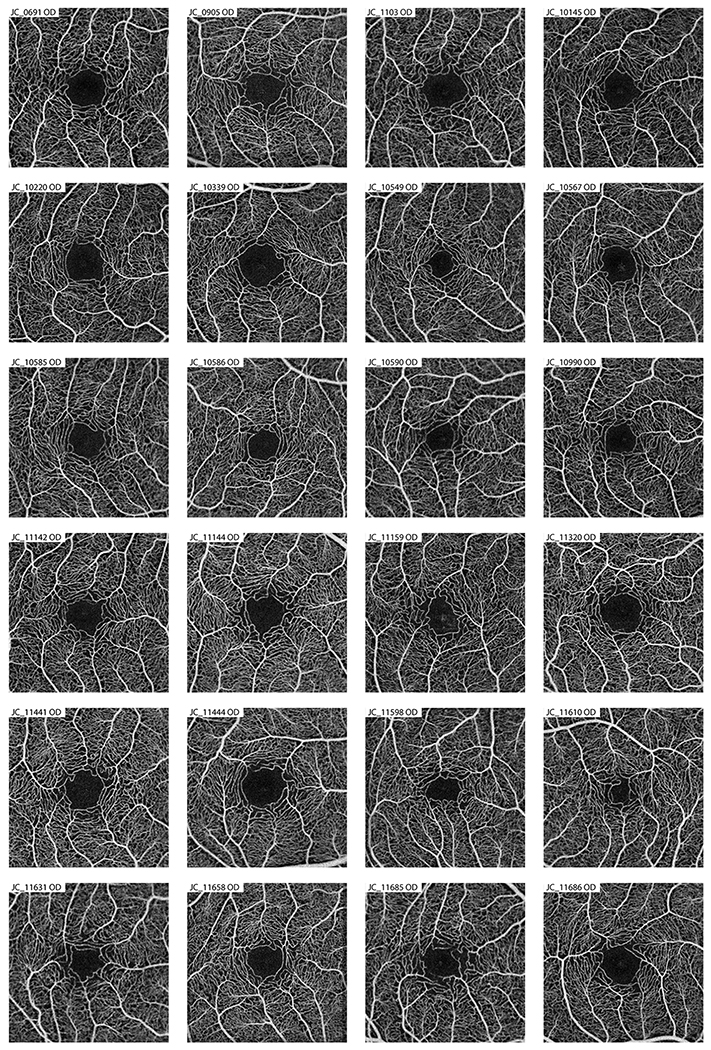
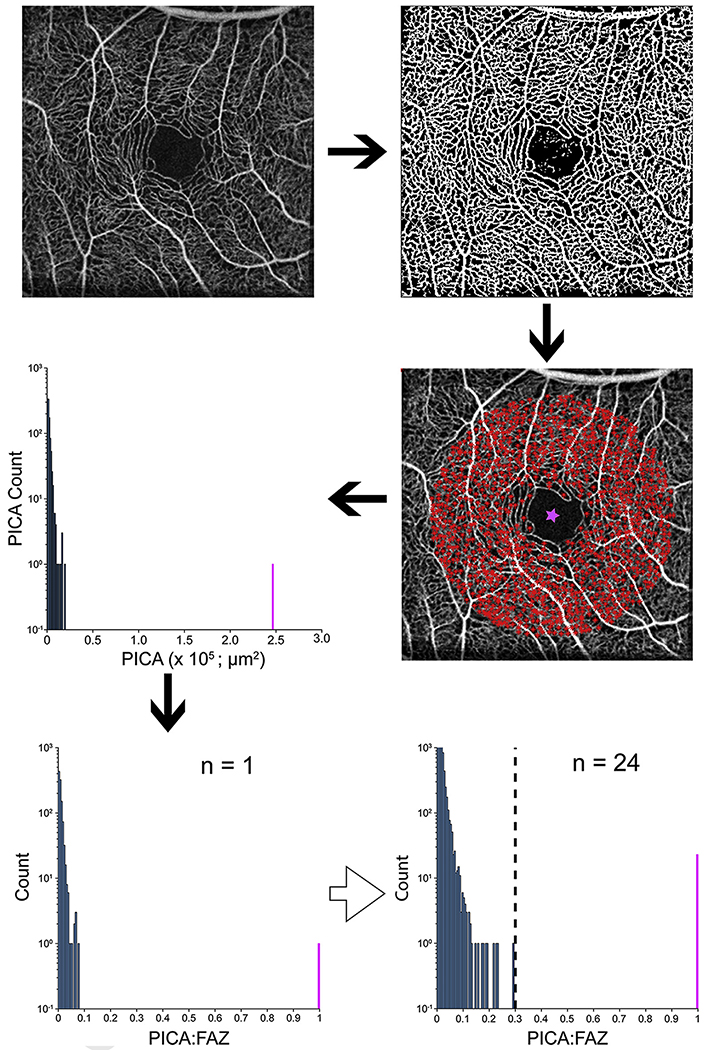
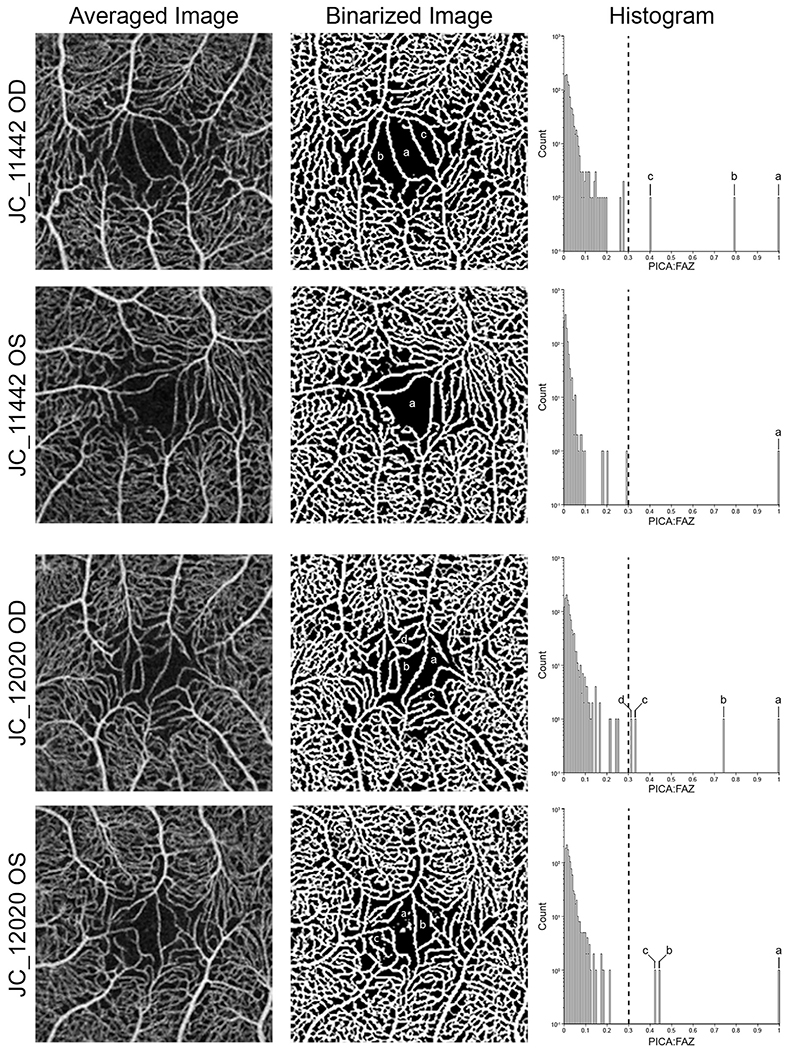
Methods: Follow-up OCT imaging and monocular best-corrected visual acuity (BCVA) were performed for these 11 participants. Twenty-four participants with a clearly defined FAZ were recruited for comparison. A normative database was created measuring parafoveal intercapillary area (PICA) to determine if an FAZ was fragmented.

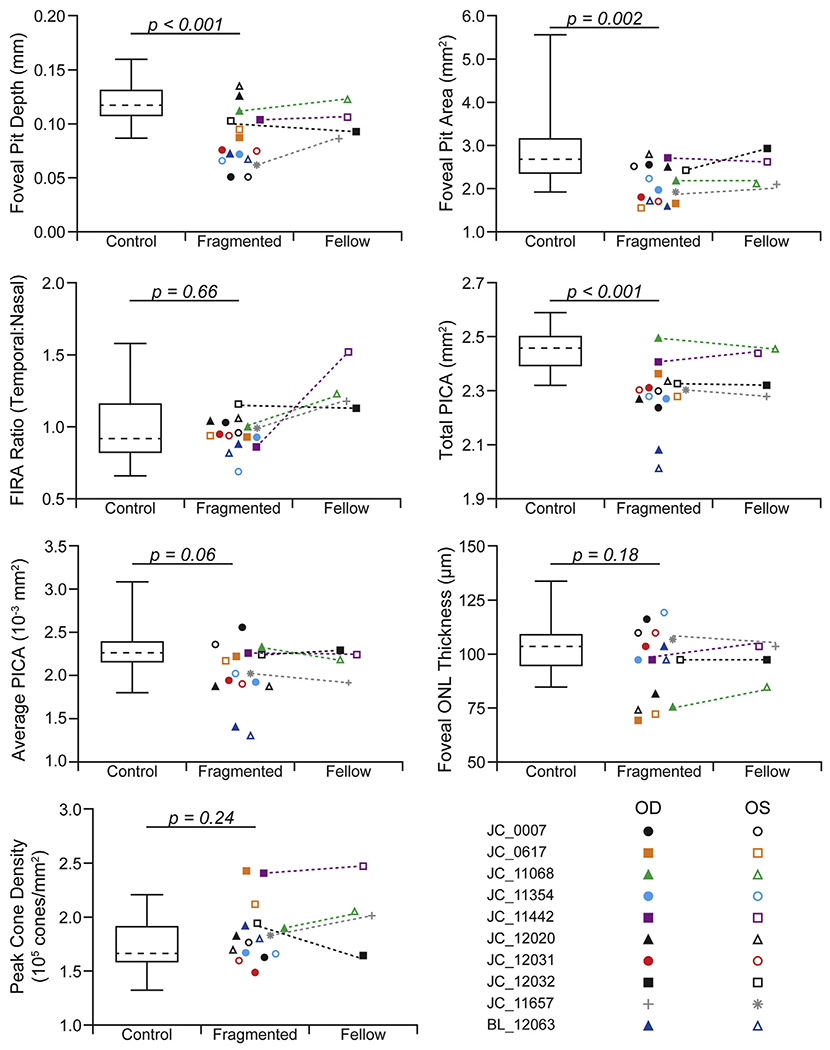
Main outcome measures: Monocular BCVA, foveal pit depth, foveal pit area, PICA, outer nuclear layer thickness, foveal inner retinal area, and peak cone density.

Results: The frequency of a fragmented FAZ was 4.8% of individuals (12 of 250) or 3.6% of eyes (18 of 500 eyes). A significant difference was found between the control eyes and eyes with fragmented FAZs for foveal pit depth, pit area, and total PICA (P < 0.001, P = 0.002, and P < 0.001, respectively). The presence of a fragmented FAZ did not affect visual acuity.

Conclusions: The presence of a fragmented FAZ seems not to be a rare phenotype in individuals with normal vision. The presence of altered FAZ topography in patients with retinal or systemic disease could negatively impact the accuracy and sensitivity of biomarkers dependent on FAZ identification.


Figures

Figure 1.
Figure 1.
Averaged OCT-A images of the contorl subjects used in the creation of the parafoveal intercapillary area normative database. Eyes within the control group were used as a comparison against the eyes with a “fragmented” FAZ to see if there were any difference in other foveal morphology measurements.
Figure 2.
Figure 2.
Images showing the parafoveal intercapillary area (PICA) method to detect a fragmented foveal avascular zone (FAZ). Five angiograms were averaged per eye. The averaged image was run through a custom Matlab script that binarized the image and measured the area of the PICAs (red stars) within 1.3 mm of the base of the fovea (pink star). A histogram of the raw PICA values was created with the FAZ shown in pink. Because of the large between-participant variation in FAZ size, the PICAs were normalized to the FAZ (PICA:FAZ). A single histogram for all 24 control participants was used to identify the maximum PICA ratio of 0.29. Based on this, a threshold of 0.3 was used (dashed vertical line) to classify FAZs as fragmented; FAZs in participants with more than 1 PICA:FAZ above this threshold were defined as fragmented.
Figure 3.
Figure 3.
Examples of individuals with altered foveal avascular zone (FAZ) topography. In participant JC_11442’s right eye, multiple parafoveal intercapillary area (PICA)-to-FAZ (PICA:FAZ) regions of more than 0.3 (a—c) are present, whereas the left eye is defined as normal according to our threshold. Participant JC_12020 shows multiple PICA:FAZ regions of more than 0.3 in both eyes, resulting in both being classified as fragmented. Each region above the 0.3 threshold is labeled on the binarized image and histogram for comparison.
Figure 4.
Figure 4.
Averaged OCT-A images and histograms of the other nine subjects of eleven (two shown in Figure 3) with at least one eye determined to have a fragmented FAZ. Each histogram shows all parafoveal intercapillary areas (PICA) within a 1.3 mm radius from the deepest part of the foveal pit to the largest PICA (PICA:FAZ). An FAZ is classified as “fragmented” when two or more PICA:FAZ region are above 0.3 (dashed lines). If only one PICA is above 0.3, the FAZ is classified as normal.
Figure 5.
Figure 5.
Graphs comparing control eyes and eyes with a fragmented foveal avascular zone (FAZ). The control population is shown as a box-and-whisker plot (dashed line, mean; box limits, 25th—75th percentiles; whiskers, minimum and maximum). Each point within the fragmented and fellow eye group is a single eye (open, left eye [OS]; filled, right eye [OD]). Dotted lines connect the eyes in participants with unilateral fragmentation of the FAZ. Although the fellow eye is shown for comparison (when available), no statistical tests were performed between these groups. A significant difference was found between foveal pit depth, foveal pit area, and total PICA when comparing the controls with the fragmented eyes. FIRA = ■■■; ONL = outer nuclear layer.
Figure 6.
Figure 6.
Adaptive optics scanning light ophthalmoscopy images of the foveal cone mosaic for participant JC_11442. The right eye was determined to have a fragmented foveal avascular zone (FAZ) and shows a peak cone density of 241 286 cones/mm2. The left eye was classified as having a normal FAZ and showed a peak cone density of 247 710 cones/mm2. These peak cone density values are consistent with normal values from previous studies., Scale bar = 50 μm.

References

    1. Provis JM. Development of the primate retinal vasculature. Prog Retin Eye Res. 2001;20:799–821. - PubMed
    1. Tick S, Rossant F, Ghorbel I, et al. Foveal shape and structure in a normal population. Invest Ophthalmol Vis Sci. 2011;52:5105–5110. - PubMed
    1. Tam J, Dhamdhere KP, Tiruveedhula P, et al. Disruption of the retinal parafoveal capillary network in type 2 diabetes before the onset of diabetic retinopathy. Invest Ophthalmol Vis Sci. 2011;52:9257–9266. - PMC - PubMed
    1. Spaide RF, Klancnik JMJ, Cooney MJ. Retinal vascular layers in macular telangiectasia type 2 imaged by optical coherence tomography angiography. JAMA Ophthalmol. 2015;133:66–73. - PubMed
    1. Matsushita I, Nagata T, Hayashi T, et al. Foveal hypoplasia in patients with Stickler syndrome. Ophthalmology. 2017;124:896–902. - PubMed

Publication types

LinkOut - more resources