. 2019 Dec 20:10:2916.
doi: 10.3389/fmicb.2019.02916. eCollection 2019.

Comparative Genomics of Streptococcus thermophilus Support Important Traits Concerning the Evolution, Biology and Technological Properties of the Species

Affiliations

Comparative Genomics of Streptococcus thermophilus Support Important Traits Concerning the Evolution, Biology and Technological Properties of the Species

Voula Alexandraki et al. Front Microbiol. .

Abstract

Streptococcus thermophilus is a major starter for the dairy industry with great economic importance. In this study we analyzed 23 fully sequenced genomes of S. thermophilus to highlight novel aspects of the evolution, biology and technological properties of this species. Pan/core genome analysis revealed that the species has an important number of conserved genes and that the pan genome is probably going to be closed soon. According to whole genome phylogeny and average nucleotide identity (ANI) analysis, most S. thermophilus strains were grouped in two major clusters (i.e., clusters A and B). More specifically, cluster A includes strains with chromosomes above 1.83 Mbp, while cluster B includes chromosomes below this threshold. This observation suggests that strains belonging to the two clusters may be differentiated by gene gain or gene loss events. Furthermore, certain strains of cluster A could be further subdivided in subgroups, i.e., subgroup I (ASCC 1275, DGCC 7710, KLDS SM, MN-BM-A02, and ND07), II (MN-BM-A01 and MN-ZLW-002), III (LMD-9 and SMQ-301), and IV (APC151 and ND03). In cluster B certain strains formed one distinct subgroup, i.e., subgroup I (CNRZ1066, CS8, EPS, and S9). Clusters and subgroups observed for S. thermophilus indicate the existence of lineages within the species, an observation which was further supported to a variable degree by the distribution and/or the architecture of several genomic traits. These would include exopolysaccharide (EPS) gene clusters, Clustered Regularly Interspaced Short Palindromic Repeats (CRISPRs)-CRISPR associated (Cas) systems, as well as restriction-modification (R-M) systems and genomic islands (GIs). Of note, the histidine biosynthetic cluster was found present in all cluster A strains (plus strain NCTC12958T) but was absent from all strains in cluster B. Other loci related to lactose/galactose catabolism and urea metabolism, aminopeptidases, the majority of amino acid and peptide transporters, as well as amino acid biosynthetic pathways were found to be conserved in all strains suggesting their central role for the species. Our study highlights the necessity of sequencing and analyzing more S. thermophilus complete genomes to further elucidate important aspects of strain diversity within this starter culture that may be related to its application in the dairy industry.

Keywords: CRISPR; cheese; genomic islands; horizontal gene transfer; lineage; milk; pan genome; yogurt.


Figures

FIGURE 1
FIGURE 1
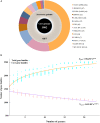
Graphical presentation of core genome (inner black circle), accessory genome (middle gray circle) and unique genes (outer multicolored circle) of the 23 S. thermophilus strains. The number of unique genes for each strain is presented in the parentheses (A). Pan and core genome plots of S. thermophilus strains analyzed (B).
FIGURE 2
FIGURE 2
Core genome phylogenetic tree of the 23 S. thermophilus strains. Strains were grouped in two clusters (A,B). Subgroups within the clusters are also highlighted (AI, AII, AIII, AIV, and BI). S. salivarius NCTC 8618 was used as an outgroup. For branches with less than 50% bootstrap support the bootstrap values are not shown.
FIGURE 3
FIGURE 3
Average nucleotide identity (ANI) phylogenetic tree and heat map visualization of the 23 S. thermophilus strains.
FIGURE 4
FIGURE 4
Clusters of orthologous groups (COG) frequency heat map based on a two-dimensional hierarchical clustering. The horizontal axis corresponds to the percentage frequency of proteins involved in the respective COG functional categories: Information storage and processing: translation, ribosomal structure, and biogenesis (J), transcription (K), replication, recombination, and repair (L); cellular processes and signaling: cell cycle control, cell division, chromosome partitioning (D), cell wall/membrane/envelope biogenesis (M), cell motility (N), post-translational modification, protein turnover, chaperones (O), signal transduction mechanisms (T), intracellular trafficking, secretion, and vesicular transport (U), defense mechanisms (V); metabolism: energy production and conversion (C), amino acid transport and metabolism (E), nucleotide transport and metabolism (F), carbohydrate transport and metabolism (G), coenzyme transport and metabolism (H), lipid transport and metabolism (I), inorganic ion transport and metabolism (P), secondary metabolites biosynthesis, transport and catabolism (Q). The vertical axis shows the 23 S. thermophilus strains. Strains were grouped in two clusters (A,B). Subgroups within the clusters are also highlighted (AI, AII, AIII, AIV, and BI). Categories R and S, concerning poorly characterized proteins, were not included in the analysis.
FIGURE 5
FIGURE 5
Presence/absence heat map and two-dimensional hierarchical clustering of the 23 S. thermophilus strains accessory genome (A). Colored areas represent the presence of genes in the respective S. thermophilus strains, while white areas indicate the absence of genes. Accessory genes clustered according to their presence in specific subgroups or clusters of strains (gene clusters 1 to 6) are highlighted with red frames on the x axis. The presence of a specific gene cluster in cluster A or B as well as specific subgroups of strains is highlighted with blue or black frames, respectively. Presence/absence heat map and hierarchical clustering of S. thermophilus strains based on accessory genes with clusters of orthologous groups (COG) assignment involved in metabolism (categories C, E, F, G, H, I, P, and Q) (B). Colored areas represent the presence of genes in the respective S. thermophilus strains, while white areas indicate the absence of genes. Genes implicated in the biosynthesis of histidine are highlighted with a black frame. Of note, panel (B) is a composite figure of an excel generated table manually colored, while clustering was exported from RStudio. This was necessary to achieve clustering of genes grouped based on COG categories.
FIGURE 6
FIGURE 6
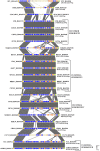
Multiple sequence alignment of the exopolysaccharide (EPS) gene clusters of the 23 S. thermophilus strains after BLASTN analysis. Gray shading represents the % identity among the nucleotide sequences according to the color gradient presented at the lower right corner of the figure. Protein coding genes are highlighted in dark blue, putative pseudogenes in orange, the deoD in yellow, the transporter gene in green and the unique genes for each S. thermophilus strain in beize. Clusters and subgroups of strains are highlighted.
FIGURE 7
FIGURE 7
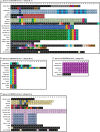
Spacer sequences alignment of the various clustered regularly interspaced short palindromic repeats-CRISPR associated (CRISPR-Cas) system types found in the 22 S. thermophilus strains. In the alignments only the spacer sequences have been used. In each type of CRISPR-Cas system each spacer is represented by the combination of a character and a font color. The spacers represented in black font with the letter U correspond to unique spacers. Spacers represented by the same combination of a character and a font color correspond to identical spacers. Spacers of CRISPR1 (A), CRISPR2 (B), CRISPR4 (C), and CRISPR3 (D).
FIGURE 8
FIGURE 8
Schematic representation of structural and functional genomic traits that support the distinction of S. thermophilus strains in clusters A and B. The genomic features included in the common area of the Venn diagram are either present to all strains or they exhibit a presence/absence pattern beyond clusters A and B.

References

    1. Ai L., Chen C., Zhou F., Wang L., Zhang H., Chen W., et al. (2011). Complete genome sequence of the probiotic strain Lactobacillus casei BD-II. J. Bacteriol. 193 3160–3161. 10.1128/JB.00421-11 - DOI - PMC - PubMed
    1. Albertsen M., Hugenholtz P., Skarshewski A., Nielsen K. L., Tyson G. W., Nielsen P. H. (2013). Genome sequences of rare, uncultured bacteria obtained by differential coverage binning of multiple metagenomes. Nat. Biotechnol. 31 533–538. 10.1038/nbt.2579 - DOI - PubMed
    1. Alexandraki V., Kazou M., Blom J., Pot B., Tsakalidou E., Papadimitriou K. (2017). The complete genome sequence of the yogurt isolate Streptococcus thermophilus ACA-DC 2. Stand. Genomic Sci. 12:18. 10.1186/s40793-017-0227-5 - DOI - PMC - PubMed
    1. Anbukkarasi K., Nanda D. K., Umamaheswari T., Hemalatha T., Singh P., Singh R. (2014). Assessment of expression of Leloir pathway genes in wild-type galactose-fermenting Streptococcus thermophilus by real-time PCR. Eur. Food Res. Technol. 239 895–903. 10.1007/s00217-014-2286-9 - DOI
    1. Anbukkarasi K., Umamaheswari T., Hemalatha T., Nanda D. K., Singh P., Rashmi H. M., et al. (2013). Production of low browning Mozzarella cheese: screening and characterization of wild galactose fermenting Streptococcus thermophilus strains. Int. J. Adv. Res. 1 83–96.

LinkOut - more resources