. 2019 Dec 26:17:100159.
doi: 10.1016/j.pacs.2019.100159. eCollection 2020 Mar.

Broadband detection of methane and nitrous oxide using a distributed-feedback quantum cascade laser array and quartz-enhanced photoacoustic sensing

Affiliations

Broadband detection of methane and nitrous oxide using a distributed-feedback quantum cascade laser array and quartz-enhanced photoacoustic sensing

Marilena Giglio et al. Photoacoustics. .

Abstract

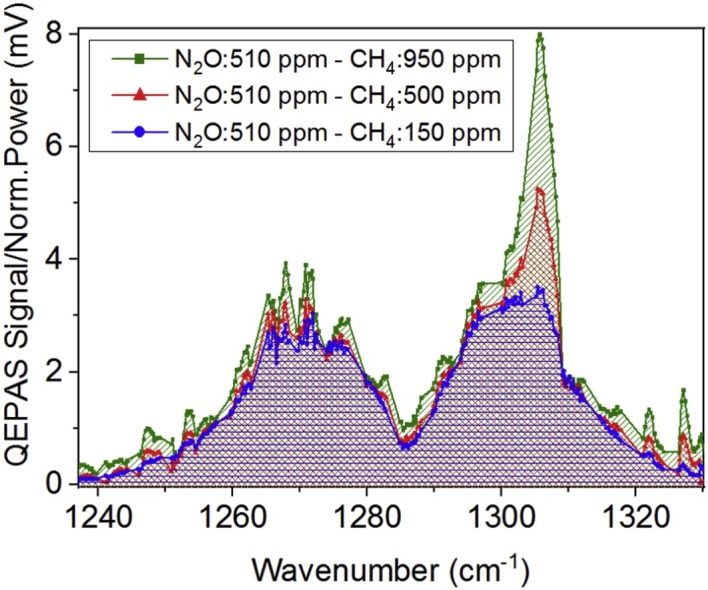
Here we report on the broadband detection of nitrous oxide (N2O) and methane (CH4) mixtures in dry nitrogen by using a quartz-enhanced photoacoustic (QEPAS) sensor exploiting an array of 32 distributed-feedback quantum cascade lasers, within a spectral emission range of 1190-1340 cm-1 as the excitation source. Methane detection down to a minimum detection limit of 200 ppb at 10 s lock-in integration time was achieved. The sensor demonstrated a linear response in the range of 200-1000 ppm. Three different mixtures of N2O and CH4 in nitrogen at atmospheric pressure have been analyzed. The capability of the developed QEPAS sensor to selectively determine the N2O and CH4 concentrations was demonstrated, in spite of significant overlap in their respective absorption spectra in the investigated spectral range.

Keywords: Broadband gas detection; Distributed-feedback quantum cascade laser array; Methane; Nitrous oxide; Quartz-enhanced photoacoustic spectroscopy.


Figures

None
Graphical abstract
Fig. 1
Fig. 1
(a) QCL array FTIR normalized intensity spectra for a 25 °C operating temperature, a 33 kHz repetition frequency, a 300 ns pulse-width and a driving voltage maximizing the devices optical power; (b) Gaussian fit (red solid line) of the normalized emission spectrum (black solid line) and (c) linear fit (red solid line) of temperature tuning of the peak emission wavelength (black dots) for the DFB-QCL number 15.
Fig. 2
Fig. 2
(a) QCL number 15 focused 3D beam profile. (b) Same QCL beam profile filtered by a 2-mm pinhole. (c) QCL number 15 2D spatially filtered beam profile. The two yellow areas represent the positions of the QTF prongs, spaced by 1-mm. The array overall illuminated area is highlighted with a red dashed line. All dimensions are represented in scale.
Fig. 3
Fig. 3
Schematic of the experimental apparatus. WFG – waveform generator; DAQ – data acquisition board; TEC – temperature controller; PRE-AMP – Pre-amplifier; PC – personal computer; QCL ARRAY – quantum cascade laser array; P – pinhole; L – focusing lens; ADM - acoustic detection module; QTF – quartz tuning fork; mR – micro-resonator tubes; PM – power-meter; GC1, GC2 – gas cylinders.
Fig. 4
Fig. 4
1000 ppm (black squares), 800 ppm (red dots), 600 ppm (blue triangles) and 400 ppm (green diamonds) CH4:N2 and pure N2 (pink triangles) FTAM QEPAS signal normalized to the optical power calibration curve. Solid lines are visual guides. Inset: Area underneath the QEPAS spectrum in mV·cm−1 units measured for each CH4:N2 concentration (black dots) and corresponding best linear fit (red line).
Fig. 5
Fig. 5
Comparison between the 1000 ppm CH4:N2 TTAM QEPAS signals normalized to the optical power calibration curve (black dots, right y-axis), and the absorption spectrum simulated by using the HITRAN database (red solid lines, left y-axis).
Fig. 6
Fig. 6
(a) 510 ppm N2O:N2 and (b) 1000 ppm CH4:N2 FTAM reference spectra; (c) FTAM QEPAS signal normalized to the optical power calibration curve for three dry mixtures containing 510 ppm of N2O and 150 ppm of CH4 (blue dots), 500 ppm of CH4 (red triangles) and 950 ppm of CH4 (green squares), respectively.
Fig. 7
Fig. 7
(a) 510 ppm N2O:N2 and (b) 1000 ppm CH4:N2 TTAM QEPAS reference spectra; (c) TTAM QEPAS signal normalized to the optical power calibration curve for three dry mixtures containing 510 ppm of N2O and 150 ppm of CH4 (blue dots), 500 ppm of CH4 (red triangles) and 950 ppm of CH4 (green squares), respectively.

References

    1. Hodgkinson J., Tatam R.P. Optical gas sensing: a review. Meas. Sci. Technol. 2013;24
    1. Daukantas P. Air-quality monitoring in the mid-infrared. Op. Photonics News. 2015;26:26.
    1. Sigrist M.W. Trace gas monitoring by laser-photoacoustic spectroscopy. Infrared Phys. Technol. 1995;36:415.
    1. Cossel K.C., Waxman E.M., Finneran I.A., Blake G.A., Ye J., Newbury N.R. Gas-phase broadband spectroscopy using active sources: progress, status, and applications. J. Opt. Soc. Am. B. 2017;34:104. - PMC - PubMed
    1. Xiong L., Bai W., Chen F., Zhao X., Yu F., Diebold G.J. Photoacoustic trace detection of gases at the parts-per-quadrillion level with a moving optical grating. Proc. Natl. Acad. Sci. U. S. A. 2017;114:7246. - PMC - PubMed

LinkOut - more resources