

Population Pharmacokinetics of Imipenem in Critically Ill Patients: A Parametric and Nonparametric Model Converge on CKD-EPI Estimated Glomerular Filtration Rate as an Impactful Covariate
- PMID: 31956969
- PMCID: PMC7329758
- DOI: 10.1007/s40262-020-00859-1
Population Pharmacokinetics of Imipenem in Critically Ill Patients: A Parametric and Nonparametric Model Converge on CKD-EPI Estimated Glomerular Filtration Rate as an Impactful Covariate
Abstract
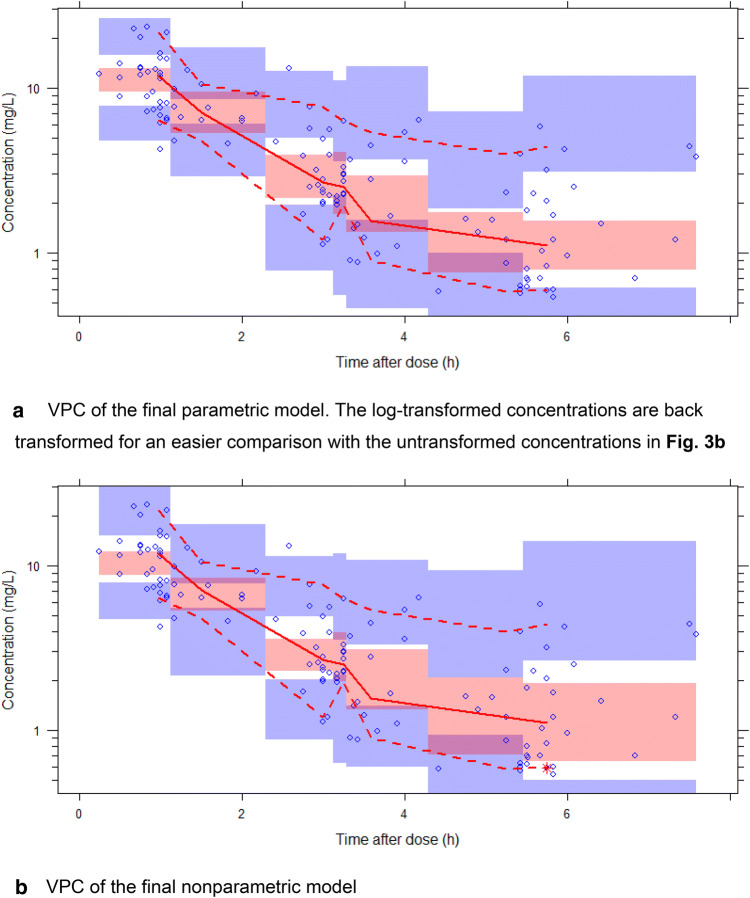
Background: Population pharmacokinetic (popPK) models for antibiotics are used to improve dosing strategies and individualize dosing by therapeutic drug monitoring. Little is known about the differences in results of parametric versus nonparametric popPK models and their potential consequences in clinical practice. We developed both parametric and nonparametric models of imipenem using data from critically ill patients and compared their results.
Methods: Twenty-six critically ill patients treated with intravenous imipenem/cilastatin were included in this study. Median estimated glomerular filtration rate (eGFR) measured by the Chronic Kidney Disease Epidemiology Collaboration (CKD-EPI) equation was 116 mL/min/1.73 m2 (interquartile range 104-124) at inclusion. The usual dosing regimen was 500 mg/500 mg four times daily. On average, five imipenem levels per patient (138 levels in total) were drawn as peak, intermediate, and trough levels. Imipenem concentration-time profiles were analyzed using parametric (NONMEM 7.2) and nonparametric (Pmetrics 1.5.2) popPK software.
Results: For both methods, data were best described by a model with two distribution compartments and the CKD-EPI eGFR equation unadjusted for body surface area as a covariate on the elimination rate constant (Ke). The parametric population parameter estimates were Ke 0.637 h-1 (between-subject variability [BSV]: 19.0% coefficient of variation [CV]) and central distribution volume (Vc) 29.6 L (without BSV). The nonparametric values were Ke 0.681 h-1 (34.0% CV) and Vc 31.1 L (42.6% CV).
Conclusions: Both models described imipenem popPK well; the parameter estimates were comparable and the included covariate was identical. However, estimated BSV was higher in the nonparametric model. This may have consequences for estimated exposure during dosing simulations and should be further investigated in simulation studies.
Conflict of interest statement
Femke de Velde, Brenda de Winter, Michael Neely, Walter Yamada, Elodie von Dach and Angela Huttner declare they have no conflicts of interest. Johan Mouton has received research funding from IMI, the EU, ZonMw (Dutch governmental support), Adenium, AstraZeneca, Basilea, Eumedica, Cubist, Merck & Co., Pfizer, Polyphor, Roche, Shionogi, Thermo-Fisher, Wockhardt, Astellas, Gilead and Pfizer. Birgit Koch has received research funding from ZonMw (Dutch governmental support) and Teva. Stephan Harbarth has received honoraria from Sandoz for participation in a Scientific Advisory Board. Teun van Gelder has received honoraria as a consultant/speaker from Aurinia Pharma, Vitaeris, Roche Diagnostics, Novartis, Astellas and Chiesi, along with grant support for transplant-related studies from Chiesi and Astellas.
Figures


References
-
- European Medicines Agency. Guideline on the use of pharmacokinetics and pharmacodynamics in the development of antimicrobial medicinal products. London; 2016. www.ema.europa.eu/docs/en_GB/document_library/Scientific_guideline/2016/....
Publication types
MeSH terms
Substances
LinkOut - more resources
Full Text Sources
Medical
Research Materials
Miscellaneous
