. 2020 Apr;97(4):556-566.
doi: 10.1111/cge.13706. Epub 2020 Jan 30.

Variants in NGLY1 lead to intellectual disability, myoclonus epilepsy, sensorimotor axonal polyneuropathy and mitochondrial dysfunction

Affiliations

Variants in NGLY1 lead to intellectual disability, myoclonus epilepsy, sensorimotor axonal polyneuropathy and mitochondrial dysfunction

Daan M Panneman et al. Clin Genet. 2020 Apr.

Abstract

NGLY1 encodes the enzyme N-glycanase that is involved in the degradation of glycoproteins as part of the endoplasmatic reticulum-associated degradation pathway. Variants in this gene have been described to cause a multisystem disease characterized by neuromotor impairment, neuropathy, intellectual disability, and dysmorphic features. Here, we describe four patients with pathogenic variants in NGLY1. As the clinical features and laboratory results of the patients suggested a multisystem mitochondrial disease, a muscle biopsy had been performed. Biochemical analysis in muscle showed a strongly reduced ATP production rate in all patients, while individual OXPHOS enzyme activities varied from normal to reduced. No causative variants in any mitochondrial disease genes were found using mtDNA analysis and whole exome sequencing. In all four patients, variants in NGLY1 were identified, including two unreported variants (c.849T>G (p.(Cys283Trp)) and c.1067A>G (p.(Glu356Gly)). Western blot analysis of N-glycanase in muscle and fibroblasts showed a complete absence of N-glycanase. One patient showed a decreased basal and maximal oxygen consumption rates in fibroblasts. Mitochondrial morphofunction fibroblast analysis showed patient specific differences when compared to control cell lines. In conclusion, variants in NGLY1 affect mitochondrial energy metabolism which in turn might contribute to the clinical disease course.

Keywords: NGLY1; OXPHOS enzyme activity; Seahorse respirometry; Whole exome sequencing; mitochondrial disorders.


Conflict of interest statement

J.S. is, next to this Radboudumc position, founding CEO of Khondrion. The company was not involved in this manuscript. W.J.H.K. is a scientific advisor of Khondrion BV (Nijmegen, the Netherlands) and of Fortify Therapeutics (Palo Alto, USA). These SMEs had no involvement in the data collection, analysis and interpretation, writing of the manuscript, and in the decision to submit the manuscript for publication.

Figures
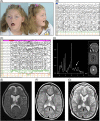
Figure 1
Figure 1
A, Patient 3 at the age of 11 years. Note the mild ptosis, expressionless facies and open mouth (myopathic face), the strabismus, long philtrum, the low implanted large, deformed ears, the midfacial hypoplasia, as well as the pointed chin and short forehead. B, Interictal EEG registration in patient 1 at the age of 7 years showing near‐continuous, multifocal epileptiform discharges with a frontocentral predominance. C, EEG registration in patient 3 at the age of 11 years, demonstrating abundant polyspikes, clinically correlated with frequent, randomly located myoclonic jerks, as well as periodic apneas. D, MR spectroscopy of patient 3 at the age of 11 years, showing mildly elevated lactate (indicated by white arrow) in the occipital white matter. E, Brain MRI, T2 weighted, of patient 1 at the age of 6 years, demonstrating the decreased white matter throughout the brain, and as a result, enlarged CSF compartments. F, Brain MRI, T2 weighted, of patient 4 at the age of 3 years. G, Brain MRI, T2 weighted, of patient 4 at the age of 8 years [Colour figure can be viewed at http://wileyonlinelibrary.com]
Figure 2
Figure 2
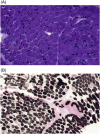
A, Haematoxylin‐phloxin staining of a muscle biopsy of patient 1, showing in general a normal morphology, but sporadically some smaller fibers. There are no basophilic fibers. B, ATPase staining (pH 4.2), showing a predominance of type 1 fibers (85% of all fibers; darkly stained fibers) [Colour figure can be viewed at http://wileyonlinelibrary.com]
Figure 3
Figure 3
Western blot analysis. A, Immunoblot analysis of NGLY1 in muscle extracts from four patients and three controls. The anti‐NGLY1 antibody stains a 74‐kDa band in the three controls, whereas this band is absent in the four patients. Anti‐SDHA (complex II) was used as loading control. B, Immunoblot analysis of NGLY1 in fibroblasts from four patients and three controls. Similar to the muscle sample, a NGLY1 band is present in the control samples, whereas this band is absent in the four tested patients. Anti‐SDHA (complex II) was used as loading control
Figure 4
Figure 4
Oxygen consumption measurements. Patient 4 shows a reduced basal and maximal cellular respiration showed a reduction in both basal respiration (P < .01) and maximal respiration (P < .001) in patient 4 only (n = 3). Oxygen consumption rates were normalized to citrate synthase activity
Figure 5
Figure 5
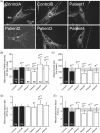
Mitochondrial membrane potential and morphology. A, Typical examples of TMRM‐stained fibroblasts from control individuals (Control A, Control B) and patients (Patient 1, Patient 2, Patient 3, Patient 4). B, Average mitochondrial TMRM fluorescence signal (Dm) in the fibroblasts cell lines. The gray box reflects the difference between the two control cell lines (Control A, Control B). C, Same as panel B but now for the average mitochondrial size (Am). D, Same as panel B but now for the average mitochondrial aspect ratio (AR). E, Same as panel B but now for the average mitochondrial form factor (F). Statistics: Images were contrast‐optimized for visualization purposes. Quantification was performed on the original images. Mean values + SD were calculated for each condition for the number of cells indicated in panel B, measured in three independent experiments. An independent Student's t‐test was used for statistical analysis (*P < .05; **P < .01; ***P < .001). The total number of mitochondrial objects analyzed for each condition equaled: 7145 (Control A), 114 212 (Control B), 8859 (Patient 1), 10 645 (Patient 2), 8744 (Patient 3) and 12 101 (Patient 4)

References

    1. Rahman S. Mitochondrial disease and epilepsy. Dev Med Child Neurol. 2012;54:397‐406. - PubMed
    1. de Siqueira LF. Progressive myoclonic epilepsies: review of clinical, molecular and therapeutic aspects. J Neurol. 2010;257:1612‐1619. - PubMed
    1. Enns GM, Shashi V, Bainbridge M, et al. Mutations in NGLY1 cause an inherited disorder of the endoplasmic reticulum‐associated degradation pathway. Gen Med. 2014;16:751‐758. - PMC - PubMed
    1. Caglayan AO, Comu S, Baranoski JF, et al. NGLY1 mutation causes neuromotor impairment, intellectual disability, and neuropathy. European Journal of Medical Genetics. 2014;58:39‐43. - PMC - PubMed
    1. Heeley J, Shinawi M. Multi‐systemic involvement in NGLY1‐related disorder caused by two novel mutations. Am J Med Genet A. 2015;167A:816‐820. - PubMed

Publication types

MeSH terms

Substances