. 2020 Jan 20:9:e53944.
doi: 10.7554/eLife.53944.

Loss of centromere function drives karyotype evolution in closely related Malassezia species

Affiliations

Loss of centromere function drives karyotype evolution in closely related Malassezia species

Sundar Ram Sankaranarayanan et al. Elife. .

Abstract

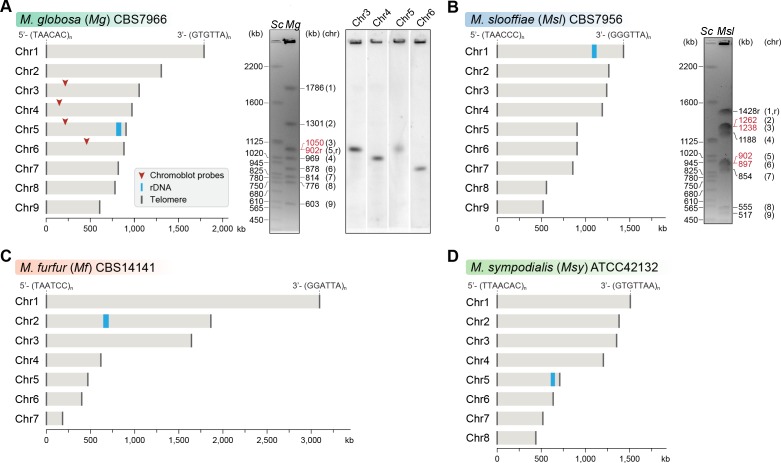
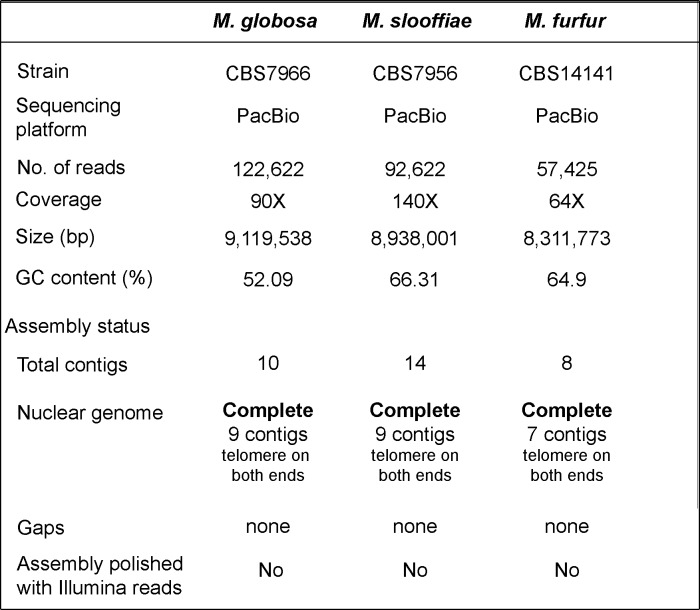
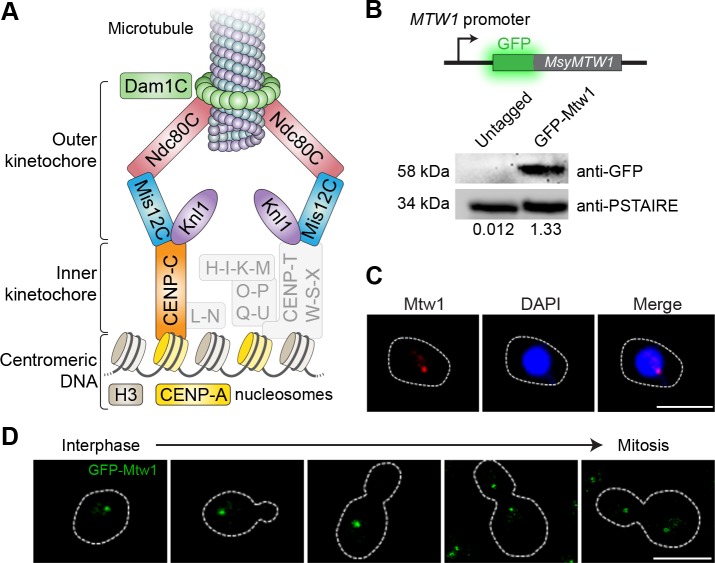
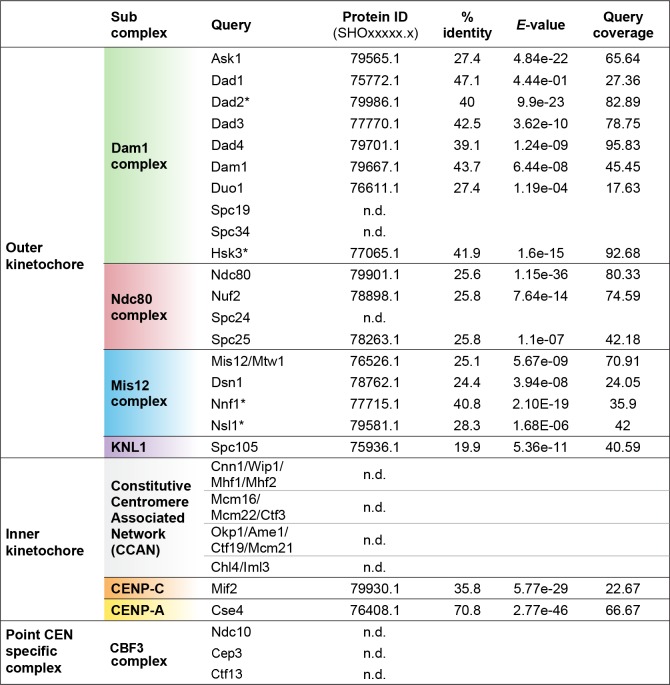
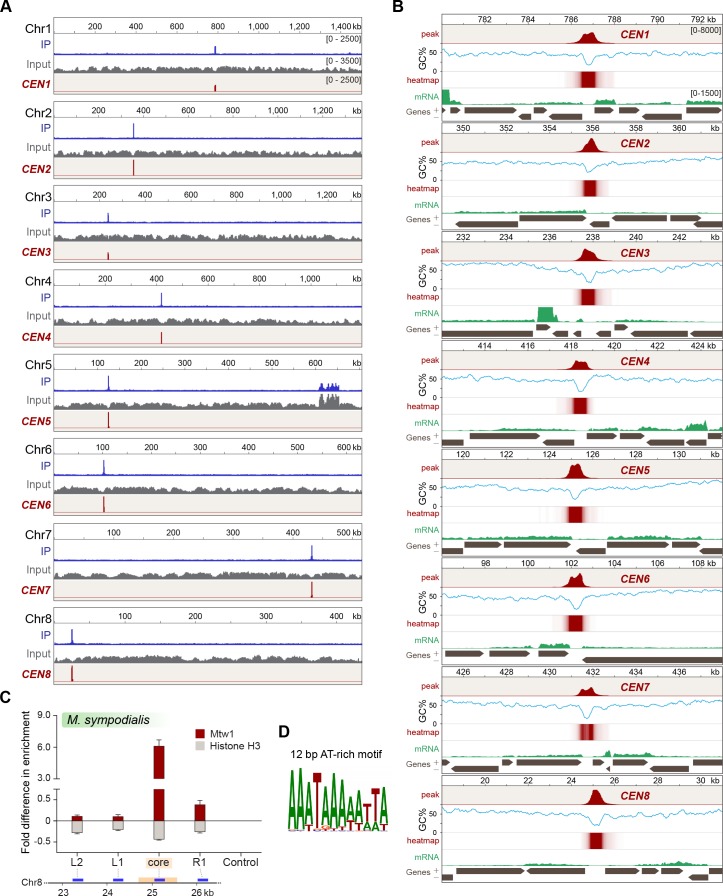
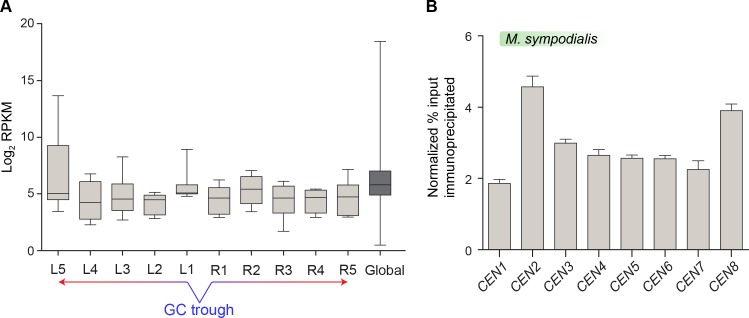
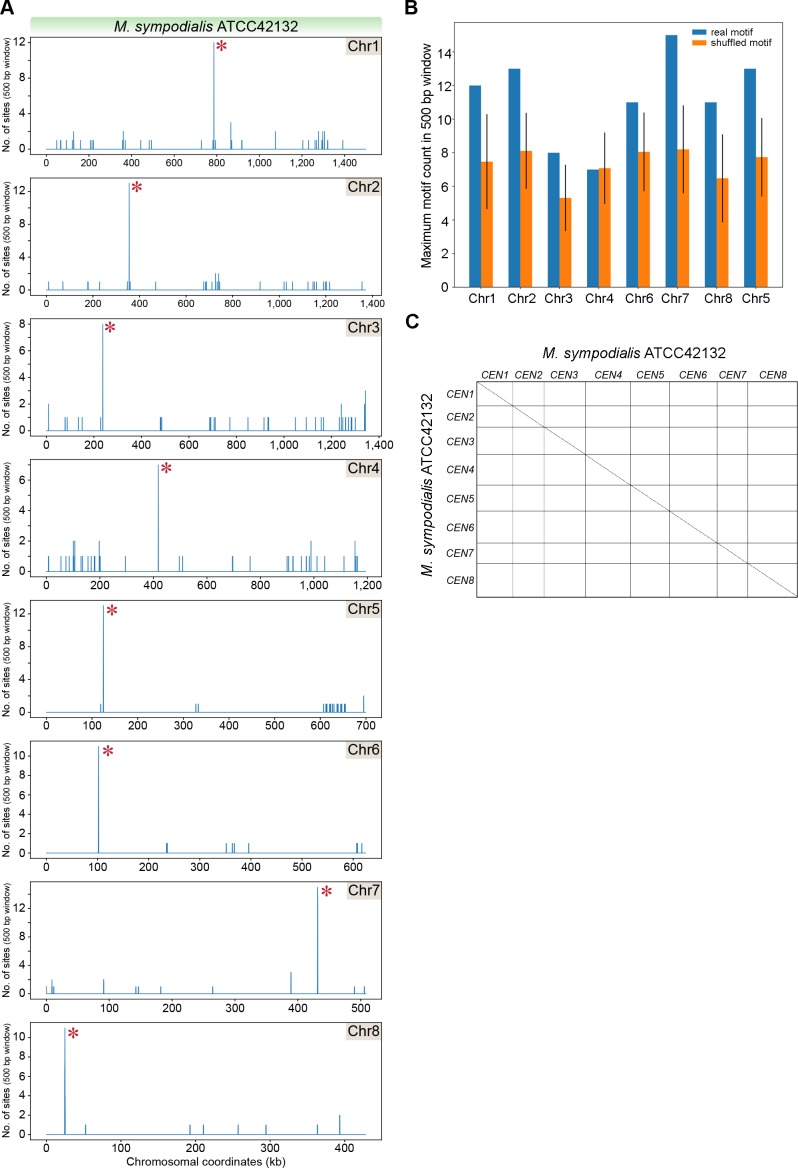
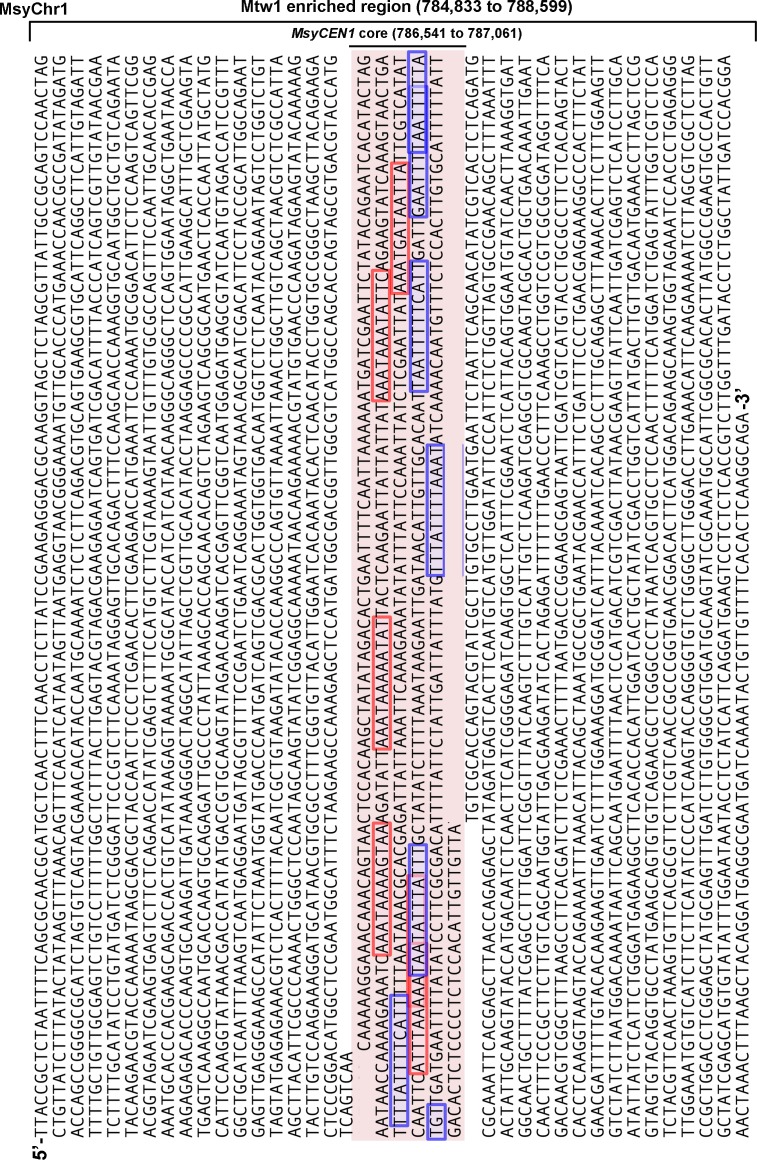
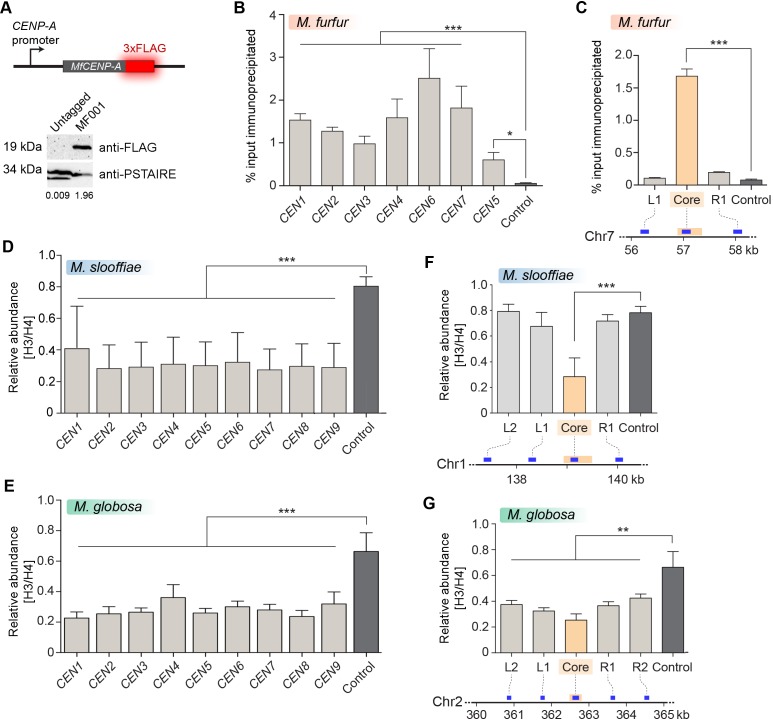
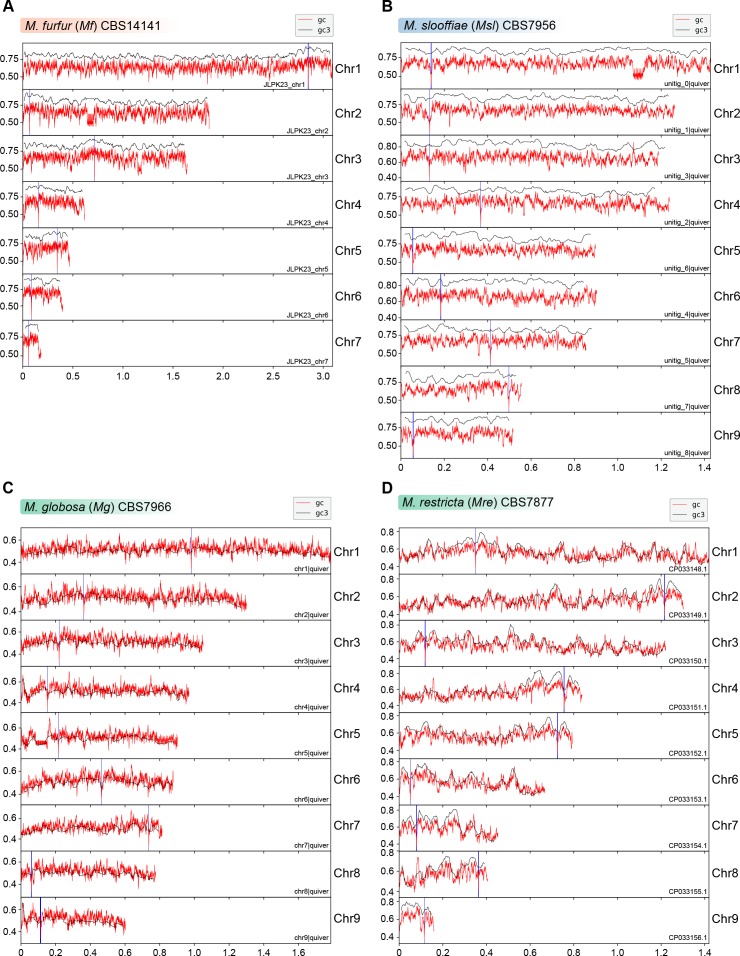
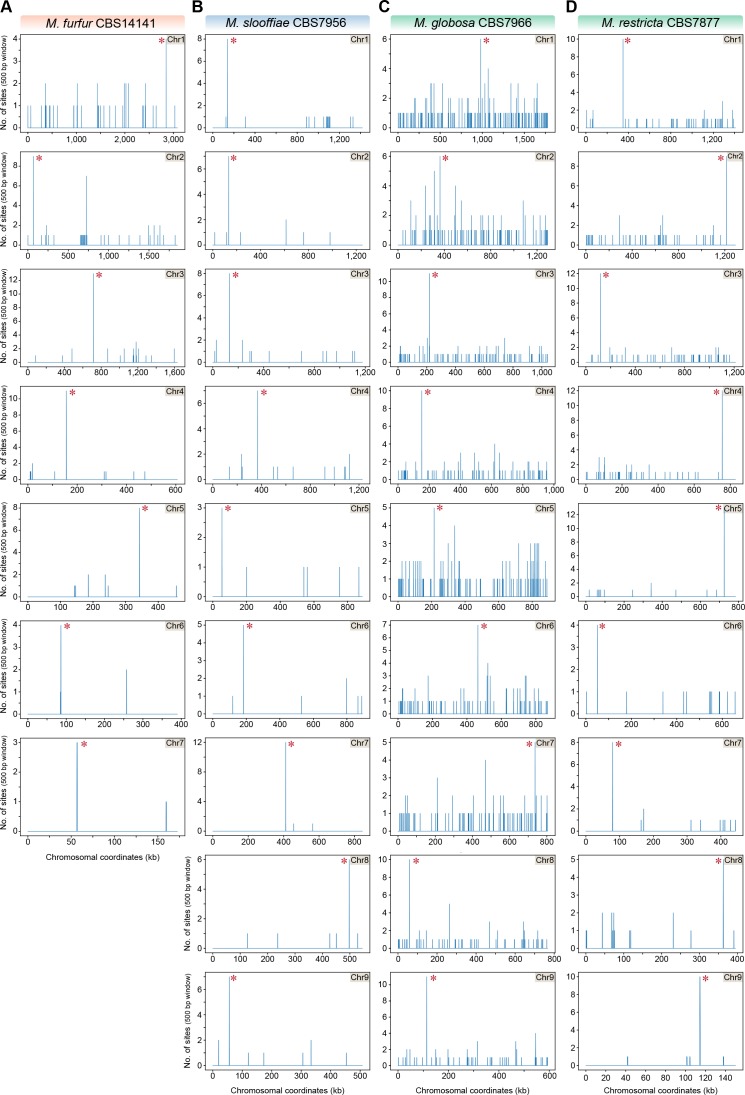
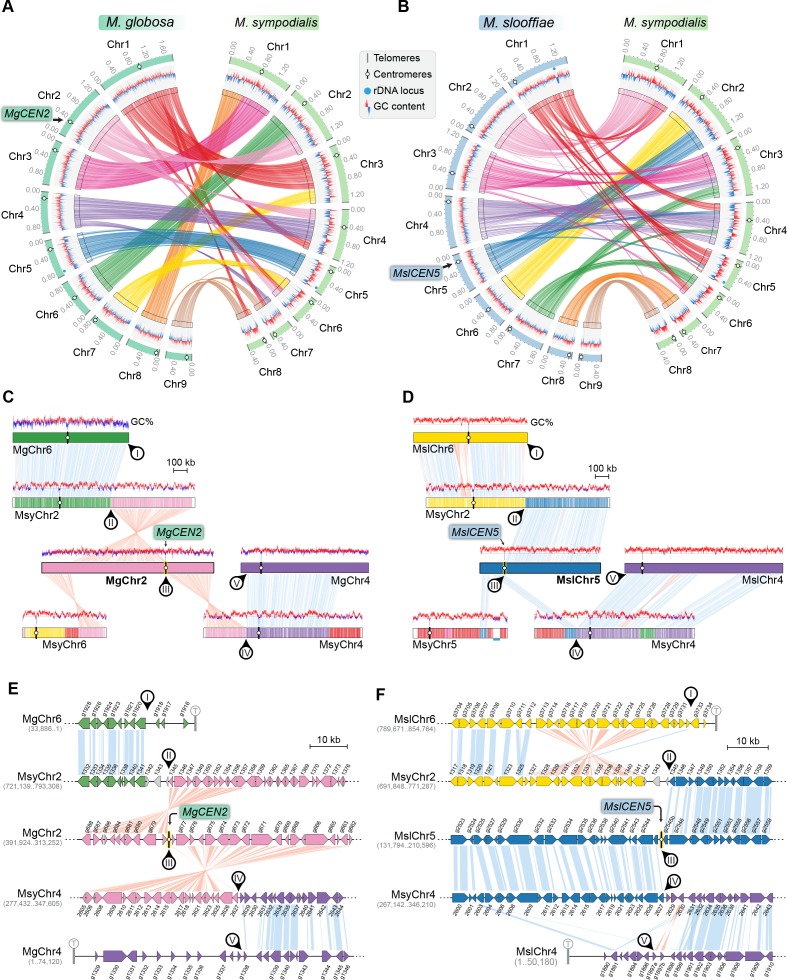
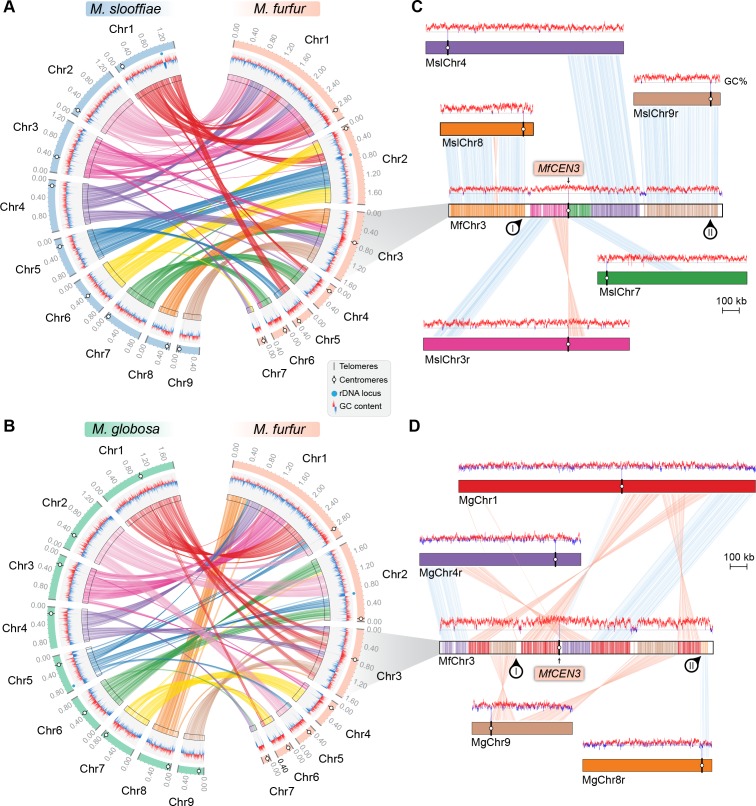
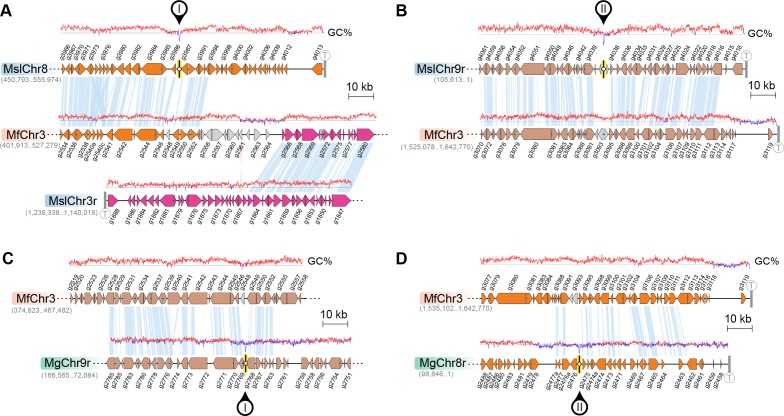
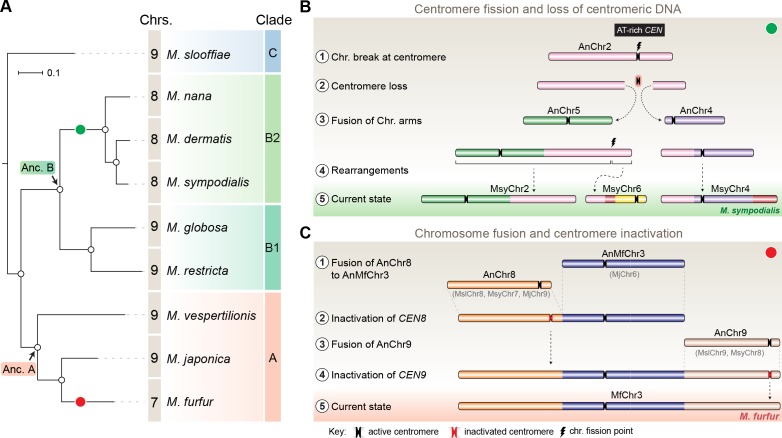
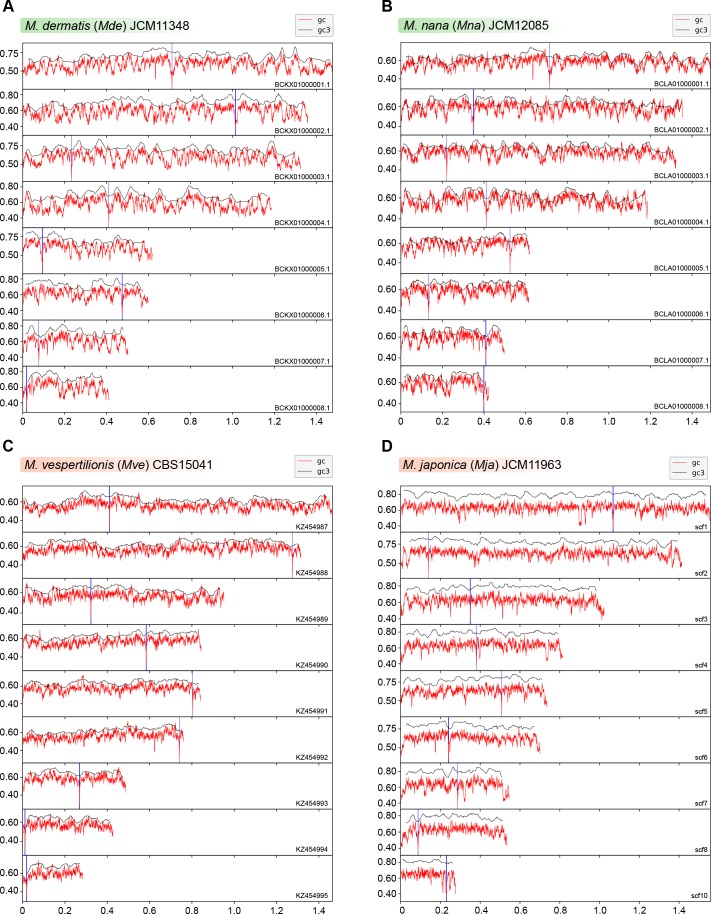
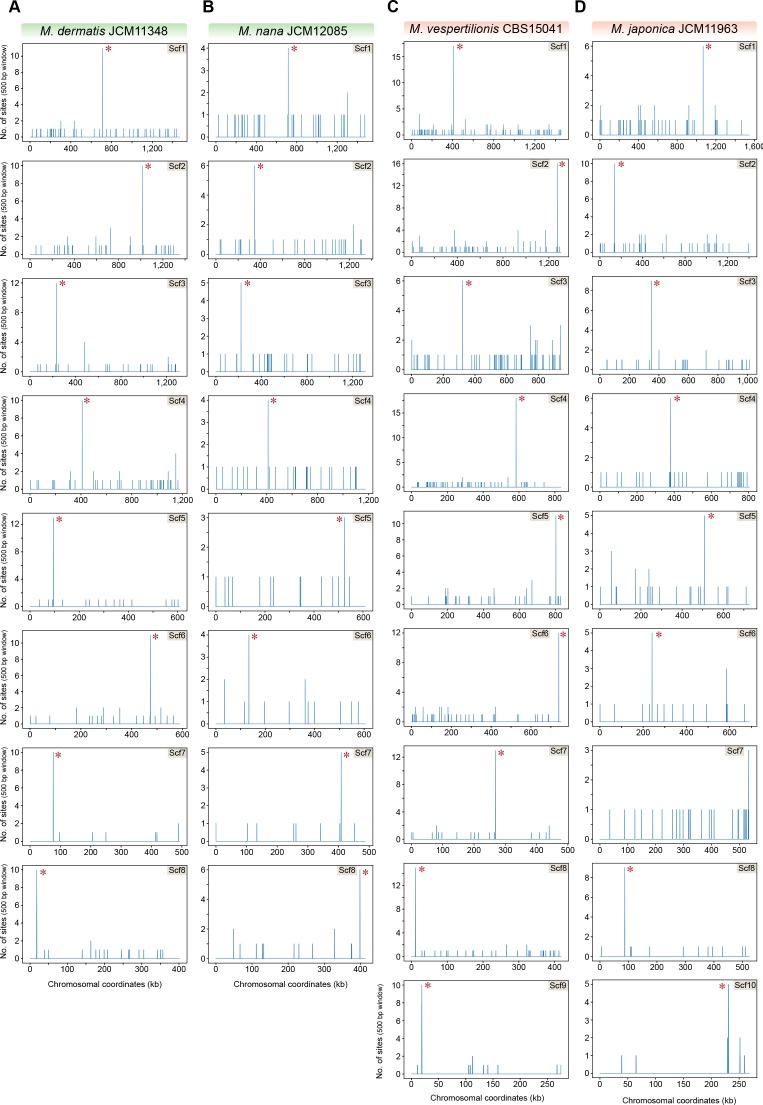
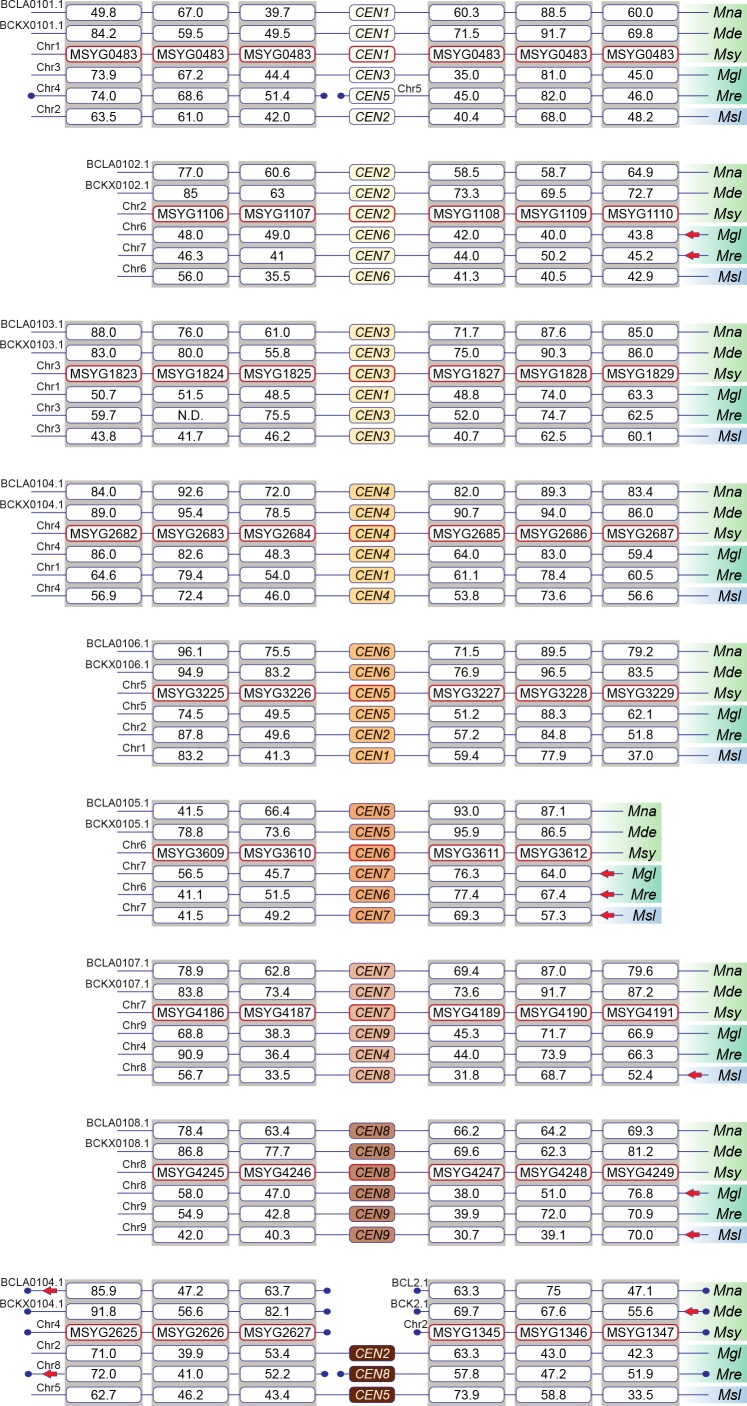
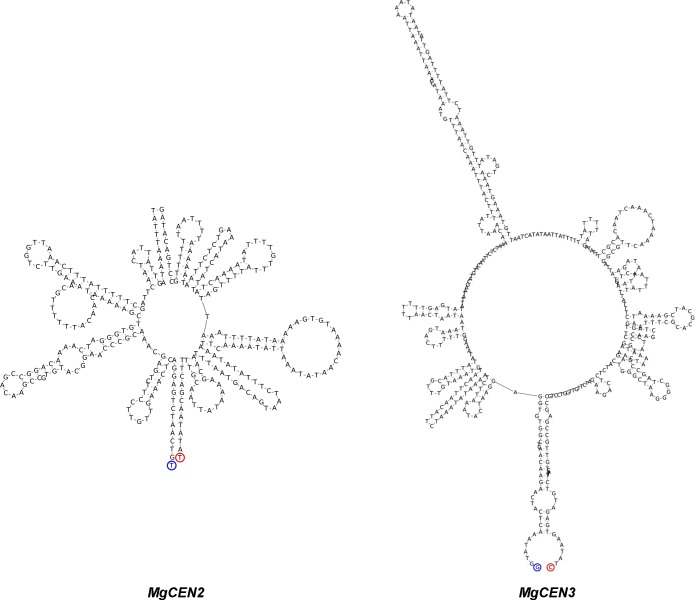
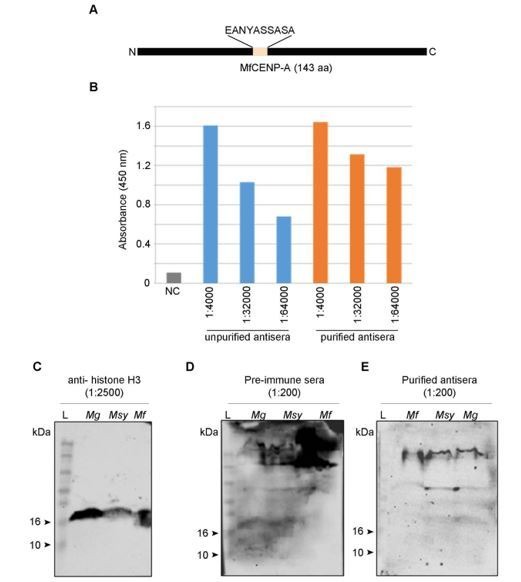
Genomic rearrangements associated with speciation often result in variation in chromosome number among closely related species. Malassezia species show variable karyotypes ranging between six and nine chromosomes. Here, we experimentally identified all eight centromeres in M. sympodialis as 3-5-kb long kinetochore-bound regions that span an AT-rich core and are depleted of the canonical histone H3. Centromeres of similar sequence features were identified as CENP-A-rich regions in Malassezia furfur, which has seven chromosomes, and histone H3 depleted regions in Malassezia slooffiae and Malassezia globosa with nine chromosomes each. Analysis of synteny conservation across centromeres with newly generated chromosome-level genome assemblies suggests two distinct mechanisms of chromosome number reduction from an inferred nine-chromosome ancestral state: (a) chromosome breakage followed by loss of centromere DNA and (b) centromere inactivation accompanied by changes in DNA sequence following chromosome-chromosome fusion. We propose that AT-rich centromeres drive karyotype diversity in the Malassezia species complex through breakage and inactivation.

Keywords: chromosome fusion; dicentric; double-strand breaks; genetics; genomics; kinetochore; skin microbe.

Plain language summary

Millions of yeast, bacteria and other microbes live in or on the human body. A type of yeast known as Malassezia is one of the most abundantmicrobes living on our skin. Generally, Malassezia do not cause symptoms in humans but are associated with dandruff, dermatitis and other skin conditions in susceptible individuals. They have also been found in the human gut, where they exacerbate Crohn’s disease and pancreatic cancer. There are 18 closely related species of Malassezia and all have an unusually small amount of genetic material compared with other types of yeast. In yeast, like in humans, the genetic material is divided among several chromosomes. The number of chromosomes in different Malassezia species varies between six and nine. A region of each chromosome known as the centromere is responsible for ensuring that the equal numbers of chromosomes are passed on to their offspring. This means that any defects in centromeres can lead to the daughter yeast cells inheriting unequal numbers of chromosomes. Changes in chromosome number can drive the evolution of new species, but it remains unclear if and how centromere loss may have contributed to the evolution of Malassezia species. Sankaranarayanan et al. have now used biochemical, molecular genetic, and comparative genomic approaches to study the chromosomes of Malassezia species. The experiments revealed that nine Malassezia species had centromeres that shared common features such as being rich in adenine and thymine nucleotides, two of the building blocks of DNA. Sankaranarayanan et al. propose that these adenines and thymines make the centromeres more fragile leading to occasional breaks. This may have contributed to the loss of centromeres in some Malassezia cells and helped new species to evolve with fewer chromosomes. A better understanding of how Malassezia organize their genetic material should enable in-depth studies of how these yeasts interact with their human hosts and how they contribute to skin disease, cancer, Crohn’s disease and other health conditions. More broadly, these findings may help scientists to better understand how changes in chromosomes cause new species to evolve.


Conflict of interest statement

SS, GI, MC, MR, BT, PG, RV, SS, RS, CT, TD, JH, KS No competing interests declared

Figures

Figure 1.
Figure 1.. Genome assembly and karyotype diversity in representative Malassezia species.
The genomes of (AM. globosa, (BM. slooffiae, and (C) M. furfur were sequenced and assembled in this study, whereas the genome assembly of (D) M. sympodialis was reported earlier (Zhu et al., 2017) and is shown for comparison. In each panel, bar plots represent the assembled chromosomes of the indicated Malassezia species, with the telomeres and the ribosomal DNA (rDNA) marked as dark gray and blue bars, respectively. Telomere-repeat motifs are shown at the 5′- and 3′-ends of the Chr1 in each species. Electrophoretic karyotypes of M. globosa (Mg) and M. sloffiiae (Msl), are shown in (A) and (B), respectively, with chromosome sizes estimated from the genome assembly. Chromosomes of Saccharomyces cerevisiae (Sc) served as size markers. The chromosome containing the rDNA (marked with an ‘r’), in M. globosa, co-migrates with Chr3. This was assessed by chromoblot hybridization using unique sequences from Chr3, Chr4, Chr5, and Chr6 as probes (regions indicated by red arrowheads). Chromosomes of similar size (denoted in red) migrate together in the gel and appear as a doublet band (i.e. MgChr3–MgChr5, MslChr2–MslChr3, and MslChr5–MslChr6).
Figure 1—figure supplement 1.
Figure 1—figure supplement 1.. Statistics of the genome assemblies of M. globosa, M. slooffiae, and M. furfur generated in this study.
Figure 2.
Figure 2.. Kinetochores cluster and localize at the nuclear periphery in M. sympodialis.
(A) Schematic of the kinetochore organization of M. sympodialis. Gray boxes indicate proteins absent in M. sympodialis. The outer kinetochore protein Mtw1 (a component of Mis12C) served as the kinetochore marker in the present study. (B) Line diagram representation of Mtw1 tagged with GFP at the N- terminus. Immunoblot analysis of whole-cell lysates prepared from the untagged M. sympodialis strain (ATCC42132) and from GFP-Mtw1 expressing cells (MSY001) probed with anti-GFP antibodies and anti-PSTAIRE antibodies. PSTAIRE served as a loading control. Relative intensity values normalized to PSTAIRE are indicated below each lane. (C) Logarithmically grown MSY001 cells expressing GFP-Mtw1 were fixed and stained with DAPI (blue) and anti-GFP antibodies (pseudo-colored in red). Scale bar, 2.5 µm. (D) Cell cycle stage-specific localization dynamics of GFP-Mtw1. Scale bar, 2.5 µm.
Figure 2—figure supplement 1.
Figure 2—figure supplement 1.. Identification of kinetochore proteins in M. sympodialis by BLAST.
Putative homologs of the indicated proteins in M. sympodialis were identified by BLAST analysis using corresponding protein sequences of C. neoformans as the query. An asterisk (*) indicates cases where corresponding protein sequences from Ustilago maydis were used as query. To detect proteins of the CBF3 complex, protein sequences of Ndc10, Cep3, and Ctf13 from S. cerevisiae were used as query. ‘n.d.’ indicates homolog not detected.
Figure 3.
Figure 3.. Localization of Mtw1 to single-peaks identifies centromeres on each of the eight chromosomes of M. sympodialis.
(A) GFP-Mtw1 ChIP-seq reads were mapped to each chromosome. The x-axis indicates chromosomal coordinates (in kb) and the y-axis indicates read depth. ‘Input’, reads from total DNA; ‘IP,’ reads from immunoprecipitated sample; CEN, Mtw1-enriched regions derived by subtracting input reads from those of the IP sample (peak values 0–2500). Additional peaks observed in both IP and input tracks on Chr5 are from the rDNA locus. (B) A 13 kb-window of the Mtw1 enrichment profile (CEN, represented as peaks and heat-map in two different tracks, red) plotted along with the GC content (%GC, blue) and regions of transcription (RNA-seq, green). Numbers in the topmost track in every panel indicate chromosomal coordinates (in kb). The scales for the y-axis are as follows: CEN (0–8000), %GC (0–75), RNA-seq reads (0–1500). Gray arrows in each panel indicate predicted ORFs based on RNA-seq data with arrowheads indicating the direction of transcription of the corresponding gene, also marked as ‘+’ and ‘–’ in the axis label. (C) Fold difference in Mtw1 and histone H3 enrichment at CEN8, as compared to a non-centromeric control region (190 kb away on the right of CEN1) by qPCR analysis. Schematic of a 4-kb region of Chr8 with the CEN8 core (yellow box) is depicted below the graph. Blue lines indicate regions assayed by PCR: core-region corresponding to the GC trough; L1 and R1, 750 bp away from the core; L2, 1500 bp away from the core; and a non-centromeric control region (190 kb away from centromere in Chr1). The x-axis indicates regions across the CEN8 probed by PCR and the y-axis indicates fold difference in the enrichment of Mtw1 and histone H3 as compared to the control region. Error bars indicate standard deviations (SD). Values from three experiments, each performed with three technical replicates, were used to generate the plot. (D) Logo of the consensus DNA sequence identified from M. sympodialis centromeres, graphically represented with the size of the base corresponding with the frequency of occurrence.
Figure 3—figure supplement 1.
Figure 3—figure supplement 1.. Mtw1-enriched regions in M. sympodialis contain transcriptionally active genes.
(A) Normalized read counts (RPKM) for transcripts from ORFs flanking the centromere as compared with the genome average RPKM value calculated from RNA-seq data of M. sympodialis (ATCC42132). The x-axis represents ORFs labeled L1–L5 and R1–R5, with L1 and R1 being proximal to the GC trough of the centromere. The genome average considered for comparison is labeled as global. The y-axis represents Log2 RPKM values. (B) ChIP-qPCR assays validating the enrichment of Mtw1 at the centromeres identified by ChIP-sequencing analysis. The x-axis indicates individual CEN regions assayed with primers mapping to the chromosomal GC troughs (see Supplementary file 1 for primer sequences) and the y-axis indicates enrichment of Mtw1 over a centromere-unlinked control region as ‘normalized % input immunoprecipitated’. Values from three experiments, each performed with three technical replicates, were used to generate the plot. Error bars indicate standard deviations (SD).
Figure 3—figure supplement 2.
Figure 3—figure supplement 2.. Sequence features of centromeres in M. sympodialis.
(A) The genome of M. sympodialis was scanned for matches to the 12-bp AT-rich motif using a 500 bp sliding window. Hit counts (y-axis) were plotted against the chromosomal coordinates (x-axis, in kb). Red asterisks near the line corresponding to maximum enrichment in every chromosome mark the regions predicted as centromeres. (B) Comparison of the maximum motif counts in a 500-bp window in each M. sympodialis chromosome (y-axis) estimated with the position weight matrix (PWM) of the 12 bp motif (blue bars, labeled real) and a scrambled version of the matrix (orange bars, labeled shuffled). The x-axis indicates individual chromosomes in M. sympodialis. (C) A dot-plot generated by plotting sequences that include 5 kb flanking the Mtw1-enriched regions in M. sympodialis against themselves is depicted. The coordinates of regions used in M. sympodialis are: CEN1, 781716–791716; CEN2, 350852–360852; CEN3, 232777–242777; CEN4, 413320–423320; CEN5, 120251–130251; CEN6, 97796–107796; CEN7, 426611–436611; and CEN8, 19905–29905.
Figure 3—figure supplement 3.
Figure 3—figure supplement 3.. Enrichment of the 12-bp motif at the centromere core in M. sympodialis.
The sequences corresponding to the Mtw1-enriched regions in Chr1 (with the AT-rich core region highlighted in pink) are taken as being representative of M. sympodialis centromeres. The sequences corresponding to the 12-bp motif shown in Figure 3D are highlighted. Red and blue boxes highlight the forward and reverse orientation of motif occurrence.
Figure 4.
Figure 4.. Centromeres in M. furfur, M. slooffiae, and M. globosa map to global GC troughs on each chromosome.
(A) Schematic of epitope tagging of CENP-A with 3xFLAG at the C-terminus. (Bottom) Immunoblot analysis using whole-cell lysates prepared from the untagged wild-type M. furfur (CBS14141) cells and CENP-A-3xFLAG expressing cells (MF001) probed with anti-FLAG antibodies and anti-PSTAIRE antibodies. PSTAIRE served as the loading control. (B) Abundance of CENP-A at each of the predicted M. furfur centromeres by qPCR analysis of DNA immunoprecipitated with anti-FLAG affinity gel in MF001 cells expressing CENP-A-3xFLAG. The x-axis indicates individual CEN regions assayed with primers that are homologous to the GC troughs on each chromosome that were predicted to be centromeres (see Supplementary file 1 for primer sequences). The non-centromeric control sequence maps to a region 1.3 Mb away from predicted CEN1. The y-axis indicates enrichment of CENP-A estimated as the percentage of input immunoprecipitated. (C) Abundance of CENP-A across MfCEN7 by ChIP-qPCR analysis in MF001 cells. A schematic representation of a 2-kb region is shown below the graph. The yellow bar indicates the centromere core of CEN7 corresponding to the GC trough. Blue bars indicate regions analyzed by qPCR: L1 and R1, which are 750 bp away from the centromere core. ‘Control’ refers to a region 1.3 Mb away from CEN1. CENP-A enrichment is plotted along the y-axis as the percentage of input immunoprecipitated. (D, E) Comparison of the relative abundance of histone H3 compared to histone H4 at the predicted centromeres to a non-centromeric control locus in M. slooffiae (D) and M. globosa (E), respectively. Enrichment was estimated as the percentage of input immunoprecipitated with histone H3 and histone H4 antibodies and their ratio is plotted as relative enrichment (y-axis). The x-axis indicates centromeres in each species and these were assayed with primers homologous to GC troughs (i.e. predicted centromeres) in each chromosome (see Supplementary file 1 for primer sequences). The control region that is unlinked to the centromere corresponds to a locus 630 kb away from CEN1 in M. slooffiae and 416 kb away from CEN2 in M. globosa. (F) The relative abundance of histone H3 compared to histone H4 across MslCEN1 as determined by qPCR analysis of the DNA immunoprecipitated using histone H3 and histone H4 antibodies. A schematic of the MslCEN1 locus is shown below the graph. The yellow bar indicates the CEN1 core region corresponding to the GC trough. Blue bars indicate regions analyzed by qPCR: L1 and L2 map to regions 750 bp and 1.5 kb to the left of the CEN1 core; R1 maps to a region 750 bp to the right of the CEN1 core. The control region corresponds to a locus 630 kb away from the CEN1 core. The ratio of enrichment of histone H3 to that of histone H4 is plotted as the relative enrichment (y-axis). (G) The relative abundance of histone H3 compared to histone H4 across MgCEN2 by qPCR analysis of the DNA immunoprecipitated using histone H3 and histone H4 antibodies. A schematic of a 5-kb region containing MgCEN2 is shown below the graph. The yellow bar indicates the CEN2 core region corresponding to the GC trough. Blue bars indicate regions analyzed by qPCR: L1 and L2 indicate regions 750 bp and 1.5 kb to the left of the CEN2 core; R1 and R2 indicate regions 750 bp and 1.5 kb to the right of the CEN2 core. The control region corresponds to a locus 416 kb away from the CEN2 core. The ratio of enrichment of histone H3 to that of histone H4 is plotted as the relative enrichment (y-axis). Values from three experiments, each performed with three technical replicates, were used to generate the plots in panels (B–G). Error bars indicate standard deviations (SD). Statistical significance was tested by one-way ANOVA: *, significant at p<0.05, *** , significant at p<0.001.
Figure 4—figure supplement 1.
Figure 4—figure supplement 1.. Putative centromeres of M. furfur, M. slooffiae, M. globosa, and M. restricta map to global GC troughs in each chromosome.
(A–D) Graphs indicating the GC content (red lines) and GC3 content (black lines) of each chromosome of M. furfur, M. slooffiae, M. globosa, and M. restricta. The GC3 content is measured by estimating the G or C content at the third position in each codon of all genes across a chromosome (Lynch et al., 2010; Zhu et al., 2017). Position of putative centromeres mapping to chromosomal GC minima are marked in blue. The x-axis indicates chromosomal coordinates in Mb.
Figure 4—figure supplement 2.
Figure 4—figure supplement 2.. The 12-bp AT-rich motif is enriched at the putative centromeres of M. furfur, M. slooffiae, M. globosa, and M. restricta.
(A–D) The genomes of M. furfur, M. slooffiae, M. globosa, and M. restricta were scanned for matches to the 12-bp AT-rich motif using a 500-bp sliding window. Hit counts (y-axis) were plotted against the chromosomal coordinates (x-axis, in kb) for each of the above species. Red asterisks near the line corresponding to maximum enrichment in every chromosome or scaffold mark the regions predicted as centromeres in each species.
Figure 5.
Figure 5.. MgCEN2 and MslCEN5 map to a synteny breakpoint in M. sympodialis.
(A, B) Circos plots depicting the gene synteny blocks that are conserved between M. globosa and M. sympodialis chromosomes and between M. slooffiae and M. sympodialis chromosomes. Tracks from outside to inside represent the positions of centromeres and telomeres, GC content (plotted as blue and red lines indicating GC content below or above genome average, calculated in 0.4-kb non-overlapping windows), and colored connectors indicate regions of conserved gene synteny between the two species. (C, D) Linear chromosome plots depicting syntenic regions between Chr2 of M. globosa and Chr5 of M. slooffiae with chromosomes of M. sympodialis. GC content (in %) is shown as red/blue lines above each chromosome. Circular labels mark the gene synteny breakpoints. The synteny breakpoint at MgCEN2 and MslCEN5 is marked as III. The regions on MsyChr2 and MsyChr4 where the homologs of ORFs flanking the breakpoint are located are marked II and IV, respectively. Labels I and V indicate gene synteny conservation on the other side of the fusion points II and IV on MsyChr2 and MsyChr4 as compared to M. globosa and M. slooffiae chromosomes, respectively. (E, F) Zoomed-in image of the gene synteny breakpoint at MgCEN2 and MslCEN5, representing the conservation of genes flanking these centromeres in M. sympodialis chromosomes at the ORF level.
Figure 6.
Figure 6.. Inactivation of CEN8 and CEN9 of M. slooffiae and M. globosa in MfChr3 resulted in reduction in chromosome number in M. furfur.
(A, B) Circos plots depicting the gene synteny blocks that are conserved between the M. slooffiae or M. globosa chromosomes and the M. furfur chromosomes. Tracks from outside to inside represent positions of centromeres and telomeres, GC content (plotted as blue and red lines indicating GC content below or above genome average, calculated in 0.4-kb non-overlapping windows), and colored connectors indicate regions of conserved gene synteny between each pair of two species. (C) Linear chromosome plot depicting the regions that show synteny between Chr3 of M. furfur and Chr3, Chr4, Chr7, Chr8, and Chr9 of M. slooffiae. GC content (in %) is shown as red/blue lines above each chromosome. Regions corresponding to MslCEN8 and MslCEN9 in MfChr3 are marked I and II, respectively. (D) Linear chromosome plot depicting the conservation of gene synteny between Chr3 of M. furfur and Chr1, Chr4, Chr8, and Chr9 of M. globosa. Regions corresponding to MgCEN9 and MgCEN8 in MfChr3 are marked I and II, respectively.
Figure 6—figure supplement 1.
Figure 6—figure supplement 1.. Loss of AT-content in regions corresponding to CEN8 and CEN9 of M. slooffiae and M. globosa in MfChr3.
(A, B) Zoomed-in view of regions marked I (A) and II (B) in Figure 6C, corresponding to inactivated MslCEN8 and MslCEN9 in M. furfur, respectively, along with the regions of gene synteny are represented. GC content (in %) is shown as a red/blue line diagram above each chromosome. (C, D) Zoomed-in view of the regions marked I (C) and II (D) in Figure 6D, corresponding to inactivated MgCEN9 and MgCEN8 in M. furfur, respectively, along with the regions of gene synteny are represented. GC content (in %) is shown as red/blue lines above each chromosome.
Figure 7.
Figure 7.. Karyotype evolution by loss of centromere function in Malassezia species.
(A) Phylogenetic relationships between the Malassezia species analyzed in this study are represented and their chromosome numbers are shown. Species representing each clade are color-coded on the basis of previous reports (Theelen et al., 2018). The chromosome numbers for M. slooffiae and M. globosa are based on results from this study. In the case of M. sympodialis, M. restricta, and M. furfur, the chromosome numbers are based on previous reports (Boekhout and Bosboom, 1994; Senczek et al., 1999; Zhu et al., 2017). For M. dermatis, M. nana, M. vespertilionis, and M. japonica, the number of chromosomes were estimated from the predicted number of centromeres. The nodes corresponding to the ancestral state for Clade A and Clade B are labeled ‘Anc. A’ and ‘Anc. B’, respectively. Green and red circles indicate the origins of karyotypes that have eight and seven chromosomes, respectively, from an ancestral state of nine chromosomes. (B) Schematic of the centromere loss by breakage and the resulting reduction in chromosome number as observed in M. sympodialis (represented as the current state). A karyotype with nine chromosomes (as shown for M. globosa) is depicted as the ancestral state. (C) Proposed model of centromere inactivation observed in M. furfur as a consequence of fusion of AnChr8 and AnChr9 to the AnMfChr3 equivalent, resulting in a seven-chromosome configuration. The fusion product corresponding to extant MfChr3 is represented as the current state.
Figure 7—figure supplement 1.
Figure 7—figure supplement 1.. Putative centromeres of M. dermatis, M. nana, M. vespertilionis, and M. japonica map to global GC troughs in each chromosome.
(A–D) Graphs indicating the GC content (red lines) and GC3 content (black lines) of each chromosome of M. dermatis, M. nana, M. vespertilionis, and M. japonica. The positions of putative centromeres mapping to chromosomal GC minima are marked in blue. The x-axis indicates chromosomal coordinates in Mb.
Figure 7—figure supplement 2.
Figure 7—figure supplement 2.. The 12-bp AT-rich motif is enriched at the putative centromeres of M. dermatis, M. nana, M. vespertilionis, and M. japonica.
The genomes of M. dermatis, M. nana, M. vespertilionis, and M. japonica were scanned for matches to the 12-bp AT-rich motif using a 500 bp sliding window. Hit counts (y-axis) were plotted against the chromosomal coordinates (x-axis, in kb) for each of the above species. Red asterisks near the line corresponding to maximum enrichment in every chromosome or scaffold mark the regions predicted as centromeres in each species.
Figure 7—figure supplement 3.
Figure 7—figure supplement 3.. All of the predicted centromeres of M. sympodialis, M. nana, and M. dermatis belong to gene synteny blocks that are also conserved in species containing nine chromosomes.
The gene order and synteny of ORFs flanking the centromeres of six Malassezia species, which are representative of clades B and C, analyzed by BLAST analysis using the protein sequences from M. sympodialis as query. Species included are: Mna, M. nana; Mde, M. dermatis; Msy, M. sympodialis; Mgl, M. globosa; Mre, M. restricta; and Msl, M. slooffiae. Chromosome/scaffold numbers are indicated at the start of every track. Boxes represent ORFs with the numbers inside them indicating percentage identity from BLAST analysis. Broken lines marked with a filled circle towards the ends indicate gene synteny breakpoints. Red arrows indicate inverted orientation of the scaffold/chromosome.
Figure 7—figure supplement 4.
Figure 7—figure supplement 4.. MgCEN2 and MgCEN3 are predicted to form secondary structures.
The secondary structure of the centromere cores of MgCEN2 and MgCEN3 predicted by the ViennaRNA, generated using Geneious 9.0 (Lorenz et al., 2011). Blue and red circles mark the 5′- and the 3′- DNA ends, respectively.
Author response image 1.
Author response image 1.. Figure corresponding to the generation of antibodies against CENP-A in Malassezia species.
(A) A line diagram of MfCENP-A indicating the peptide sequence (EANYASSASA) at positions 75-84 aa used for generation of antibodies in rabbit. (B) Detection of the peptide epitope by antibodies before and after purification by ELISA. For this assay, 50 ng peptide was coated in each well and probed with varying dilutions of the antisera (1:4000, 1:32000, 1:64000). Absorbance at 450 nm was recorded after the addition of stopping solution and absorbance values are plotted for each sample in the y-axis. NC- no antigen control, (C–E) whole cell extracts from M. globosa (Mg, CBS7966 strain), M. sympodialis (Msy, ATCC42132 strain) and M. furfur (Mf, CBS14141 strain) were probed with pre-immune sera, purified CENP-A antisera, and histone H3 antisera in various dilutions as indicated. Lane L denotes the protein molecular weight markers. Both pre-immune sera and the purified antibodies were tested at a dilution of 1:200 while histone H3 antibodies were used at 1:2500 dilution.

References

    1. Amend A. From dandruff to deep-sea vents: Malassezia-like fungi are ecologically hyper-diverse. PLOS Pathogens. 2014;10:e1004277. doi: 10.1371/journal.ppat.1004277. - DOI - PMC - PubMed
    1. Aykut B, Pushalkar S, Chen R, Li Q, Abengozar R, Kim JI, Shadaloey SA, Wu D, Preiss P, Verma N, Guo Y, Saxena A, Vardhan M, Diskin B, Wang W, Leinwand J, Kurz E, Kochen Rossi JA, Hundeyin M, Zambrinis C, Li X, Saxena D, Miller G. The fungal mycobiome promotes pancreatic oncogenesis via activation of MBL. Nature. 2019;574:264–267. doi: 10.1038/s41586-019-1608-2. - DOI - PMC - PubMed
    1. Barraclough TG, Birky CW, Burt A. Diversification in sexual and asexual organisms. Evolution. 2003;57:2166–2172. doi: 10.1111/j.0014-3820.2003.tb00394.x. - DOI - PubMed
    1. Bensasson D, Zarowiecki M, Burt A, Koufopanou V. Rapid evolution of yeast centromeres in the absence of drive. Genetics. 2008;178:2161–2167. doi: 10.1534/genetics.107.083980. - DOI - PMC - PubMed
    1. Boekhout T, Kamp M, Guého E. Molecular typing of Malassezia species with PFGE and RAPD. Medical Mycology. 1998;36:365–372. doi: 10.1080/02681219880000581. - DOI - PubMed

Publication types