

Survival, Nonrelapse Mortality, and Relapse-Related Mortality After Allogeneic Hematopoietic Cell Transplantation: Comparing 2003-2007 Versus 2013-2017 Cohorts
- PMID: 31958813
- PMCID: PMC7847247
- DOI: 10.7326/M19-2936
Survival, Nonrelapse Mortality, and Relapse-Related Mortality After Allogeneic Hematopoietic Cell Transplantation: Comparing 2003-2007 Versus 2013-2017 Cohorts
Abstract
Background: Allogeneic hematopoietic cell transplantation is indicated for refractory hematologic cancer and some nonmalignant disorders. Survival is limited by recurrent cancer and organ toxicity.
Objective: To determine whether survival has improved over the past decade and note impediments to better outcomes.
Design: The authors compared cohorts that had transplants during 2003 to 2007 versus 2013 to 2017. Survival outcome measures were analyzed, along with transplant-related complications.
Setting: A center performing allogeneic transplant procedures.
Participants: All recipients of a first allogeneic transplant during 2003 to 2007 and 2013 to 2017.
Intervention: Patients received a conditioning regimen, infusion of donor hematopoietic cells, then immunosuppressive drugs and antimicrobial approaches to infection control.
Measurements: Day-200 nonrelapse mortality (NRM), recurrence or progression of cancer, relapse-related mortality, and overall mortality, adjusted for comorbidity scores, source of donor cells, donor type, patient age, disease severity, conditioning regimen, patient and donor sex, and cytomegalovirus serostatus.
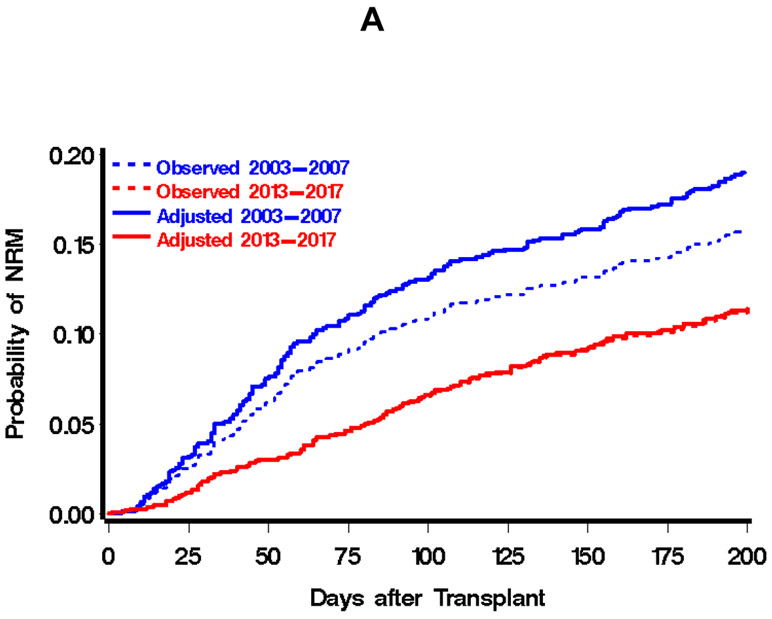
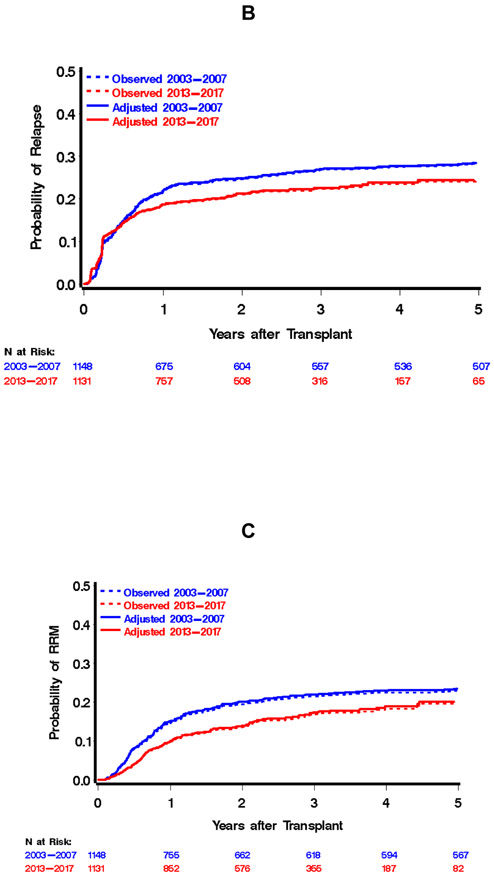
Results: During the 2003-to-2007 and 2013-to-2017 periods, 1148 and 1131 patients, respectively, received their first transplant. Over the decade, decreases were seen in the adjusted hazards of day-200 NRM (hazard ratio [HR], 0.66 [95% CI, 0.48 to 0.89]), relapse of cancer (HR, 0.76 [CI, 0.61 to 0.94]), relapse-related mortality (HR, 0.69 [CI, 0.54 to 0.87]), and overall mortality (HR, 0.66 [CI, 0.56 to 0.78]). The degree of reduction in overall mortality was similar for patients who received myeloablative versus reduced-intensity conditioning, as well as for patients whose allograft came from a matched sibling versus an unrelated donor. Reductions were also seen in the frequency of jaundice, renal insufficiency, mechanical ventilation, high-level cytomegalovirus viremia, gram-negative bacteremia, invasive mold infection, acute and chronic graft-versus-host disease, and prednisone exposure.
Limitation: Cohort studies cannot determine causality, and current disease severity criteria were not available for patients in the 2003-to-2007 cohort.
Conclusion: Improvement in survival and reduction in complications were substantial after allogeneic transplant. Relapse of cancer remains the largest obstacle to better survival outcomes.
Primary funding source: National Institutes of Health.
Figures

Comment in
-
Patient Outcomes After Bone Marrow Transplant.Ann Intern Med. 2020 Feb 18;172(4). doi: 10.7326/P19-0018. Epub 2020 Jan 21. Ann Intern Med. 2020. PMID: 31958812 No abstract available.
References
-
- Remberger M, Ackefors M, Berglund S, et al. Improved survival after allogeneic hematopoietic stem cell transplantation in recent years. A single-center study. Biol Blood Marrow Transplant 2011;17:1688–97. - PubMed
-
- Giebel S, Labopin M, Holowiecki J, et al. Outcome of HLA-matched related allogeneic hematopoietic stem cell transplantation for patients with acute leukemia in first complete remission treated in Eastern European centers. Better results in recent years. Annals of Hematology 2009;88:1005–13. - PubMed
Publication types
MeSH terms
Substances
Grants and funding
LinkOut - more resources
Full Text Sources
Miscellaneous