

Review
doi: 10.1016/bs.ctdb.2019.11.013.
Epub 2019 Dec 27.
Convergent extension in the amphibian, Xenopus laevis
Affiliations
- PMID: 31959291
- PMCID: PMC7132997
- DOI: 10.1016/bs.ctdb.2019.11.013
Item in Clipboard
Review
Convergent extension in the amphibian, Xenopus laevis
Curr Top Dev Biol.
2020.
Abstract
This review is a comprehensive analysis of the cell biology and biomechanics of Convergent Extension in Xenopus.
Keywords: Convergent extension; Gastrulation; Xenopus.
© 2020 Elsevier Inc. All rights reserved.
Figures
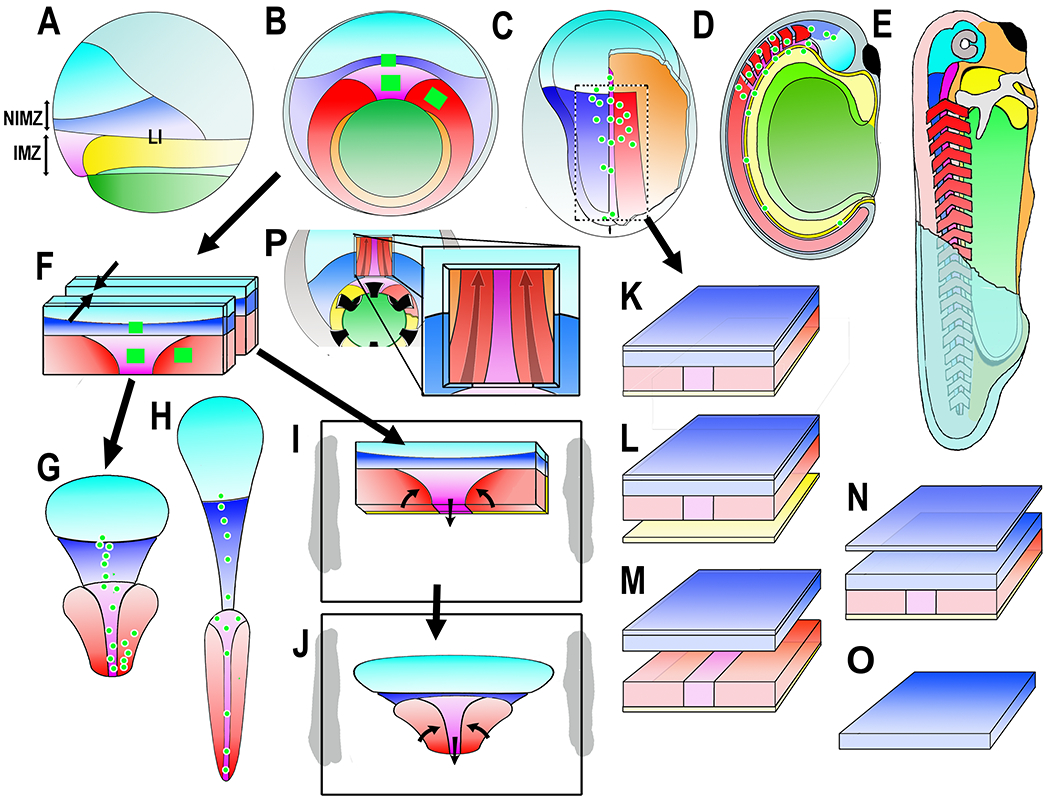
Diagrams show the Xenopus early gastrua fate map in lateral (A) and vegetal (B) views, the early neurula in dorsal view, right side cutaway to show postinvolution mesoderm (C), the closed neural tube stage in sagittal view (D), and the early tadpole in a cutaway view (E). Ectodermal fates are: epidermis (dull blue), forebrain (bright blue), and hindbrain/spinal cord (dark blue). Mesodermal fates are: notochord (magenta), somitic mesoderm (red), head, heart and lateroventral mesoderm (orange). Endodermal fates are: archenteron roof suprablastoporal endoderm (yellow, removed to show underlying mesoderm in B and explants (F-J), archenteron roof/bottle cell endoderm (light green), and vegetal endoderm (dark green). The future anterior-posterior (A-P) axes are shaded from A (dark) to P (light). Also indicated are the IMZ (Involuting Marginal Zone), the NIMZ (Non-Involuting Marginal Zone), and the LI (Limit of Involution). Construction of experimental preparations are shown for the “Keller Sandwich” (F-G-H), the Open-faced explant as made (F-I) and undergoing convergent extension (J), the “dorsal isolate” or “Wilson explant (C-K), with endodermal epithelium removed to reveal deep notochordal and somitic mesoderm (L), with neural and mesodermal separated to reveal their apposing surfaces (M), with epithelial neural removed to reveal deep neural with underlying mesoderm (N), and isolated neural deep layer (O), and the Davidson “windowed” embryo to reveal deep notochordal and somitic mesoderm (P). The square green patches and green dots are schematic representations of the graded separation of labeled patches of cells during convergent extension.
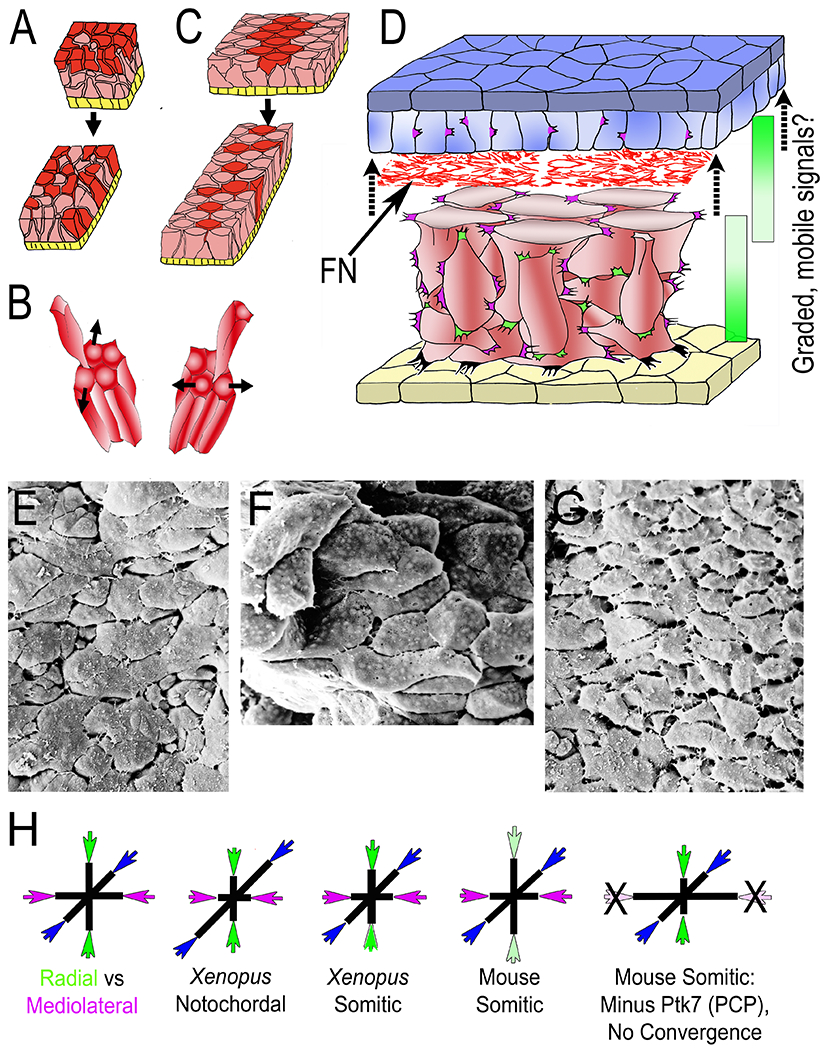
Diagrams illustrate intercalation of deep mesodermal cells along the radial axis of the embryo (normal to the surface epithelium (yellow), designated Radial Intercalation (RI) (A), and their intercalation mediolaterally (across the future body axis) designated mediolateral intercalation (MI), together, resulting in convergent extension (CE). In this case, RI is biased to occur between anterior and posterior neighbors (B, left) rather than between medial and lateral neighbors (B, right). The context and details of RI and MI during early CE are illustrated in D, showing the overlying presumptive neural tissue (epithelial layer, dark blue; deep layer light blue), a network of fibronectin fibrils (FN) between the basal layer of the presumptive neural tissue and outer layer of the deep mesodermal cells (red), which show mediolaterally polarized protrusive activity, reflective of intercellular traction and development of mediolateral tensile stress (magenta), and radially polarized protrusive activity acting orthogonally (green). At later stages FN is also assembled at the interface of the deep mesoderm and the overlying epithelial roof of the gastrocoel/archenteron (yellow). Integrin-FN signaling is essential for RI, as are mobile, chemotactic, signaling molecules (C3, PDGFA) two other tissues in early Xenopus embryos, raising the possibility in this tissue. Scanning electron micrographs of the late gastrula notochord in dorsal (E) and transverse (F) view, and the somitic mesoderm in dorsal view (G). The Tri-axial Force Model of tissue shaping (H) show the postulated relationship between radial (green), and mediolateral (magenta) forces overcoming the resistance to extension in the third, A-P axis (blue) to varying, tissue-specific degrees in the Xenopus notochord and somitic mesoderm. Experimental support for tri-axial tissue molding forces comes from dramatic flattening and widening of mouse somitic mesoderm after loss of convergence forces.
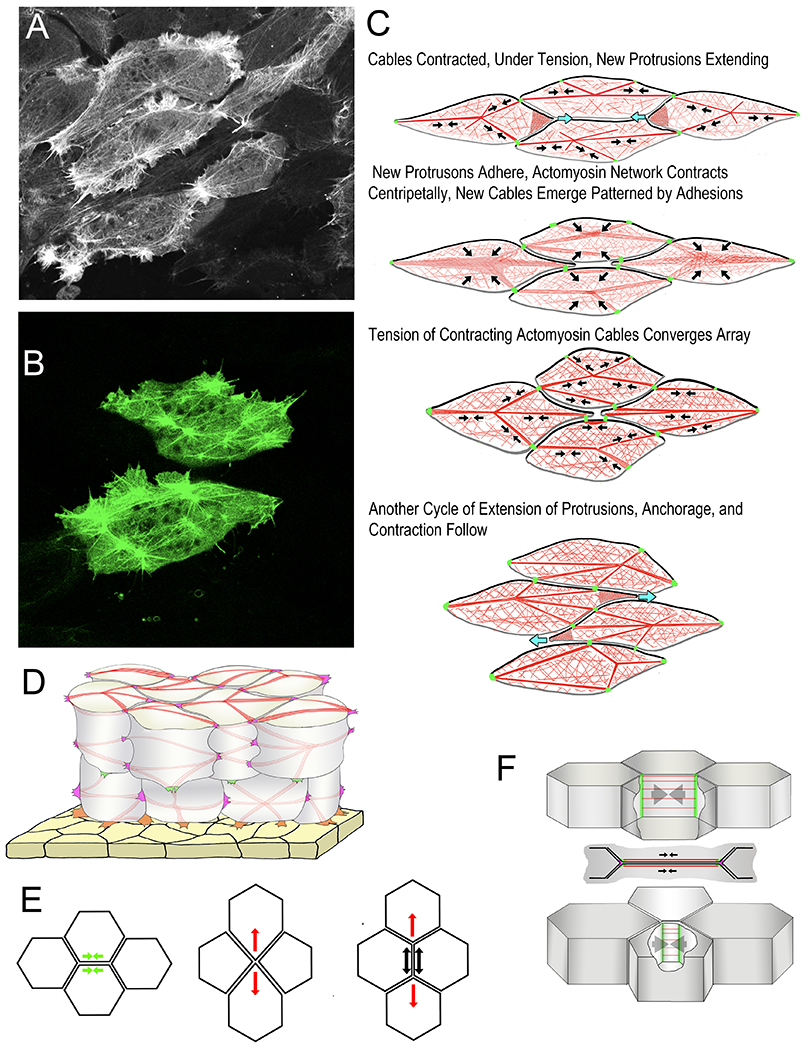
Scanning laser confocal micrographs from time-lapse movies show examples of the Node and Cable Network (NCN) actin cytoskeleton with Moesin-AB-GFP (A, B). Diagrams show phases of Mediolateral Intercalation Behavior (MIB) in the Cell-on-Cell Traction Model of intercalation (C). Black arrows indicate contraction of F-actin network/F-actin cables (red), green indicates C-cadherin adhesions, and blue arrows indicate extension of protrusions. Anterior sides of cells are black, the posterior gray. A semitransparent diagram shows surface cables and lateral cables of the cortical NCN (red) anchored to mediolateral (magenta) and radial (green) tractive protrusions, and protrusions connected to the underside of the epithelial endoderm of the archenteron roof (yellow). An illustration of the Epithelial Junctional Remodeling mode of epithelial cell intercalation (E) shows the initial active contraction (green arrow), or junction shortening (left), the formation of the tetrad of cells meeting a point, and the initiation of “resolution” with a centripetal contraction of the actomyosin cytoskeleton of the same cells (red arrows, middle), and the completed intercalation (right) showing the active contraction of resolution (red arrows) and the passive response of the intercalated cells (black arrows) (based on reference 132). A diagram shows the features of the junction shortening step of the epithelial-type intercalation behavior of notochord cells (F). Septins (green) form barriers that confine the active myosin to the actomyosin cables (red) of the cortical regions of the two apposed cell boundaries (in lateral view, top, and vertical view, middle); contraction of actomyosin cables shortens the boundaries (arrows) until the vertices meet (bottom). Based on reference (89).
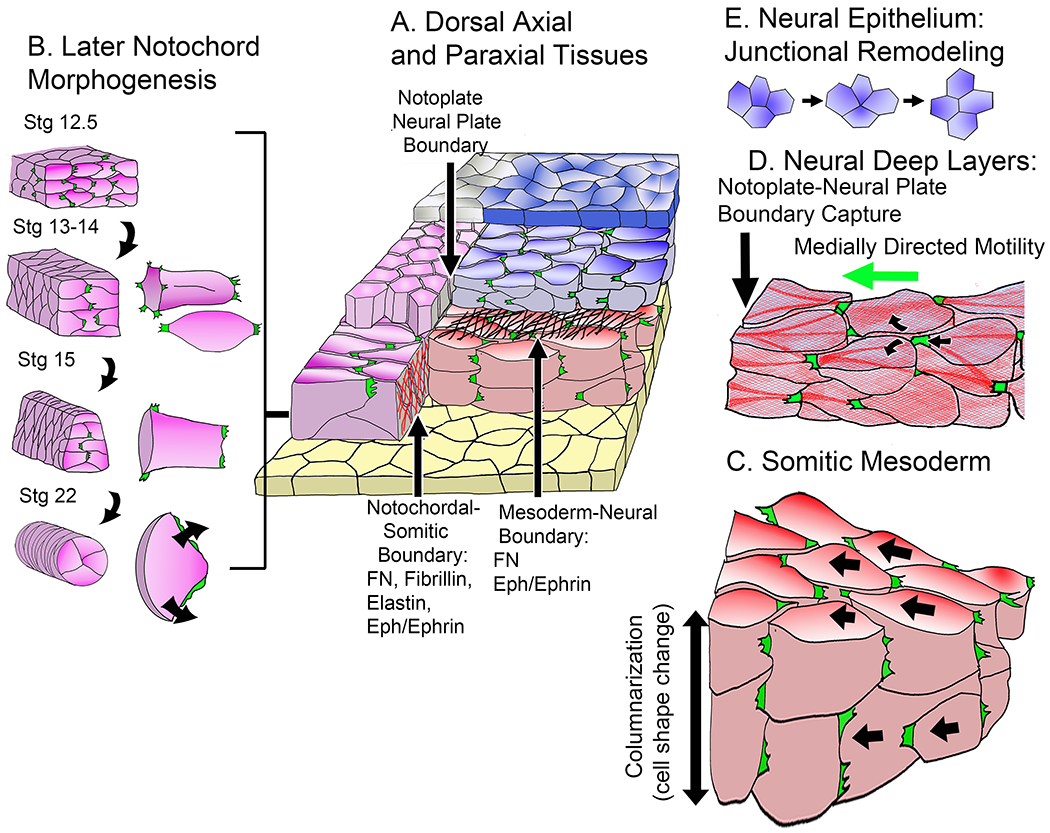
A diagram (A) shows relationships in the early neurula between notochord (magenta), the deep layer notoplate of the neural plate above it (magenta), the epithelial layer of the notoplate (gray), the somitic mesoderm (red), the deep layer of the neural plate (blue-gray), the epithelial layer of the neural plate (blue) and the endodermal gastrocoel (archenteron) roof (yellow). Diagrams (B) show differentiation of new patterns of MIB at Nieuwkoop-Faber developmental stages (magenta): 1) the transition from a mix of bipolar protrusive activity of internal cells and monopolar, inwardly directed protrusive activity of boundary cells (Stage12.5 to Stage 14) and the transition from monopolar inwardly directed protrusive activity to circumferential spreading, forming pizza-slice shaped cells, and rounding of the notochord at the onset of vacuolation (Stage 15 to Stage 22) (16). A diagram (C) shows convergence of the presomitic mesoderm by the bipolar mode of intercalation in the now double-layered somitic mesoderm, which is later accompanied by columnarization of the medial somitic mesoderm, the second component of somitic convergence. A diagram (D) shows the medially directed monopolar protrusive activity and crawling mode of intercalation in the deep neural layer, using actomyosin cables similar to those seen in the notochordal and somitic mesoderm. A diagram (E) illustrates the Epithelial Junctional Remodeling (EJR) mode of cell intercalation characteristic of the outer neural epithelial layer (119).
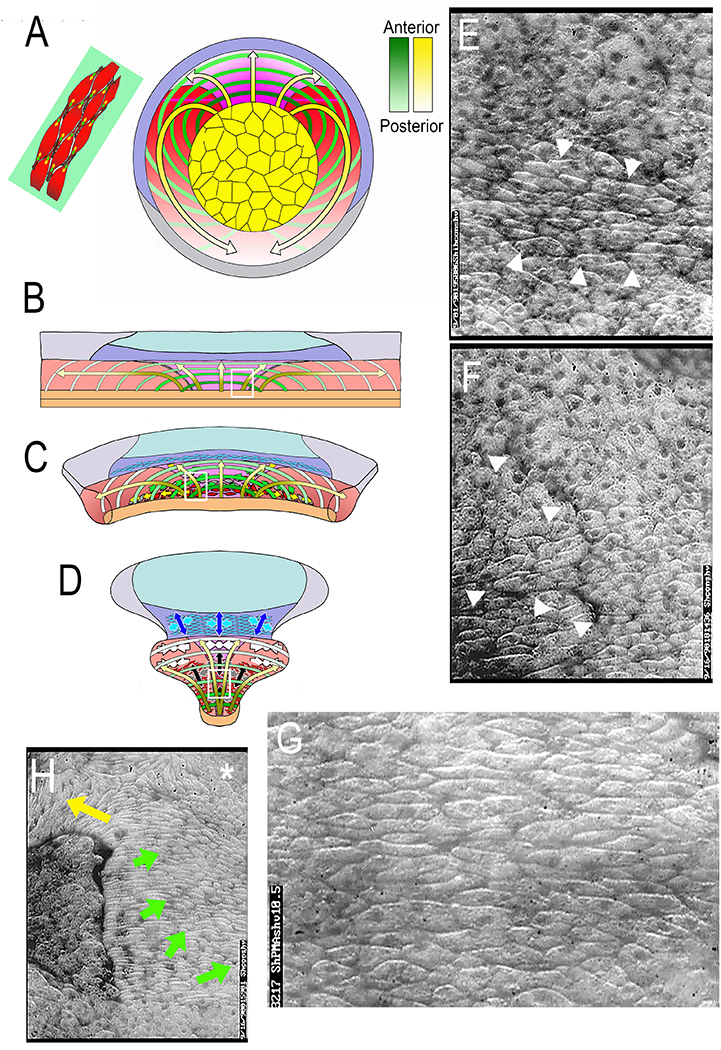
The spatiotemporal pattern of expression of mediolateral intercalation behavior (MIB) is a continuous progression from presumptive anterior (yellow arrows, dark ends) to presumptive posterior (yellow arrows, light ends) mapped on to the IMZ (A). It occurs in an arc like pattern, here illustrated as discrete hoops progressing from early and anterior (dark green) to late and posterior (light green); each hoop is anchored at the vegetal endoderm (yellow), and represents an arc of intercalating deep mesodermal cells (upper left (A); The arcs are pushed toward the blastoporal lip by preinvolution CT (Convergent Thickening) and as they involute the arcs shorten in A-P order with the expression of MIB, thereby pulling the archenteron roof and dorsal, somitic and notochordal mesoderm over the vegetal endoderm and closing the blastopore. This pattern was determined by mapping the expression pattern of MIB in large open-faced explants on to the IMZ (B) where A-P progressive arc-shortening results in CE (C-D). Images from low angle epi-illuminated open-faced explants show key features: the early onset of MIB in the vegetal alignment zone at Stg 10.5 (arrow heads in E, and white box in B); the initial, focal formation and subsequent straightening of the notochordal-somitic mesodermal boundary through the intercalating cells of the VAZ shortly thereafter (arrow heads in F, white box in C), a large, elongated, aligned and intercalating population of cells in the early central notochordal field (G, and white box in D). and a late neurula/early tailbud explant in which CE was retarded with excessive coverslip pressure, which results in partial progression of MIB and the subsequent vacuolation of the notochodal cells (G). Note the progression of vacuolation from the lateral boundary of the notochord posteriorly (yellow arrow) and medially from this lateral origin (green arrow), and undifferentiated, blebbing, rounded cells at the posterior medial notochordal field (asterisk). See references and .
References
-
- Vogt W 1929. Gestaltanalyse am Amphibienkein mit ortlicher Vitalfarbung. II. Teil. Gastrulation und Mesodermbildung bei Urodelen und Anuren. Wilhelm Roux Arch. EntwMech. Org 120, 384–706. - PubMed
-
- Condic ML, Fristrom D, and Fristrom JW, 1991. Apical cell shape changes during Drosophila imaginal leg disc elongation: a novel morphogenetic mechanism Development 111, 23–33. - PubMed
-
- Bissen ST and Weisblat DA 1989. The durations and compositions of cell cycles in embryos of the leech, Helobdella triserialis. Development 106, 105–118. - PubMed
Publication types
MeSH terms
Substances
Grants and funding
LinkOut - more resources
Full Text Sources
Other Literature Sources
