. 2020 Feb 11;7(1):ENEURO.0002-20.2020.
doi: 10.1523/ENEURO.0002-20.2020. Print 2020 Jan/Feb.

LRIT3 is Required for Nyctalopin Expression and Normal ON and OFF Pathway Signaling in the Retina

Affiliations

LRIT3 is Required for Nyctalopin Expression and Normal ON and OFF Pathway Signaling in the Retina

Nazarul Hasan et al. eNeuro. .

Abstract

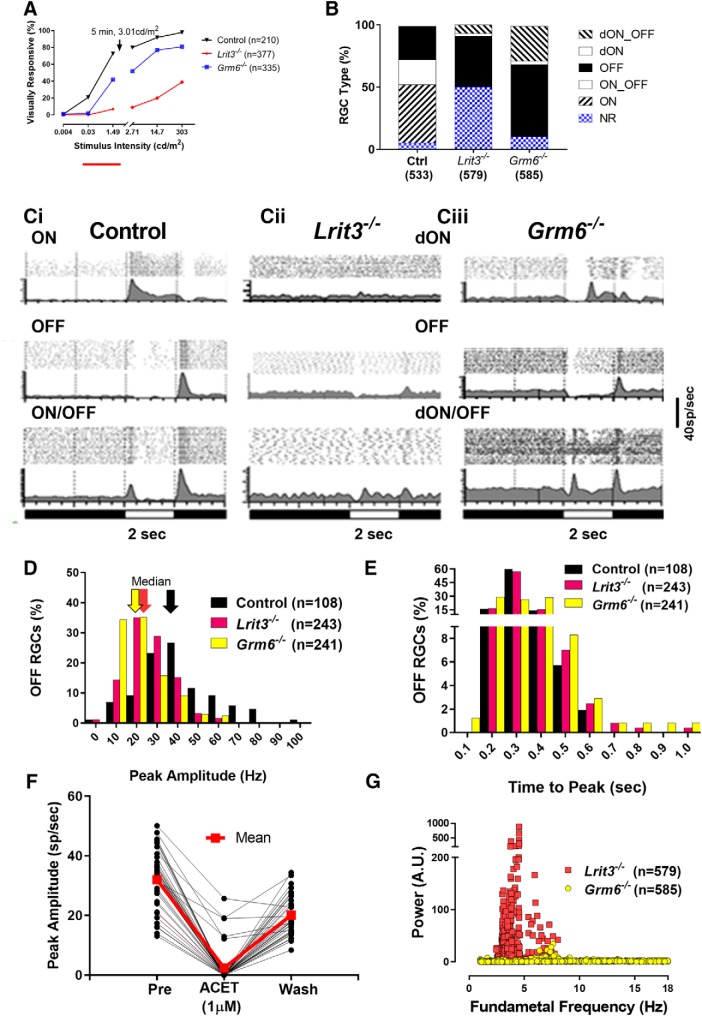
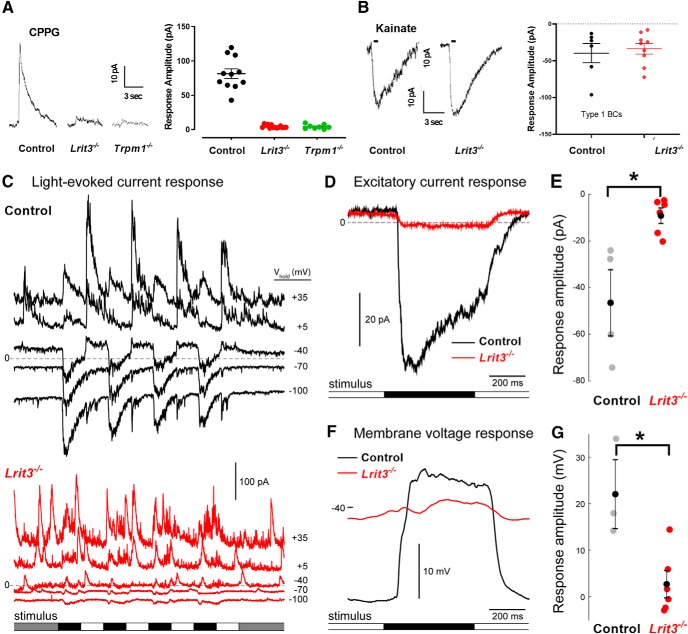
The first retinal synapse, photoreceptor→bipolar cell (BC), is both anatomically and functionally complex. Within the same synaptic region, a change in presynaptic glutamate release is sensed by both ON BCs (DBCs) via the metabotropic glutamate receptor 6 (mGluR6), and OFF BCs (HBCs) via ionotropic glutamate receptors to establish parallel signaling pathways that preferentially encode light increments (ON) or decrements (OFF), respectively. The synaptic structural organization of ON and OFF-type BCs at the photoreceptor terminal differs. DBCs make an invaginating synapse that contains a diverse but incompletely understood complex of interacting proteins (signalplex). HBCs make primarily flat contacts that contain an apparent different set of proteins that is equally uncharacterized. LRIT3 is a synaptic protein known to be essential for ON pathway visual function. In both male and female mice, we demonstrate that LRIT3 interacts with and is required for expression of nyctalopin, and thus TRPM1 at all DBC dendritic tips, but DBC signalplex components are not required for LRIT3 expression. Using whole-cell and multielectrode array (MEA) electrophysiology and glutamate imaging, we demonstrate that the loss of LRIT3 impacts both ON and OFF signaling pathway function. Without LRIT3, excitatory input to type 1 BCs is reduced, as are the visually evoked responses of many OFF retinal ganglion cells (RGCs). We conclude that the absence of LRIT3 expression disrupts excitatory input to OFF BCs and, thus disrupts the normal function of OFF RGCs.

Keywords: CSNB; LRIT3; glutamate dynamics; night blindness; nyctalopin.


Figures

Figure 1.
Figure 1.
LRIT3 interacts with and is required for nyctalopin expression. A, Confocal fluorescence image of EYFP-nyctalopin (red), LRIT3 (green) and pikachurin (magenta) staining in (Ai) control and (Aii) Lrit3-/-/TgNyc-EYFP retinas. Nyctalopin-EYFP is not expressed in the Lrit3-/-/TgNyc-EYFP retina. Characteristics of the Lrit3-/- mouse are shown in Extended Data Figures 1-1, 1-2. B, In Nyxnob retinas that lack nyctalopin, LRIT3 is expressed and localized to the dendrites of the rod and cone DBCs (marked by arrowheads). Examples show representative images of data from at least three mice. C, LRIT3 and nyctalopin interact in HEK293 cells. HEK293 cells were transfected with expression plasmids pLrit3, pNyx-EYFP or both, and immunoblotted with antibodies against LRIT3 and EYFP. Lanes for the lysates show that the expected proteins were expressed. The remaining lysate was immunoprecipitated (IP) with antibodies against LRIT3 and the precipitates analyzed by western blotting. An asterisk indicates a non-specific band. Blots are representative of at least three experiments.
Figure 2
Figure 2
LRIT3 and Pikachurin are expressed normally in the OPL of Grm6-/-, Gpr179nob5, and Trpm1-/-mouse retinas. Confocal fluorescence images of retinas from control, Lrit3-/-, Grm6-/-, Gpr179nob5, and Trpm1-/- mouse retinas, immunostained for LRIT3 (green) and pikachurin (magenta). The merged images show that LRIT3 and Pikachurin co-localize. Staining for CACNA1F, PNA, and mCAR (cone arrestin) are shown in Extended Data Figure 2-1. Arrowheads indicate cone terminals. Scale bar = 5 μm.
Figure 3.
Figure 3.
Visual responses of Lrit3-/-RGCs are significantly altered compared to controls and Grm6-/-. A, Intensity response functions of control, Lrit3-/-, and Grm6-/- RGCs. Break in the x-axis represents 5-min light adaptation to a background of 3.01 cd/m2. B, RGC functional classes in control, Lrit3-/- and Grm6-/- retinas based on responses to a 303 cd/m2 full field flashes on a 0.3 cd/m2 background. The total number of RGCs for each genotype is shown on the x-axis and were obtained from 12 retinal pieces from eight control mice, 16 retinal pieces from 6 Lrit3-/- mice, and 10 retinal pieces from four Grm6-/- mice, respectively. There are significantly more visually non-responsive RGCs (defined as cells with spontaneous but no visually evoked activity) in the Lrti3-/- mice than either control or Grm6-/-(∼50% increase; Fishers exact test, p < 0.001 for both comparisons). C, Representative average PSTHs (above, raster plots to individual stimulus presentation) of responses to a full field light stimulus (303 cd/m2) on a 0.3 cd/m2 background, recorded on a MEA. Ci, Control RGC responses can be classified as ON, OFF, and ON/OFF based on whether spiking peaks to light onset, offset or both, respectively. All responses occur <0.4 s after stimulus onset. Lrit3-/- (Cii) and Grm6-/- (Ciii) RGC responses can be classified into the same general groups but the time to the peak response to light onset is >0.4 s (summary data not shown), and these responses are referred to as delayed ON (dON) or dON/OFF RGCs. D, The peak amplitude of OFF RGCs in Lrit3-/- and Grm6-/- are decreased compared to controls (median: 25 and 19 Hz, respectively, vs 38 Hz in controls, Kruskal–Wallis followed by Dunn’s test; p < 0.001 for both comparisons). E, Distribution of response latencies in the OFF Lrit3-/- and Grm6-/- RGCs is not different from control (Kruskal–Wallis p = 0.995 for both comparisons). F, OFF responses in Lrit3-/- RGCs are mediated by kainate receptors. Responses show 37 RGCs peak response (sp/s), before (32 ± 1.6 SEM), during (2.4 ± 1.1), and after ACET (20.11 ± 1.1; 1.0 μM) treatment. G, Fast Fourier transform to quantify rhythmicity in the spontaneous activity of Lrit3-/- and Grm6-/- RGCs. Lrit3-/- cells exhibit rhythmic firing, whereas few do so in the Grm6-/- retinas.
Figure 4.
Figure 4.
Glutamate release in Lrit3-/-mice is decreased in both ON and OFF sublaminae of the IPL. A, iGluSnFR expression in somas, and dendrites in the ON and OFF sublaminae of the IPL following viral transduction with AAV2/1-hsyn-iGluSnFR. B, Visually-evoked changes in glutamate levels as detected by changes in iGluSnFR fluorescence in the ON (top traces) and OFF (bottom traces) layers of the IPL for control (black) and Lrit3-/- (red) retinas, to a contrast reversing spot on a photopic background (1.2 × 10⁴ R*/rod and cone/s; 150 μm in diameter, 1-Hz square wave, 100% Michelson contrast). C, Summary data for the change in iGluSnFR fluorescence in the ON and OFF sublaminae of control and Lrti3-/- retinas for all recorded areas (ON, control n = 37, seven eyes; Lrit3-/- n = 35, eight eyes; OFF, control n = 28, seven eyes; Lrit3-/- n = 40, eight eyes). D, Whole-cell electrophysiological recordings of light-evoked current responses of three identified RGC types (same stimulus as in B, except diameter 350 μm; recorded in voltage clamp mode at the reversal potential for chloride, –69 mV). E, F, Summary data for the light-evoked current response amplitude for all recorded cells. ON and OFF response amplitudes (E) were computed as the mean of the recorded current following a light increment and decrement, respectively (light and dark gray regions in D). For all responses the amplitude of the excitatory (inward) current is inverted for ease of interpretation. Response amplitudes from control versus Lrit3-/- were compared using a t test (ON α ON response, control n = 7, five eyes vs Lrit3-/- n = 15, eight eyes, p < 0.0001; OFF α OFF response; control n = 7, five eyes vs Lrit3-/- n = 8, six eyes, p < 0.0007; OFF δ OFF response control n = 4, four eyes, Lrit3-/- n = 6, four eyes, p = 0.086). TTP of the OFF responses of OFF-α and OFF-δ ganglion cells (F) were defined as the time following onset of a light decrement (dark gray region in D) when the excitatory current peaked. TTP of control versus Lrit3-/- were compared using a t test (OFF α OFF response; control n = 7, five eyes vs Lrit3-/- n = 8, six eyes, p = 0.183; OFF δ OFF response control n = 4, four eyes, Lrit3-/- n = 6, four eyes, p = 0.0.371). All error bars are mean ± SEM. * = Significant difference.
Figure 5.
Figure 5.
Lrit3-/-rod BCs lack functional Trpm1 responses and BC1 cells have decreased excitatory input. A, Whole-cell voltage clamp recordings from rod BC from control, Lrit3-/- and Trpm1-/- mice during puffs of the mGluR6 antagonist CPPG (3 mM). Summary data shows a decreased response in Lrit3-/- (n = 11) and Trpm1-/- (n = 11) cells compared to control, consistent with absence of the ERG b-wave in these knock-outs (***ANOVA, F(2,30), p < 0.001, Tukey post hoc tests, p < 0.001 for control vs both knock-outs). B, Responses from BC1 cells to kainate puffs (50 μm) in retinal slices from control and Lrit3-/- retinas. Summary data for all recorded cells shows no difference in the maximal responses between the two genotypes (t test, p = 0.67). C, Whole-cell voltage clamp recordings of BC1 cell in control (top) and Lrit3-/- (bottom) mouse whole-mounts. Traces represent the current recorded at different holding potentials (ECl = –69 mV; Ecat = 0 mV). Lrit3-/- showed a marked absence of excitatory current (lower traces). D, Light-evoked excitatory current response of an example control and Lrit3-/- BC1 cell. Traces show the average response to nine repeats of the square wave, contrast-reversing spot stimulus presented on a photopic background (1.2 × 10⁴ R*/rod and cone/s; 150 μm in diameter, 1-Hz square wave, 100% Michelson contrast). E, Summary data for the excitatory current response for all recorded BC1 cells (data partially shown in D) control n = 4, three eyes; Lrit3-/- n = 6, four eyes; t test p = 0.0072). F, G, As for D, E, for membrane voltage response recorded in current clamp mode (control n = 6, four eyes; Lrit3-/- n = 3, three eyes; t test p = 0.0105). Error bars are mean ± SEM. * = Significant difference.

Similar articles

Cited by

References

    1. Ball SL, Powers PA, Shin HS, Morgans CW, Peachey NS, Gregg RG (2002) Role of the β2 subunit of voltage-dependent calcium channels in the retinal outer plexiform layer. Invest Ophthalmol Vis Sci 43:1595–1603. - PubMed
    1. Ball SL, Pardue M, McCall M, Gregg R, Peachey N (2003) Immunohistochemical analysis of the outer plexiform layer in the Nob mouse. Invest Ophthalmol Vis Sci 44:1865. - PubMed
    1. Borghuis BG, Marvin JS, Looger LL, Demb JB (2013) Two-photon imaging of nonlinear glutamate release dynamics at bipolar cell synapses in the mouse retina. J Neurosci 33:10972–10985. 10.1523/JNEUROSCI.1241-13.2013 - DOI - PMC - PubMed
    1. Borghuis BG, Looger LL, Tomita S, Demb JB (2014) Kainate receptors mediate signaling in both transient and sustained OFF bipolar cell pathways in mouse retina. J Neurosci 34:6128–6139. 10.1523/JNEUROSCI.4941-13.2014 - DOI - PMC - PubMed
    1. Cao Y, Posokhova E, Martemyanov KA (2011) TRPM1 forms complexes with nyctalopin in vivo and accumulates in postsynaptic compartment of ON-bipolar neurons in mGluR6- dependent manner. J Neurosci 31:11521–11526. 10.1523/JNEUROSCI.1682-11.2011 - DOI - PMC - PubMed

Publication types