. 2020 Jan 20;11(1):395.
doi: 10.1038/s41467-020-14330-z.

Precapillary sphincters maintain perfusion in the cerebral cortex

Affiliations

Precapillary sphincters maintain perfusion in the cerebral cortex

Søren Grubb et al. Nat Commun. .

Abstract

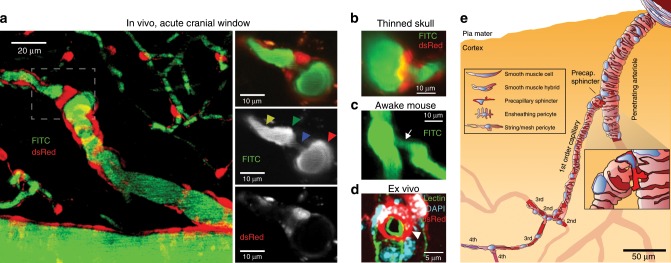
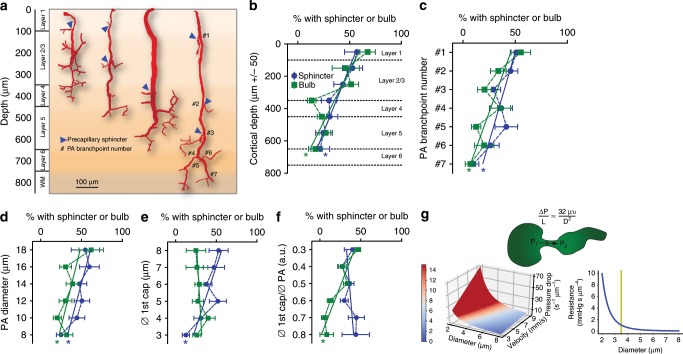
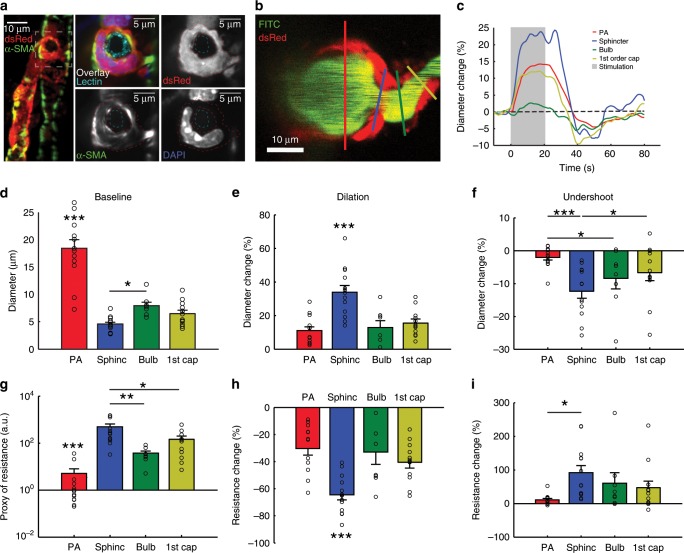
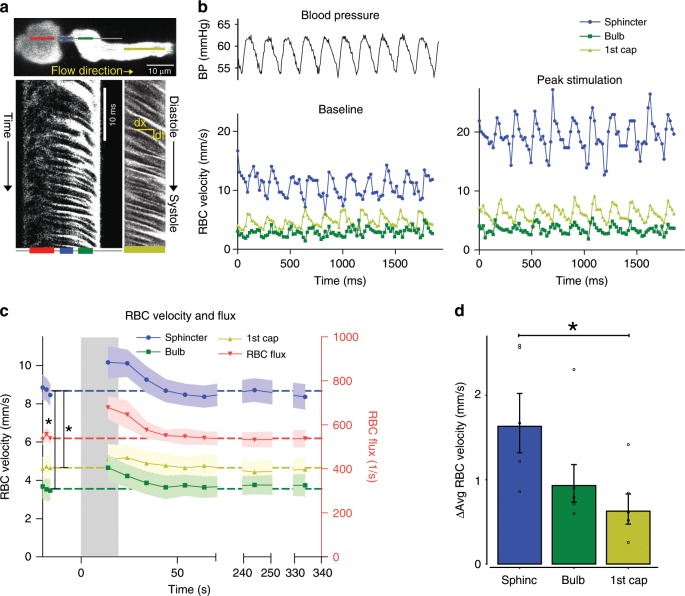
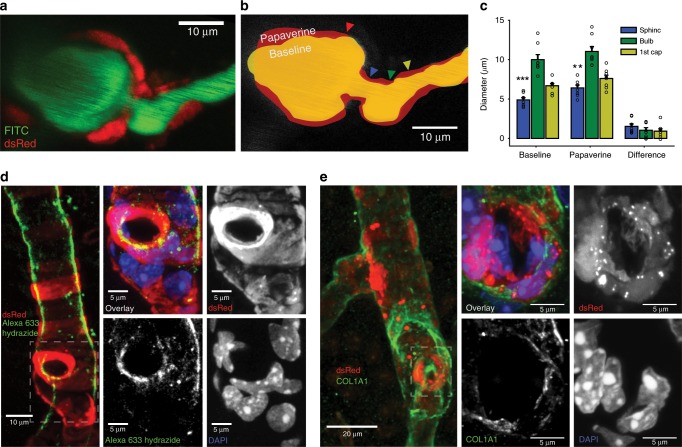
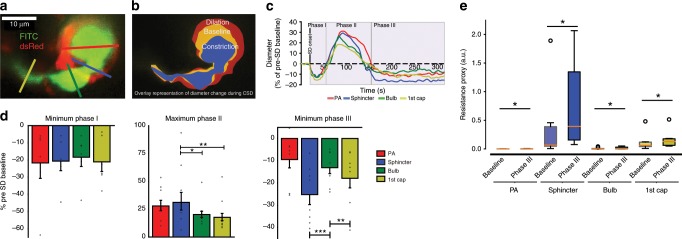
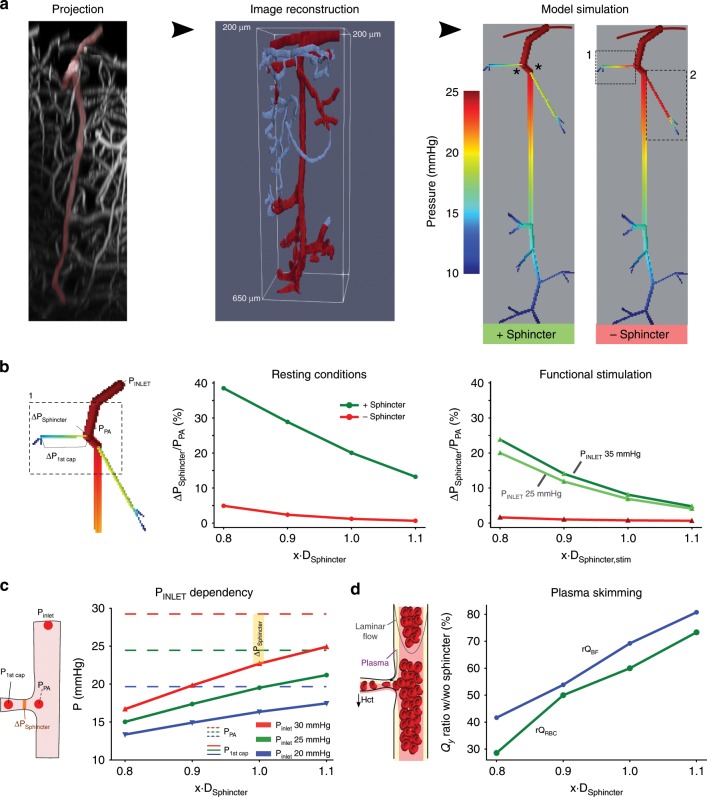
Active nerve cells release vasodilators that increase their energy supply by dilating local blood vessels, a mechanism termed neurovascular coupling and the basis of BOLD functional neuroimaging signals. Here, we reveal a mechanism for cerebral blood flow control, a precapillary sphincter at the transition between the penetrating arteriole and first order capillary, linking blood flow in capillaries to the arteriolar inflow. The sphincters are encircled by contractile mural cells, which are capable of bidirectional control of the length and width of the enclosed vessel segment. The hemodynamic consequence is that precapillary sphincters can generate the largest changes in the cerebrovascular flow resistance of all brain vessel segments, thereby controlling capillary flow while protecting the downstream capillary bed and brain tissue from adverse pressure fluctuations. Cortical spreading depolarization constricts sphincters and causes vascular trapping of blood cells. Thus, precapillary sphincters are bottlenecks for brain capillary blood flow.


Conflict of interest statement

The authors declare no competing interests.

Figures

Fig. 1
Fig. 1. Sphincters on proximal branches of penetrating arterioles.
a Left panel: Maximal intensity projected in vivo two-photon laser scanning microscopy image of an NG2-dsRed mouse barrel cortex. An indentation of the capillary lumen is observed at the branching of the PA and is encircled by bright dsRed cell(s) (dashed insert). This structure is denoted as a precapillary sphincter. Immediately after the sphincter, a sparsely dsRed-labeled distention of the capillary lumen is observed, which we refer to as the bulb. Right panels: Single z-plane showing overlay, FITC-channel, and dsRed channel of the dashed insert. Arrows indicate the PA (red), sphincter (blue), bulb (green), and 1st order capillary (yellow). bd Local TPLSM projections of precapillary sphincters in the cortex of a thinned skull mouse in vivo (b), an awake mouse harboring a chronic cranial window in vivo (c) with white arrows marking the precapillary sphincter, and an ex vivo coronal slice of a FITC-conjugated lectin (green) stained NG2-dsRed mouse (red) with DAPI-stained (blue) nuclei (d). The precapillary sphincter cell nucleus is arched, as it follows the cell shape, and is marked by a white arrowhead. e Schematic of a PA with the a a precapillary sphincter at the proximal branch point. The illustration is based on confocal imaging of coronal slices ex vivo and the exact morphology and location of NG2-dsRed positive cells and their DAPI stained nuclei are shown. For the complete figure including a venule, see Supplementary Fig. 8.
Fig. 2
Fig. 2. Location of sphincters help pressure equalization along PA.
a Representatives of four PA subtypes reaching different cortical layers based on ex vivo data. Precapillary sphincters are found at varying depths (marked by blue arrowheads and branchpoint numbers are indicated on the right PA). bf Dependency of the presence and location of precapillary sphincters and bulbs (binned quantification) on various parameters. Criteria for the positive presence of sphincter or bulb at a branch point: sphincter <0.8 and bulb >1.25 times the diameter of a first order capillary, in total 602 branchpoints of 108 PAs in 9 mice were analyzed, ±SEM, linear regression, * = slope deviates significantly from 0. b Dependency on cortical depth (bin size 100 µm). c Dependency on PA branch number (counting from the proximal end). d Dependency on PA diameter (bin size 2 µm). e Dependency on first order capillary diameter (bin size 1 µm). f Dependency on first order capillary/PA diameter ratios (bin sizes as in d and e). g Top panel: Illustration of a pressure decrease across a precapillary sphincter and modified expression of Poiseuille’s law. ΔP is the pressure difference, L unit length, µ viscosity, and υ flow velocity. Lower left: Illustration of Poiseuille’s law showing how the pressure drop (defined as pressure difference per unit length times viscosity, ΔPμL, also unit of color scale), depends on the cylindrical lumen diameter and flow velocity. Note how the pressure drop increases with lumen diameters below 4 µm. Lower right: Combining flow resistance in laminar fluid flow with Poiseuille’s law yields an equivalent representation of how flow resistance (defined as resistance per unit length and viscosity, RμL) depends on lumen diameter. Source data are provided as a Source Data file.
Fig. 3
Fig. 3. Sphincters actively regulate blood flow.
a Ex vivo coronal slices of an FITC-lectin-stained NG2-dsRed mouse immunostained for α-SMA. Left panel: maximal projection of a PA with a precapillary sphincter at the first order capillary branch point. The marked area is shown on the right. Right panels: local maximal intensity projections of the precapillary sphincter region of dsRed, α-SMA, DAPI, or all channels including FITC-lectin overlaid. The lumen (cyan) and the outlines of the dsRed signal of the precapillary sphincter cell have been marked by dashed lines in the three grayscale images. bi In vivo whisker pad stimulation experiments (anaesthetized NG2-dsRed mice) using maximal intensity projected 4D data obtained by two-photon microscopy, n = 13 mice for PA and sphincter, 8 for bulb and 12 for first order capillary, ±SEM. b Maximal intensity projection of a PA branch point where the colored lines indicate the ROIs for diameter measurements of the vessel segments: PA (red), precapillary sphincter (blue), bulb (green), and first order capillary (yellow). c Representative time series of relative diameter dynamics in each vessel segment upon 20 s of 5 Hz whisker pad stimulation (gray bar, start at time zero). d Summary of baseline diameters (absolute values). e Summary of peak diameter change upon whisker pad stimulation. f Summary of the peak undershoot phase after whisker pad stimulation. g A proxy of flow resistance at baseline estimated using Poiseuille’s law. h Relative change in flow resistance at peak dilation during stimulation. i Relative change in flow resistance during the poststimulation undershoot. The Kruskal–Wallis test was used in (d, g, and i) to reveal differences among vessel segments, followed by a Wilcoxon rank-sum test (with Holm’s p value adjustment) for pairwise comparisons. LME models were used in (e, f, h, and m) to test for differences among segments, followed by Tukey post hoc tests for pairwise comparisons. In each figure, significance codes *p < 0.05, **p < < 0.01, and ***p < 0.001. Source data are provided as a Source Data file.
Fig. 4
Fig. 4. Red blood cell velocity and flux at the sphincter.
a Resonance scanning allows for rapid repetitive line-scans in a single z-plane (upper panel). In the resulting space–time maps (lower panel), individual cells appear in black with an angle proportional to the cell velocity. Red, blue, green, and yellow lines indicate the regions of the line-scans derived from the PA, sphincter, bulb, and first order capillary (first order capillaries were mostly scanned in consecutive experiments). b Fluctuations in femoral artery blood pressure (left upper panel) and RBC velocity (left lower panel) correlated. During whisker pad stimulation (right panel), RBC velocity increased. c Time series of RBC velocities and flux during whisker pad stimulation. RBC velocity at the precapillary sphincter was significantly higher than the bulb and first order capillary at baseline and peaked around 10 s after stimulation before returning to baseline. d Summary of the difference between maximal and baseline RBC velocity during whisker stimulation. In d, the LME analysis was performed on log-transformed data to ensure homoscedasticity. n = 6 mice, ±SEM, significance code *p < 0.05. Source data are provided as a Source Data file.
Fig. 5
Fig. 5. Passive structural elements limit vasodilation.
ad Papaverine (10 mM) was locally injected into the vicinity of precapillary sphincters to dilate the nearby vasculature. a Representative maximal intensity projection of an NG2-dsRed mouse PA branch point. b Schematic of the papaverine-induced dilation (red) below an outline of the vessel lumen at baseline (yellow). The ROI locations in individual vessel segments are marked by colored arrows. c Absolute diameters of vessel segments at baseline and after papaverine addition, and the difference before and after papaverine addition. The baseline dataset was analyzed by the Kruskal–Wallis test, followed by a Wilcoxon rank-sum test (with Holm’s p value adjustment) for pairwise comparisons, n = 8 mice, ±SEM. The papaverine and difference datasets were analyzed using LME models followed by Tukey post hoc tests for pairwise comparisons. Significance codes **p < 0.01, and ***p < 0.001. d Maximal intensity projections of coronal slices from NG2-dsRed mice stained with Alexa633 hydrazide and DAPI. Left panel: ×20 magnification of a penetrating arteriole with a precapillary sphincter at the branch point. Right panels: ×63 magnification of the precapillary sphincter and first order capillary. Alexa633 hydrazide staining is strong at the sphincter but absent in the first order capillary. e Maximal intensity projections of coronal slices of NG2-dsRed mice stained with COL1A1 antibody and DAPI. Left panel: ×20 magnification of a penetrating arteriole with two branches. Right panels: ×63 magnification of the precapillary sphincter at the lower branch. Source data are provided as a Source Data file.
Fig. 6
Fig. 6. Sphincters are vulnerable to cortical spreading depolarization.
Cortical spreading depolarization was elicited in the posterior part of the somatosensory cortex by microinjection of potassium acetate during imaging of the precapillary sphincter. a Representative maximal intensity projection of an FITC-dextran loaded NG2-dsRed mouse at a precapillary sphincter. Colored lines mark the ROIs for diameter measures. b Overlaid outlines of baseline (yellow), phase II dilation (red), and phase III constriction (blue). c Representative time series of diameter changes within vessel segments during the three phases of CSD. d Summaries of maximal diameter changes within vessel segments during phase I–III of the CSD. During phase II, the PA and sphincter dilated significantly more than the first order capillary. During phase III, the sphincter constricted significantly more than the PA and the bulb. Datasets were analyzed via LME models, followed by Tukey post hoc tests for pairwise comparisons (phase II data were log-transformed to ensure homoscedasticity). e Boxplot summary of the estimated flow resistances at vessel segments at baseline and during phase III of CSD. Paired Wilcoxon signed rank tests were used to establish the difference (p < 0.05) before and during CSD phase III. n = 6 mice for phase I, 9 mice for phase II and 8 mice for phase III, ±SEM. The box extends from the lower to upper quartile values of the data, with a line at the median. The whiskers extend from the box to show the range of the data. Flier points are those past the end of the whiskers. In each figure, significance codes *p < 0.05, **p < 0.01, and ***p < 0.001. Source data are provided as a Source Data file.
Fig. 7
Fig. 7. Sphincters reduce pressure, flow, and hematocrit into capillaries.
a An xz-projection of a z-stack covering an entire PA (left) was reconstructed (middle) and converted into a computational model of a PA and associated first and second order capillaries. Model simulation (right) including the sphincters (green, marked by asterisks), or without the sphincters (red), observed in the two proximal branches along the PA gave rise to higly divergent pressure profiles along the first order capillaries (highlighted boxes in the model without sphincters). b Pressure drop across the sphincter depends on its diameter. Focusing on the first sphincter (left panel), the pressure drop across the sphincter (ΔPSphincter) relative to the pressure at the branch point (PPA) was calculated as a function of sphincter diameters (xDSphincter) under resting conditions (middle) or upon functional stimulation (right, using the relative changes in dilation from Fig. 3) with the sphincter (green curves) or without (red curves, where diameter of the sphincter is equal to the first order capillary). c The degree of sphincter contraction correlates to the pressure in the PA. With increasing inlet pressures into the PA (20 mmHg: blue, 25 mmHg: green, and 30 mmHg: red), the PA pressure increases (dashed curves) and the sphincter must contract to maintain a relatively low pressure into the first order capillary (full curves). The difference between the pressures in the PA and the first order capillary is the pressure drop across the sphincter (ΔPSphincter, see inset). d Flow reduction and phase separation effects due to the sphincter. The ratios of blood flow (rQBF, blue curve) and RBC flow (rQRBC, green curve) with and without the sphincter (rQwith_Sphincter/rQwithout_Sphincter) was calculated as a function of sphincter diameter. Both flows correlate proportionally with diameter but the RBC flow remains lower due to plasma skimming. Source data are provided as a Source Data file.

References

    1. Attwell D, et al. Glial and neuronal control of brain blood flow. Nature. 2010;468:232–243. doi: 10.1038/nature09613. - DOI - PMC - PubMed
    1. Sweeney MD, Kisler K, Montagne A, Toga AW, Zlokovic BV. The role of brain vasculature in neurodegenerative disorders. Nat. Neurosci. 2018;21:1318. doi: 10.1038/s41593-018-0234-x. - DOI - PMC - PubMed
    1. Koehler RC, Roman RJ, Harder DR. Astrocytes and the regulation of cerebral blood flow. Trends Neurosci. 2009;32:160–169. doi: 10.1016/j.tins.2008.11.005. - DOI - PubMed
    1. Lok J, et al. Cell-cell signaling in the neurovascular unit. Neurochem. Res. 2007;32:2032–2045. doi: 10.1007/s11064-007-9342-9. - DOI - PubMed
    1. Hall CN, et al. Capillary pericytes regulate cerebral blood flow in health and disease. Nature. 2014;508:55–60. doi: 10.1038/nature13165. - DOI - PMC - PubMed

Publication types

MeSH terms

LinkOut - more resources