. 2020 Jan 20;10(1):671.
doi: 10.1038/s41598-020-57510-z.

Analysis of O-glycoforms of the IgA1 hinge region by sequential deglycosylation

Affiliations

Analysis of O-glycoforms of the IgA1 hinge region by sequential deglycosylation

Yukako Ohyama et al. Sci Rep. .

Erratum in

Abstract

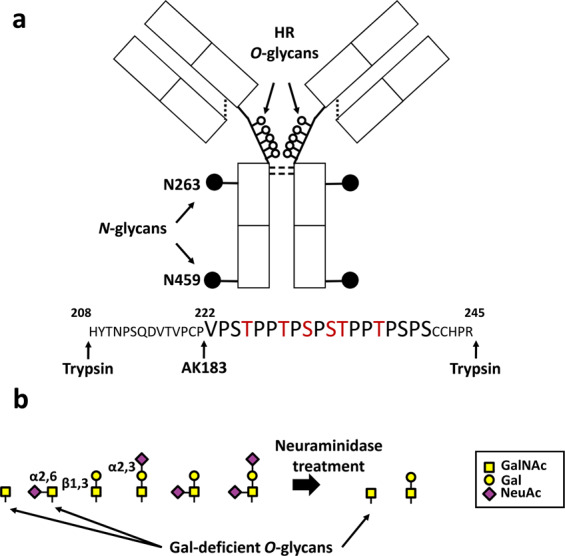
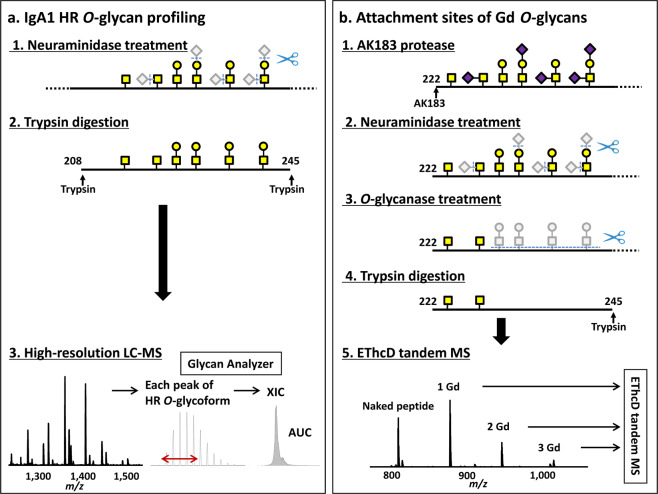
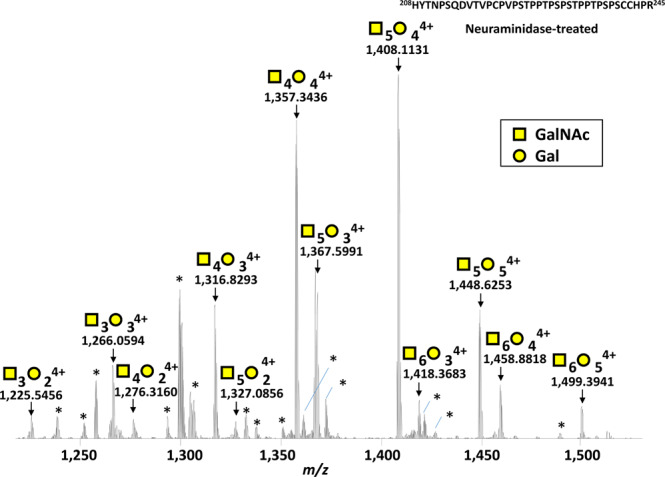
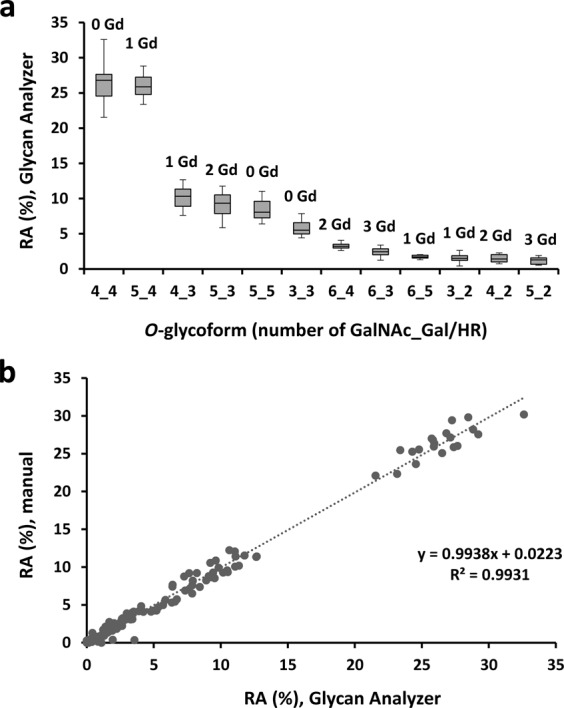
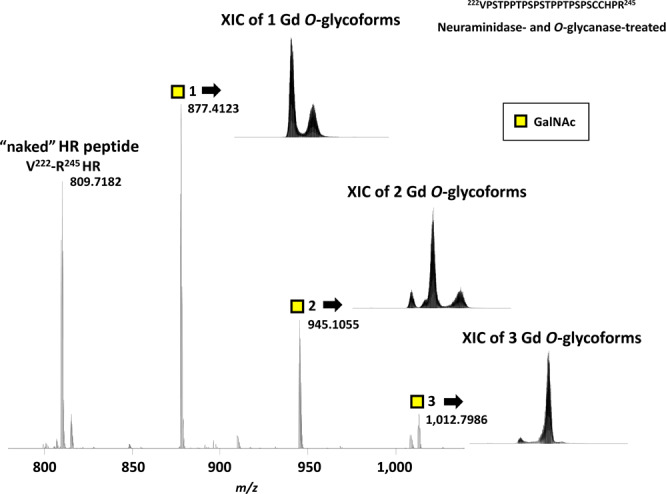
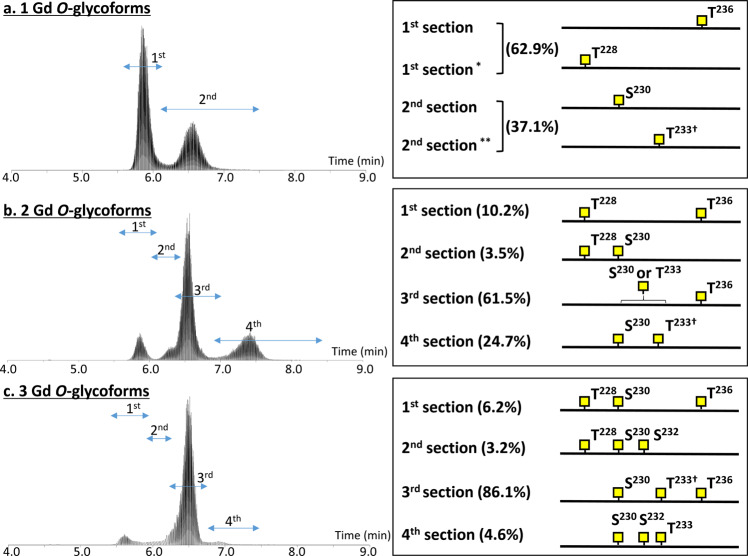
A common renal disease, immunoglobulin A (IgA) nephropathy (IgAN), is associated with glomerular deposition of IgA1-containing immune complexes. IgA1 hinge region (HR) has up to six clustered O-glycans consisting of Ser/Thr-linked N-acetylgalactosamine with β1,3-linked galactose and variable sialylation. IgA1 glycoforms with some galactose-deficient (Gd) HR O-glycans play a key role in IgAN pathogenesis. The clustered and variable O-glycans make the IgA1 glycomic analysis challenging and better approaches are needed. Here, we report a comprehensive analytical workflow for IgA1 HR O-glycoform analysis. We combined an automated quantitative analysis of the HR O-glycopeptide profiles with sequential deglycosylation to remove all but Gd O-glycans from the HR. The workflow was tested using serum IgA1 from healthy subjects. Twelve variants of glycopeptides corresponding to the HR with three to six O-glycans were detected; nine glycopeptides carried up to three Gd O-glycans. Sites with Gd O-glycans were unambiguously identified by electron-transfer/higher-energy collision dissociation tandem mass spectrometry. Extracted ion chromatograms of isomeric glycoforms enabled quantitative assignment of Gd sites. The most frequent Gd site was T236, followed by S230, T233, T228, and S232. The new workflow for quantitative profiling of IgA1 HR O-glycoforms with site-specific resolution will enable identification of pathogenic IgA1 HR O-glycoforms in IgAN.


Conflict of interest statement

M. B. Renfrow and J. Novak are co-founders and co-owners of and consultants for Reliant Glycosciences, LLC and co-inventors on the US patent application 14/318,082 (assigned to UAB Research Foundation that distributes royalties to the inventors). The other authors declare no competing interests.

Figures

Figure 1
Figure 1
Human immunoglobulin A1 (IgA1) structure and the hinge-region (HR) O-glycans. (a) IgA1 structure. The major differences between IgA1 and IgA2 subclasses are in the HR. Human IgA1 HR is longer than that of IgA2, and with mucin-type clustered core 1 O-glycans attached (open circles). The HR usually has three to six O-glycan chains attached to some of the nine potential O-glycosylation sites. Six serine (S) and threonine (T) residues denoted in red are frequently glycosylated. (b) O-glycan variants of the serum IgA1. N-acetylgalactosamine (GalNAc) is attached to S/T residues in the HR. The O-glycan chain can be extended by the attachment of galactose (Gal) to GalNAc residues. GalNAc or Gal can be sialylated. Due to the step-wise nature of the O-glycosylation process, the IgA1-HR O-glycoforms exhibit a wide heterogeneity. An efficient neuraminidase treatment can reduce the complexity of IgA1-HR O-glycans to a mixture of disaccharides (Gal-GalNAc) and/or monosaccharides (GalNAc). NeuAc, N-acetylneuraminic acid.
Figure 2
Figure 2
New workflow for IgA1 O-glycomic analysis by using the sequential deglycosylation protocol. (a) Protocol for the profiling of IgA1 HR O-glycans. Neuraminidase treatment reduces the types of O-glycan structures from six to two (disaccharide N-acetylgalactosamine [GalNAc]-galactose [Gal] and monosaccharide GalNAc). LC-MS spectrum contains several mass peaks of HR with O-glycans, according to the number of the attached GalNAc and Gal residues. An extracted ion chromatogram (XIC) is generated for each peak and the area under the curve (AUC) of XIC of each O-glycopeptide is determined and used to calculate the relative abundance (RA) of each O-glycoform (RA = percent of total XIC of O-glycoforms detected). (b) Protocol for the analysis of the attachment sites of galactose-deficient (Gd) O-glycan. IgA1 proteins were treated with an IgA-specific protease from Clostridium ramosum AK183. After a sequential enzymatic deglycosylation with neuraminidase and O-glycanase, that ultimately leaves only Gd O-glycans (i.e., GalNAc) attached to the amino-acid backbone, IgA1 is digested by trypsin. Precursor ions corresponding to HR with one to three Gd O-glycans are analyzed by LC-tandem MS with ETD combined with supplemental higher energy collision dissociation (HCD) activation (EThcD) to assign the attachment sites of Gd O-glycans.
Figure 3
Figure 3
Representative mass spectrum of desialylated tryptic fragment of IgA1 HR O-glycoforms. The monoisotopic m/z value of HR O-glycopeptide ions, the number of sugar moieties assigned and their charge numbers are shown above the individual peaks. Twelve mass peaks of HR with O-glycans were detected, representing molecules with three to six O-glycan chains with up to three Gd O-glycans. *Marks unassigned peaks that were triply charged ions not (glyco)peptides derived from IgA1 HR (the detailed data are shown in Supplementary Fig. S4).
Figure 4
Figure 4
Relative abundance (RA) of various HR O-glycoforms in IgA1 isolated from sera of 10 healthy controls. (a) RA determined by using an automated program, Glycan Analyzer. RA of each O-glycopeptide is shown as a box plot with glycoforms on X axis in decreasing order of abundance. The number of attached GalNAc (x) and Gal (y) residues is notes as x_y on X axis. The number of Gd O-glycans in each O-glycopeptide is shown above the box. The upper and lower limits of the boxes represent the first and third quartiles of RA%. A segment inside the rectangle shows the median and the whiskers above and below the box show the minimum and maximum values. (b) Correlation between RA determined by Glycan Analyzer and by manual assessment. Linear regression analysis revealed a strong congruence between the two methods (y = 0.994x + 0.022, R² = 0.9931).
Figure 5
Figure 5
Mass spectrum and extracted ion chromatogram (XIC) of IgA1 HR peptide and glycopeptides with Gd O-glycans after sequential deglycosylation. Sequential neuraminidase and O-glycanase treatment leaves only Gd O-glycan(s) at V222–R245 HR. The respective peaks correspond to naked V222–R245 HR and V222–R245 HR with one, two, or three Gd O-glycans. The number of GalNAc residues attached to HR is designated by the number after yellow squares. The theoretical monoisotopic mass values of “naked” V222–R245 HR peptide and V222–R245 HR glycopeptide with one to three Gd O-glycans are shown beside the peaks. The XIC for each Gd O-glycoform is shown next to the respective ion peak.
Figure 6
Figure 6
Summary of Gd O-glycan sites in the serum IgA1 HR identified by EThcD-tandem MS. (a) The extracted ion chromatogram (XIC) and attachment sites of Gd O-glycan in 1 Gd O-glycoform. (b) The XIC and attachment sites of Gd O-glycans in 2 Gd O-glycoform. (c) The XIC and attachment sites of Gd O-glycans in 3 Gd O-glycoform. The XIC is divided into several sections and the attachment sites of Gd O-glycans are shown individually. The XIC of product ions are shown in Supplementary Figs. S1–S3. Relative abundance of each isomeric glycoform is shown as the percentage of total Gd O-glycoforms. *Subsection of the 1st section, **Subsection of the 2nd section. O-glycoform includes a small amount of isomers with Gd O-glycan at S232 instead of T233. The XIC of each precursor ion (H208-R245 HR plus 1–3 Gd O-glycan) detected from five individual sample named (BM03, BM04, BW00, BW01, and BW02) are available in Supplemental Fig. S5. Relative abundance of each isomeric glycoform of individual samples are shown in Dataset 3.

References

    1. Reily C, Stewart TJ, Renfrow MB, Novak J. Glycosylation in health and disease. Nat. Rev. Nephrol. 2019;15:346–366. - PMC - PubMed
    1. Shields RL, et al. Lack of fucose on human IgG1 N-linked oligosaccharide improves binding to human Fcγ RIII and antibody-dependent cellular toxicity. J. Biol. Chem. 2002;277:26733–26740. - PubMed
    1. Shinkawa T, et al. The absence of fucose but not the presence of galactose or bisecting N-acetylglucosamine of human IgG1 complex-type oligosaccharides shows the critical role of enhancing antibody-dependent cellular cytotoxicity. J. Biol. Chem. 2003;278:3466–3473. - PubMed
    1. Quast I, et al. Sialylation of IgG Fc domain impairs complement-dependent cytotoxicity. J. Clin. Invest. 2015;125:4160–4170. - PMC - PubMed
    1. Tomana M, Schrohenloher RE, Koopman WJ, Alarcon GS, Paul WA. Abnormal glycosylation of serum IgG from patients with chronic inflammatory diseases. Arthritis Rheum. 1988;31:333–338. - PubMed

Publication types