Meta-Analysis
. 2020 Jan 20;11(1):393.
doi: 10.1038/s41467-019-14144-8.

Eighty-eight variants highlight the role of T cell regulation and airway remodeling in asthma pathogenesis

Affiliations
Meta-Analysis

Eighty-eight variants highlight the role of T cell regulation and airway remodeling in asthma pathogenesis

Thorunn A Olafsdottir et al. Nat Commun. .

Abstract

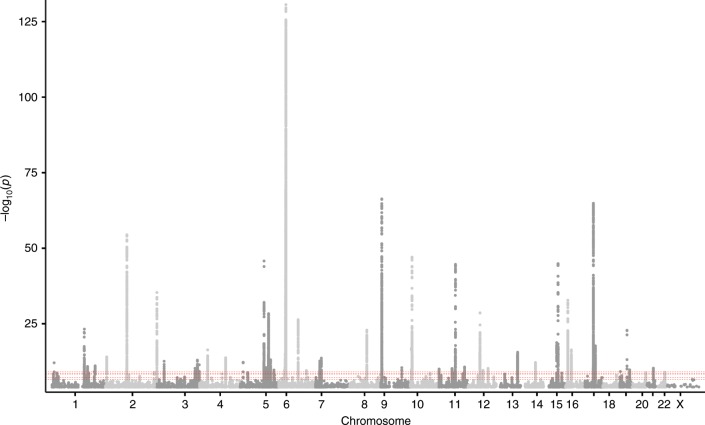
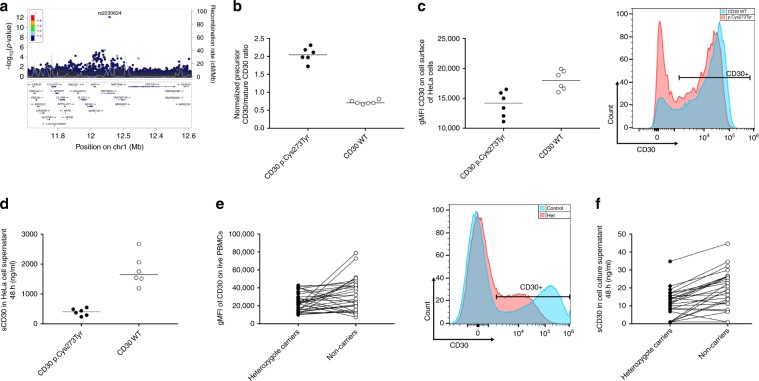
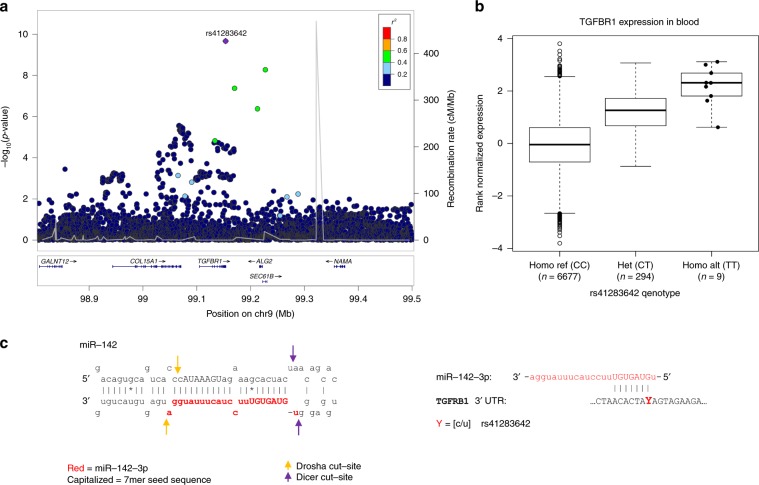
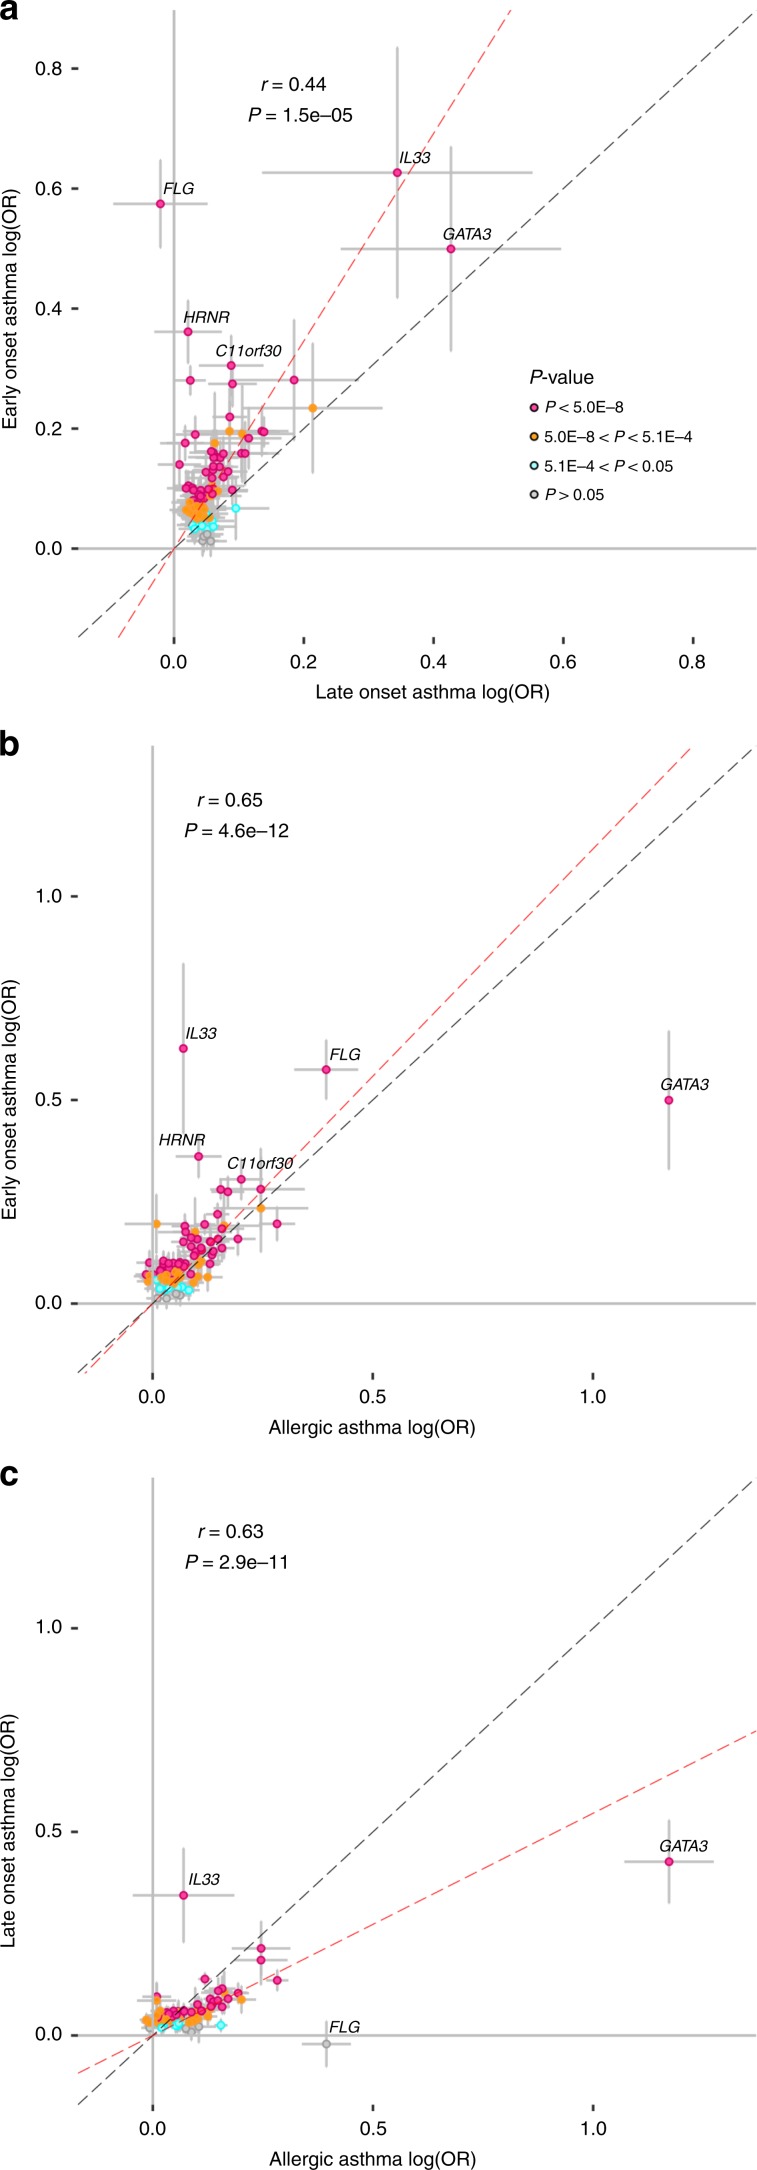
Asthma is one of the most common chronic diseases affecting both children and adults. We report a genome-wide association meta-analysis of 69,189 cases and 702,199 controls from Iceland and UK biobank. We find 88 asthma risk variants at 56 loci, 19 previously unreported, and evaluate their effect on other asthma and allergic phenotypes. Of special interest are two low frequency variants associated with protection against asthma; a missense variant in TNFRSF8 and 3' UTR variant in TGFBR1. Functional studies show that the TNFRSF8 variant reduces TNFRSF8 expression both on cell surface and in soluble form, acting as loss of function. eQTL analysis suggests that the TGFBR1 variant acts through gain of function and together with an intronic variant in a downstream gene, SMAD3, points to defective TGFβR1 signaling as one of the biological perturbations increasing asthma risk. Our results increase the number of asthma variants and implicate genes with known role in T cell regulation, inflammation and airway remodeling in asthma pathogenesis.


Conflict of interest statement

Authors affiliated with deCODE genetics/Amgen Inc. declare competing interests as employees. The remaining authors declare no competing interests.

Figures

Fig. 1
Fig. 1. Sequence variants associating with asthma.
Manhattan plot for the Iceland-UK BB meta analyses of asthma (Ncases = 69,189). In all, 56 regions harbor genome-wide significant signals. Variants are plotted by chromosomal position (x-axis) and −log10P values (y-axis). Dotted line indicate the different P value thresholds applied based on variant annotation. The adjusted significance thresholds are represented by horizontal dashed line from bottom to the top in the following order: 2.6 × 10−7 for variants with high impact (N = 8,464), 5.1 × 10−8 for variants with moderate impact (N = 149,983), 4.6 × 10−9 for low-impact variants (N = 2,283,889), 2.3 × 10−9 for other variants in DNase I hypersensitivity sites (N = 3,913,058) and 7.9 × 10−10 for all other variants (N = 26,108,038).
Fig. 2
Fig. 2. Variant associating with reduced asthma risk affects protein expression and shedding of CD30.
a Locus plots showing association with asthma where the lead variant p.Cys273Tyr (rs2230624) is colored in purple. Other variants are colored by degree of correlation (r2) with the lead variant. b Protein simple WES analysis of CD30 expression in cell lysates from HeLa cells overexpressing CD30 wild-type or variant p.Cys273Tyr CD30; graph showing ratio of CD30 precursor/mature intensity. c Surface expression of CD30 on HeLa cells over-expressing wild-type or p.Cys273Tyr CD30 measured by flow cytometry, displayed as geometric mean of fluorescense intensity (gMFI). Histogram showing a representative CD30 surface expression p.Cys273Tyr (red) and CD30 WT (blue). d sCD30 levels (ng/ml) in cell culture supernatant from HeLa cells over-expressing wild-type or p.Cys273Tyr CD30. e Surface expression of CD30 on stimulated PBMCs from heterozygous p.Cys273Tyr carriers and age and gender matched non-carriers, measured by flow cytometry, displayed as gMFI. Histogram showing a representative CD30 surface expression from one pair of PBMCs in heterozyogus CD30 p.Cys273Tyr carrier (red) and age and gender matched non-carrier (blue). f sCD30 levels (ng/ml) in cell culture supernatant of PBMCs from p.Cys273Tyr heterozygotes and non-carriers. The dots in plots bd represent individual experiments. The dots in plots e and f represent individual donors. Lines in panel bd indicate median level. In plots e and f the line between carriers and non-carriers indicated age and gender matched pairs.. Two-tailed Wilcoxon matched-pairs signed rank test was used to test for significant differences in PBMCs. Two-tailed paired t-test was used to test for significant differences in HeLa cells. Source data are provided as a Source Data file.
Fig. 3
Fig. 3. Variant in the 3’UTR of TGFBR1 increases TGFBR1 expression in blood and associates with reduced asthma risk.
a Locus plot showing association with asthma where the lead variant rs41283642 is colored in purple. Other variants are colored by degree of correlation (r2) with the lead variant. b Box plot showing the expression of TGFβR1 in blood of rs41283642_T non-carriers (CC, N = 6677), heterozygotes (CT, N = 294) and homozygotes (TT, N = 9) based on RNA-Seq data; P = 7.24E-101, effect = 1.18 S.D. corresponding to 15.2% increased expression of TGFBR1 per allele. The bottom and top of the boxes correspond to the 25th (Q1) and 75th (Q3) percentiles, the line inside the box corresponds to the median, and the whiskers are located at max(min(Expression), Q1 – 1.5 IQR) and min(max(Expression), Q3 + 1.5 IQR), respectively (where IQR is the interquartile range = Q3 – Q1). c Schematic representation of the primary miR-142 transcript, derived from MIR142 located on chromosome 17q22. The 3′end of miR-142 forms miR-142-3p which is known to targets multiple mRNA transcripts including TGFRB1. The predicted binding site for miR-142-3p at the 3′UTR of TGFBR1 is shown wherein Y represents the location of the rs41283642. The reference allele is C, forming a 7mer perfect complementary sequence to the seed sequence of miR-142-3p whereas the protective asthma T_allele (U in RNA), disrupts the 7mer binding site. Source data are provided as a Source Data file.
Fig. 4
Fig. 4. Effect of asthma associating variants in asthma sub- phenotypes.
Early onset asthma (EOA), Late Onset Asthma (LOA) and Allergic Asthma (AA). The x-axis and the y-axis show the logarithm of the estimated odds ratios for a EOA and LOA, b AA and EOA, and c AA vs LOA, respectively. All effects are shown for the asthma risk increasing allele based on meta-analysis of the Icelandic and the UK BB sample sets. Error bars represent 95% confidence intervals. The red line represents results from a simple linear regression through the origin using MAF (1-MAF) as weights and the gray line indicates the reference line with slope = 1. The weighted correlation coefficients (r) and P values (t-test) are shown in the graphs. Source data are provided as a Source Data file.

Similar articles

Cited by

References

    1. Dharmage SC, Perret JL, Custovic A. Epidemiology of asthma in children and adults. Front. Pediatr. 2019;7:246. doi: 10.3389/fped.2019.00246. - DOI - PMC - PubMed
    1. Lambrecht BN, Hammad H. The immunology of asthma. Nat. Immunol. 2015;16:45–56. doi: 10.1038/ni.3049. - DOI - PubMed
    1. Kuruvilla ME, Lee FE, Lee GB. Understanding asthma phenotypes, endotypes, and mechanisms of disease. Clin. Rev. Allergy Immunol. 2019;56:219–233. doi: 10.1007/s12016-018-8712-1. - DOI - PMC - PubMed
    1. Welter D, et al. The NHGRI GWAS Catalog, a curated resource of SNP-trait associations. Nucleic Acids Res. 2014;42:D1001–D1006. doi: 10.1093/nar/gkt1229. - DOI - PMC - PubMed
    1. Vicente CT, Revez JA, Ferreira MAR. Lessons from ten years of genome-wide association studies of asthma. Clin. Transl. Immunol. 2017;6:e165. doi: 10.1038/cti.2017.54. - DOI - PMC - PubMed

Publication types

MeSH terms