. 2020 Feb;30(2):105-118.
doi: 10.1038/s41422-020-0273-1. Epub 2020 Jan 20.

A novel pathway regulates social hierarchy via lncRNA AtLAS and postsynaptic synapsin IIb

Affiliations

A novel pathway regulates social hierarchy via lncRNA AtLAS and postsynaptic synapsin IIb

Mei Ma et al. Cell Res. 2020 Feb.

Erratum in

Abstract

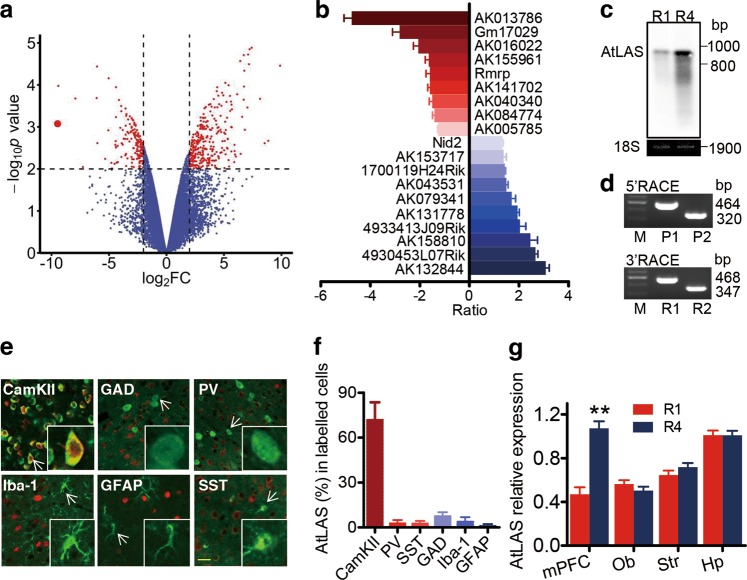
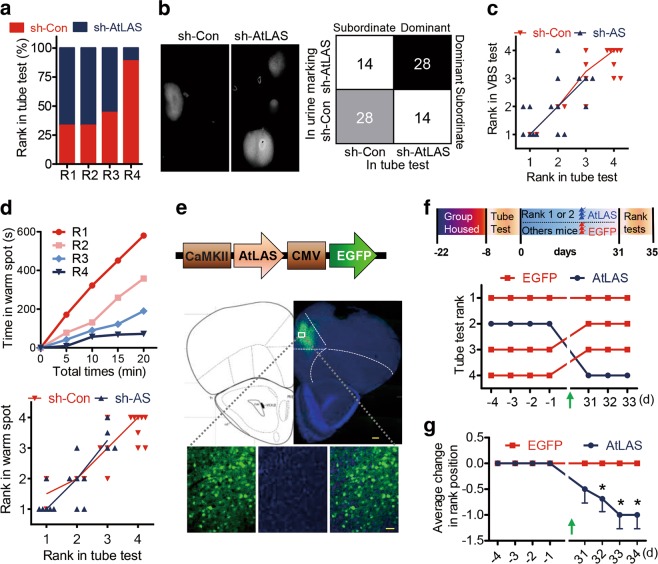
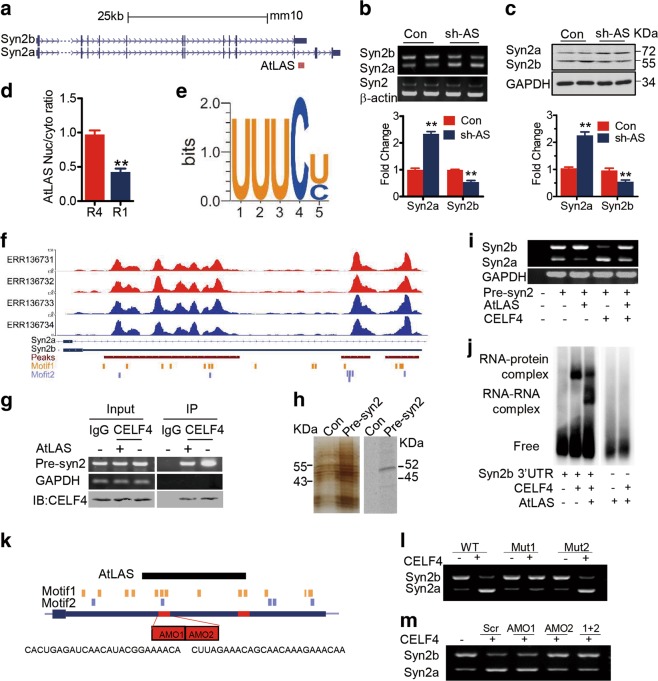
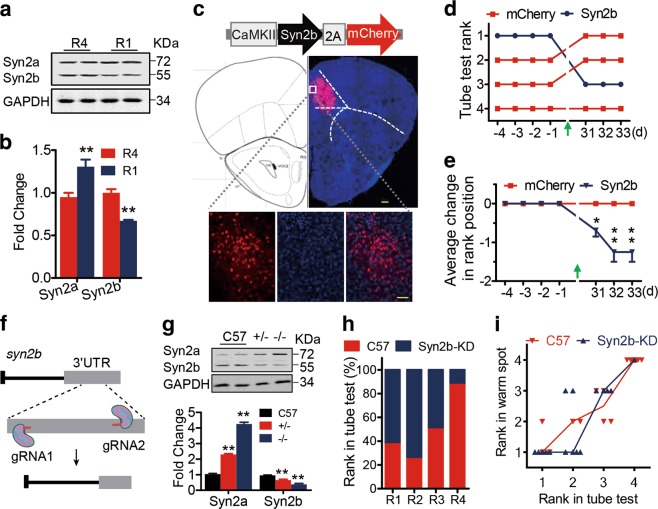
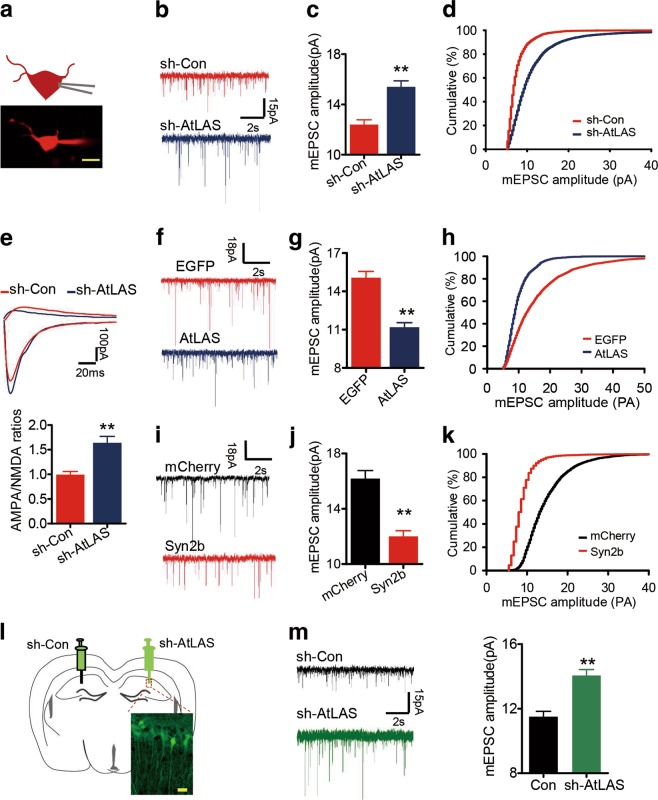
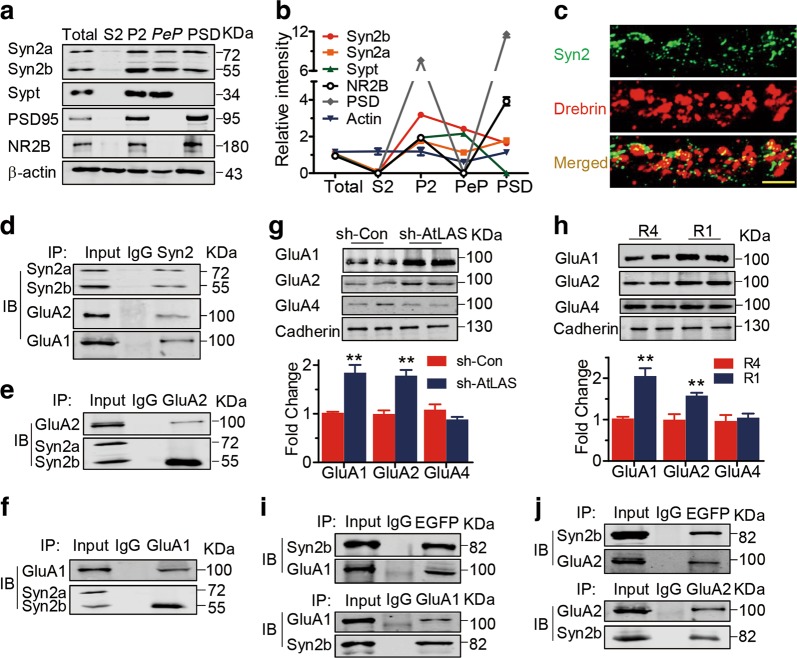
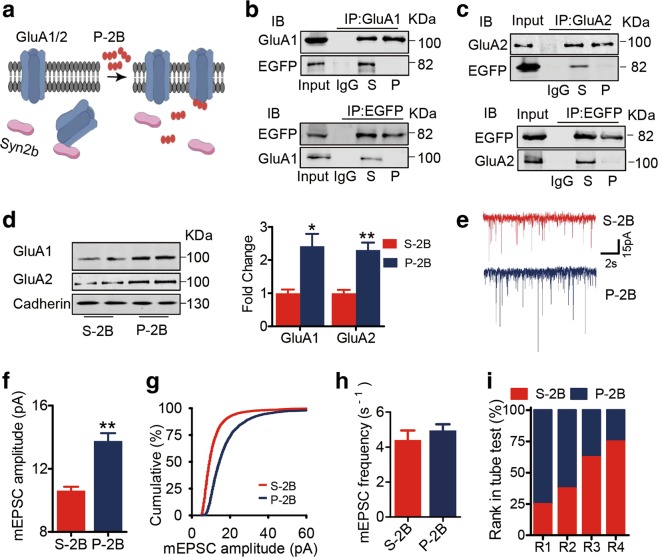
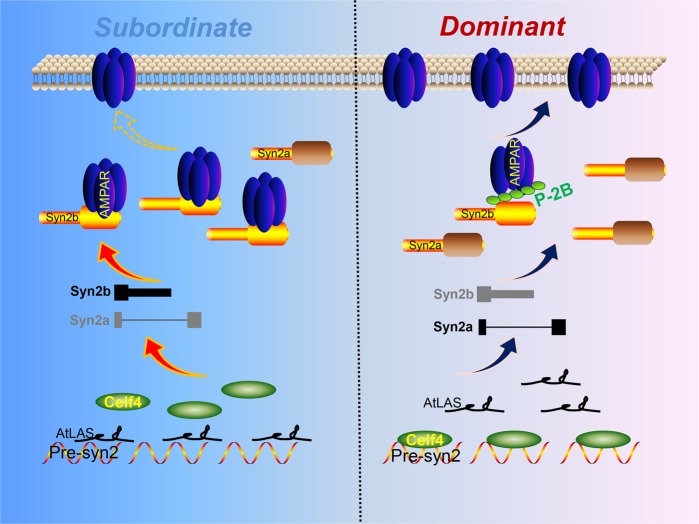
Dominance hierarchy is a fundamental phenomenon in grouped animals and human beings, however, the underlying regulatory mechanisms remain elusive. Here, we report that an antisense long non-coding RNA (lncRNA) of synapsin II, named as AtLAS, plays a crucial role in the regulation of social hierarchy. AtLAS is decreased in the prefrontal cortical excitatory pyramidal neurons of dominant mice; consistently, silencing or overexpression of AtLAS increases or decreases the social rank, respectively. Mechanistically, we show that AtLAS regulates alternative polyadenylation of synapsin II gene and increases synapsin 2b (syn2b) expression. Syn2b reduces AMPA receptor (AMPAR)-mediated excitatory synaptic transmission through a direct binding with AMPAR at the postsynaptic site via its unique C-terminal sequence. Moreover, a peptide disrupting the binding of syn2b with AMPARs enhances the synaptic strength and social ranks. These findings reveal a novel role for lncRNA AtLAS and its target syn2b in the regulation of social behaviors by controlling postsynaptic AMPAR trafficking.


Conflict of interest statement

The peptide used to block the binding of syn2b with AMPAR has been submitted to the Patent Office of the Peopleʼs Republic of China by L.Q.Z., D.L., W.X., M.M., X.H. (Application No. 201811638624.0). No other conflicts of interests are declared for all authors.

Figures

Fig. 1
Fig. 1. AtLAS is the most significantly regulated lncRNA in the mPFC in dominant mice.
a Volcano plot shows the fold change (FC) and significance of lncRNAs from the mPFC area of rank-1 (R1) compared to rank-4 (R4) mice. P values were determined by two-tailed t-test. FC > 4 and P < 0.01 are indicated by red color and dashed line; AK013786/AtLAS is highlighted by a bigger red circle. b Validation of deregulated lncRNAs in high- and low-ranked mice determined by qRT-PCR. Data are means (FC) ± SEM relative to R4 (n = 6). c Northern blot of AtLAS with total RNA from R1 and R4 mice mPFC tissues. 18S rRNA serves as a loading control. The data are representative of at least three independent experiments. d AtLAS expression detected in RACE experiments. Results were repeated in at least three independent experiments. e The distribution of AtLAS in different cell types of mPFC in immunofluorescence experiments using the antibodies for CamKII, GAD, PV, Iba1, GFAP or SST (green) and FISH signals for the AtLAS (red). Scale bar, 20 μm. f Quantification of AtLAS distribution in six types of neurons, n = 17–20 from five mice. g The relative expression profiles of AtLAS in different brain areas from dominant and subordinate mice detected in qRT-PCR. Ob, olfactory bulb; Str, striatum; Hp, Hippocampus, n = 5 mice. Two-tailed t-test, **P < 0.01. Data are presented as means ± SEM.
Fig. 2
Fig. 2. Bidirectional control of AtLAS in the mPFC results in hierarchical rank shift.
a Summary of the rank ratio for mice injected with sh-AtLAS or with the sh-Con in the tube tests (n = 18 for each group). χ2 test, linear-linear association, χ2 = 5.531, Ptrend = 0.019. b Representative picture of the urine-marking patterns of sh-Con- and sh-AtLAS-injected mice revealed by ultraviolet light (left). Contingency table shows the number of mice in each category. n = 42 pairs from eight cages (right). χ2 test, χ2 = 5.333, P = 0.004. Gray area represents for dominant mice in two tests, black for subordinate ones, and white for different results. c The correlation analysis for the ranks in the tube tests with average weight-change ranks in visible burrow system (VBS) tests for the mice with the injection of sh-AtLAS (sh-AS) or sh-Con virus. Linear regression, n = 8 cages, r = 0.813, P = 1.59 × 10–8. d Cumulative time spent in the warm spot for four grouped mice previously ranked in the tube tests (top). The correlate analysis for the time spent in the warm spot and the ranks in the tube tests after mice were injected with sh-AtLAS or sh-Con (bottom). Linear regression, n = 8 cages, r = 0.864, P = 1.87 × 10–8. e Schematic diagram illustrating the CaMKII:AtLAS viral construct (top). Representative confocal image shows infection of AtLAS-EGFP into the mPFC (bottom). Scale bars, 200 μm (top), 50 μm (bottom). f Experimental design (top) and example of rank-shift in the tube tests for four grouped mice before and after the injection of AtLAS or EGFP virus (bottom). g Summary graph for the rank-shift in the tube test for mice before and after AtLAS or EGFP injection (n = 8 cages). Wilcoxon-signed rank test, P = 1, 1, 1, 1 for EGFP, P = 0.102, 0.039, 0.023, 0.023 for AtLAS. Data are presented as means ± SEM.
Fig. 3
Fig. 3. AtLAS regulates synapsin II isoforms expression by CELF4.
a The genomic view of mouse Syn2 and AtLAS. bc The mRNA (b) and protein (c) levels of syn2a and syn2b expression after mice were injected with AAV virus carrying sh-AS or scrambled control (Con). n = 4 replicates/group. Two-way ANOVA, post-hoc, Bonferroni, **P < 0.01. Data are presented as means ± SEM. d Nuclear/cytosolic AtLAS ratio from the mPFC areas of R4 (red) and R1 (blue) mice (n = 5, 6). Two-tailed t-test, **P < 0.01. Data are presented as means ± SEM. e Sequence logo of CELF4 recognition motif 1 identified from MEME analysis of pre-syn2 iClip sequence read clusters. f IClip data indicate three binding peaks within the syn2b pre-mRNA 3′UTR and two conserved CELF4 binding motifs. g The HEK293T cells were transfected with pre-syn2 only or combined with AtLAS, then the cell lysates were immuno-precipitated with CELF4 antibody. The pellets were subjected to PCR assay. The results were repeated in 3 independent experiments. h RNA pull-down analysis shows that CELF4 is a pre-syn2 binding protein detected in silver-staining (left) and western blot (right). n = 3 independent experiments. i PCR validates the changes in the alternative splicing of Syn2 target-exons upon AtLAS or/and CELF4 transfection in HEK293T cell overexpressing pre-syn2 (n = 4 independent experiments). j REMSA experiment using recombinant proteins CELF4 or/and AtLAS combined with syn2b 3′UTR (including the alternative splicing site). k Generation of the two mutants of pre-syn2 (Mut1 and Mut2) by deleting the binding sites of AtLAS to CELF4 (shown in red). The specific sequences of AMO1 and AMO2 are also listed. l PCR validates the changes in the alternative splicing of Syn2 target-exons upon co-expression of CELF4 with wild-type (WT) or Mut1/2 pre-syn2 in HEK293T cells. (n = 4 independent experiments). m PCR validates the changes in the alternative splicing of Syn2 target-exons upon transfection of CELF4 with AMO1 or/and AMO2 together with WT pre-syn2 in HEK293T cells.
Fig. 4
Fig. 4. Syn2b but not syn2a participates in the establishment of social dominance.
a, b The protein levels of syn2 isoforms from the mPFC of R4 and R1 mice were detected in western blot (a) and their quantification in  (b) (n = 3). Two-way ANOVA, post-hoc, Bonferroni, **P < 0.01. Data are presented as means ± SEM. c Schematic diagram shows the syn2b-mCherry virus construct (top) and representative images for virus infection (bottom) in the dmPFC. Scale bars, 200 μm (top), 50 μm (bottom). d, e Rank-shift of grouped mice in the tube tests before and 30 days after syn2b-mCherry (Syn2b) or mCherry control virus (mCherry) injection (n = 8 cages for each group). R1 and R2 mice were randomly selected for the syn2b-virus injection, and other mice for mCherry control virus injection. Wilcoxon matched-pairs signed rank test, P = 1, 1, 1 for mCherry, P = 0.02, 0.007, 0.007 for syn2b. f The diagram shows the design of syn2b-KD mice by using CRISPR-Cas9 system to delete its 3′UTR with two specific sgRNAs. g Analysis of the effect of syn2b-KD on the expression of syn2 isoforms. Data are representative of three independent experiments. +/−, heterozygous; −/−, homozygous mice. Two-way ANOVA, post-hoc, Bonferroni, **P < 0.01. h Summary of rank ratio in the tube tests for mice from the same cage (2 of C57 and 2 of syn2b-KD mice). n = 8 cages for each test; χ2 test, linear-linear association, χ2 = 4.747, Ptrend = 0.029. i The correlation analysis for the ranks in the tube test with the ranks in the  warm spot test for C57 and syn2b-KD mice. Linear regression, n = 8 cages, r = 0.90, P = 2.42 × 10−12.
Fig. 5
Fig. 5. AtLAS-syn2b constrains the postsynaptic AMPAR membrane expression.
a A representative neuron image in the patch clamp. Scale bar, 10 μm. bRepresentative traces of mEPSCs (b) from mPFC neurons infected with sh-Con or sh-AtLAS virus. The mean mEPSC amplitudes (c) and representative cumulative distribution of mEPSC amplitudes (d) were analyzed. n = 30 neurons from five mice for each group. Two-tailed t-test, **P < 0.01. Data are presented as means ± SEM. e The AMPA to NMDA current ratio was altered in the mPFC neurons from mice infected with sh-AtLAS. Representative traces from whole-cell voltage-clamp experiments shows NMDAR- and AMPAR-mediated currents recorded in a mPFC pyramidal neuron from mice infected with sh-Con (red) or sh-AtLAS (blue). Two-tailed t-test, **P < 0.01. fRepresentative traces of mEPSCs (f) from mPFC neurons infected with full-length AtLAS or control (EGFP). The mean mEPSC amplitudes (g) and representative cumulative distribution of mEPSC amplitudes (h) were analyzed. n = 25 neurons from four mice for each group, means ± SEM, two-tailed t-test, **P < 0.01. i–k Representative traces of mEPSCs (i) from mPFC neurons infected with coding sequence of syn2b or control (mCherry). The mean mEPSCs amplitudes (j) and representative cumulative distribution of mEPSC amplitudes (k) were analyzed. n = 27 neurons from five mice for each group. Means ± SEM, two-tailed t-test, **P < 0.01. l, m Representative EGFP expression (l) of the sparse lenti-virus infection in hippocampal CA1 slices after the delivery of sh-Con or sh-AtLAS constructs, the representative traces and quantitative analysis of mEPSC are shown in (m). Scale bar, 20 μm. n = 32 neurons from five mice for each group. Two-tailed t-test, **P < 0.01.
Fig. 6
Fig. 6. Syn2b physically associates with AMPA receptors via its C-terminus.
a, b The different synaptic components were extracted from the mPFC and then subjected to immunoblot (a) using the antibodies as indicated and the quantitative analysis (b, n = 5). Synaptophysin (sypt) was used as a presynaptic marker, and PSD-95 as a postsynaptic marker. β-actin serves as the loading control. c The PFC primary neurons were cultured to DIV12 and immunolabeled with syn2 and drebrin, a postsynaptic marker. Scale bar, 3 μm. df Immunoblot shows the interactions between AMPAR subunits (GluA1 and GluA2) and syn2b in the mPFC homogenates detected by co-IP. n = 3 independent experiments. g Levels of cell-surface GluA1/2/4 from the mPFC areas of mice injected with sh-Con or sh-AtLAS virus (top) were quantitatively analyzed (bottom). Means ± SEM, two-tailed t-test, **P < 0.01. h Western blot assays indicate the surface expression of GluA1, GluA2 and GluA4 in the mPFC of R4 and R1 mice. Means ± SEM, two-tailed t-test, **P < 0.01. iCo-IP shows the interactions between EGFP-syn2b and GluA1 (i) or GluA2 (j) in HEK293T cells 48 h after the co-transfection. These data were repeated in at least three independent experiments.
Fig. 7
Fig. 7. P-2B peptide disrupts syn2b-AMPAR binding and leads to the enhanced synaptic efficacy and elevated social hierarchy.
a A diagram illustrates that P-2B disrupts the binding of syn2b to AMPAR and prompts GluA1/GluA2 presence at synapses. b, c Co-IP shows the interactions between GluAs with syn2b after cells treated with P-2B (P) or S-2B (S). The HEK293T cells were transfected with GluA1 or GluA2 and EGFP-syn2b. 12 h post transfection, the cells were treated with S-2B or P-2B (10 μM) every 12 h for three times, then co-IP was performed using these cell lysates. d The mice were injected with P-2B or S-2B at the dose of 10 mg/kg for 10 days (intraperitoneal). The membrane fraction of mPFC homogenates were purified for western blot analysis by using the antibodies indicated. Representative immunoblots (right) and quantification (left). n = 4 for each group. Two-tailed t-test, *P < 0.05; **P < 0.01. eh Relative representative traces (e), summary of the relative mean and representative cumulative distribution of amplitudes (f, g), and mean frequencies (h) of mEPSC from mPFC neurons treated with P-2B or S-2B. n = 30 neurons from six mice for each group. Two-tailed t-test, **P < 0.01. i Rank percentage in the tube test after mice treated with P-2B or S-2B for 10 days (10 mg/kg, intraperitoneal injection, n = 8 cages for each group). χ2 test, linear-linear association χ2 = 4.747, Ptrend = 0.029.
Fig. 8
Fig. 8. Proposed working model of AtLas-syn2b in establishing social hierarchy status.
In subordinate mice, AtLAS binds with the pre-mRNA of syn2 and regulates the syn2a/b ratio by inhibiting CELF4-mediated alternative splicing, which leads to the APA and the increased expression of syn2b. Syn2b binds with AMPAR via its unique C-terminus to restrain the membrane insertion of AMPAR, the weakened synaptic strength in the mPFC renders social submissive roles in these animals. Conversely, in dominant mice, loss of AtLAS and the reduction of syn2b pose less inhibition on AMPAR membrane expression, and then enhance the synaptic strength in the mPFC and social ranks. The effect can also be achieved by the application of P-2B to disturb syn2b/AMPAR interaction.

Comment in

Similar articles

Cited by

References

    1. Sapolsky RM. The influence of social hierarchy on primate health. Science. 2005;308:648–652. - PubMed
    1. Zink CF, et al. Know your place: neural processing of social hierarchy in humans. Neuron. 2008;58:273–283. - PMC - PubMed
    1. Nagy M, Akos Z, Biro D, Vicsek T. Hierarchical group dynamics in pigeon flocks. Nature. 2010;464:890–893. - PubMed
    1. Singer T. The past, present and future of social neuroscience: a European perspective. NeuroImage. 2012;61:437–449. - PubMed
    1. Wang F, et al. Bidirectional control of social hierarchy by synaptic efficacy in medial prefrontal cortex. Science. 2011;334:693–697. - PubMed

Publication types