. 2020 Mar;4(3):255-264.
doi: 10.1038/s41562-019-0810-4. Epub 2020 Jan 20.

Clustering of health, crime and social-welfare inequality in 4 million citizens from two nations

Affiliations

Clustering of health, crime and social-welfare inequality in 4 million citizens from two nations

Leah S Richmond-Rakerd et al. Nat Hum Behav. 2020 Mar.

Abstract

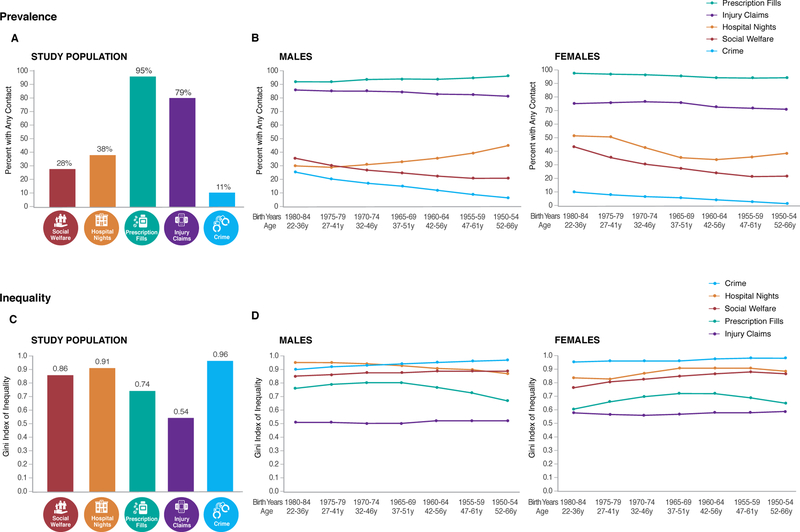
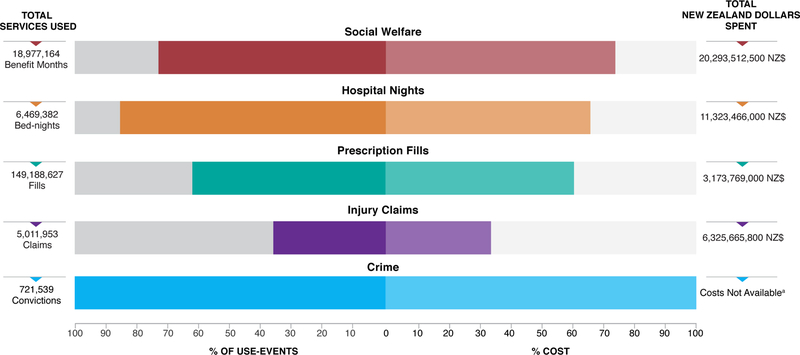
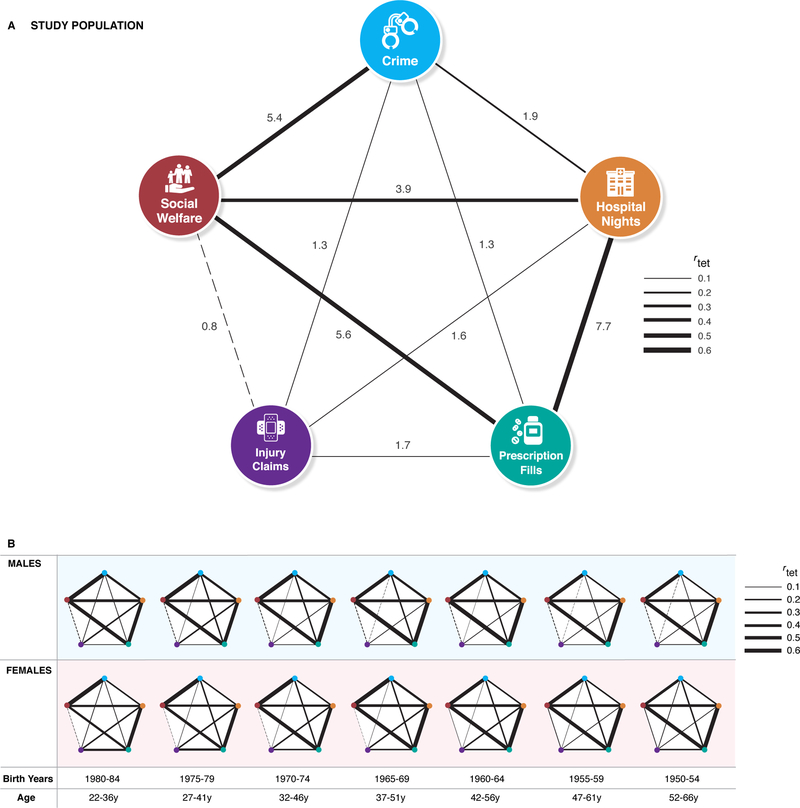
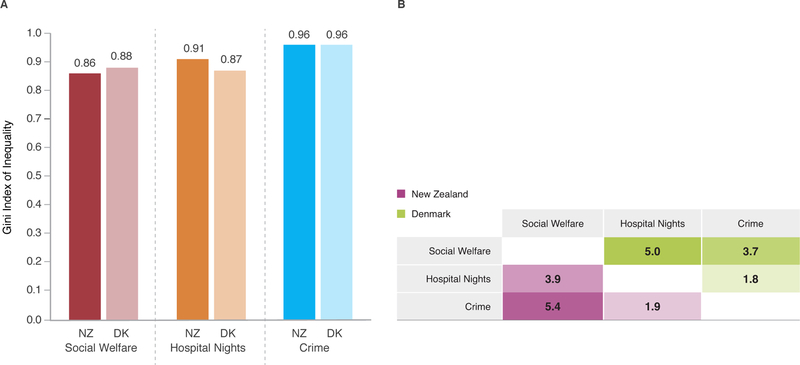
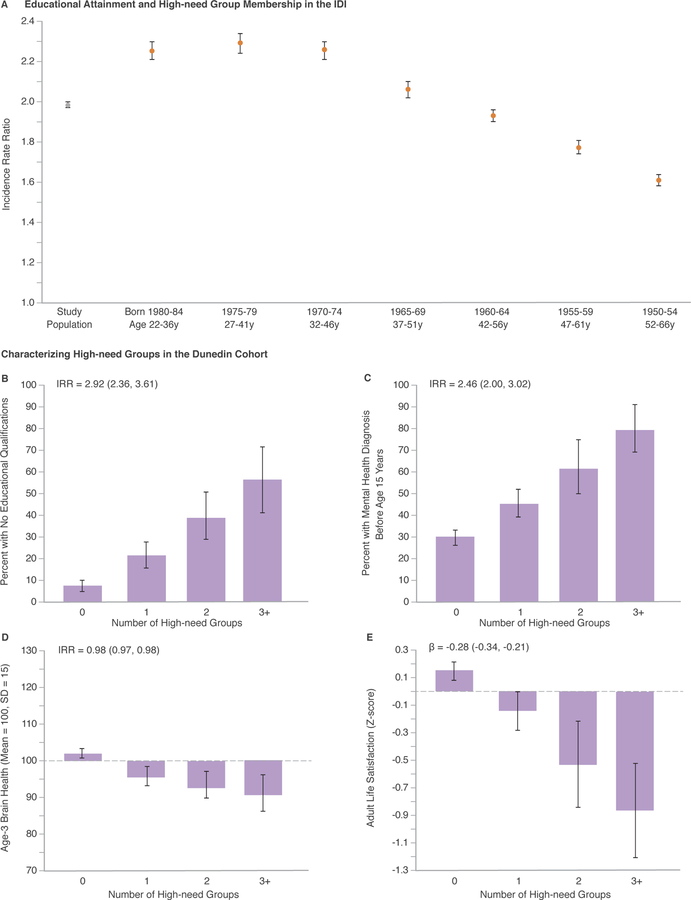
Health and social scientists have documented the hospital revolving-door problem, the concentration of crime, and long-term welfare dependence. Have these distinct fields identified the same citizens? Using administrative databases linked to 1.7 million New Zealanders, we quantified and monetized inequality in distributions of health and social problems and tested whether they aggregate within individuals. Marked inequality was observed: Gini coefficients equalled 0.96 for criminal convictions, 0.91 for public-hospital nights, 0.86 for welfare benefits, 0.74 for prescription-drug fills and 0.54 for injury-insurance claims. Marked aggregation was uncovered: a small population segment accounted for a disproportionate share of use-events and costs across multiple sectors. These findings were replicated in 2.3 million Danes. We then integrated the New Zealand databases with the four-decade-long Dunedin Study. The high-need/high-cost population segment experienced early-life factors that reduce workforce readiness, including low education and poor mental health. In midlife they reported low life satisfaction. Investing in young people's education and training potential could reduce health and social inequalities and enhance population wellbeing.


Conflict of interest statement

Competing interests: The authors declare no competing interests.

Figures

Figure 1.
Figure 1.. Nationwide data capture of poor health, crime, and social-welfare dependency in 1.7 million New Zealanders.
We obtained information about our five sectors of interest – social-welfare benefits, public-hospital nights, prescription-drug fills, injury-insurance claims, and criminal convictions – from records maintained by the New Zealand Ministry of Social Development, Ministry of Health, Pharmaceutical Management Agency, Accident Compensation Corporation, and Ministry of Justice, respectively. To account for the amount of time individuals were eligible to appear in New Zealand government records, we obtained information about mortality and time overseas from records maintained by the New Zealand Department of Internal Affairs and Ministry of Business, Innovation and Employment, respectively.
Figure 2.
Figure 2.. Inequality in the distributions of poor health, crime, and social welfare.
The figure shows that contact with health and social sectors is common, but use-events are highly concentrated. Prevalence estimates indicate the percentages of the NZIDI study population (Panel A) and each age-and-sex grouping (Panel B) that had any contact with the five health and social sectors during the 10-year observation period (July 2006-June 2016). The Gini coefficients indicate the degree of inequality in the distribution of use-events in each sector, for the study population (Panel C) and each age-and-sex grouping (Panel D). Gini coefficients can range from 0.0 (perfect equality) to 1.0 (perfect inequality). Study population N=1,711,590.a aRandomly rounded to a base of three, per the confidentiality rules of Statistics New Zealand.
Figure 3.
Figure 3.. Impact of high-need/high-cost users.
The figure shows that in each of the five health and social sectors, 10% of the NZIDI study population accounted for a disproportionate share of use-events (left panel) and costs (right panel). Totals were accumulated across the 10-year observation period (July 2006-June 2016). Per the confidentiality rules of Statistics New Zealand, counts were randomly rounded to a base of three and dollar values were rounded to the nearest 100. aAlthough objective costs were not available for criminal convictions, only 10.7% of the study population had a conviction during the observation period, indicating that high-need users accounted for virtually all dollars spent in this sector.
Figure 4.
Figure 4.. Aggregation of poor health, crime, and social-welfare dependency.
The figure shows that high-need users in one sector were more likely to reappear as high-need in other sectors too (with the exception of the relation between social welfare and injury claims). Estimates are odds ratios. The corresponding tetrachoric correlations (rtet) were used to scale the bars. Dashed lines indicate a negative correlation. Odds ratios, 95% confidence limits, and p-values for the NZIDI study population and each age-and-sex grouping are reported in Supplementary Tables 3 and 4.
Figure 5.
Figure 5.. Replication in Danish nationwide registers linked to 2.3 million citizens.
Concentration and aggregation were also evident in Danish nationwide registers. Gini coefficients of inequality in the Danish registers were strikingly similar to those in the New Zealand registers (Panel A). Also consistent with findings in the NZIDI, high-need users in one sector were more likely to reappear as high-need in other sectors too (Panel B). Estimates in Panel B are odds ratios. The 95% confidence limits are as follows: social welfare with hospital nights (NZ=3.94 [3.89, 4.00], DK=5.00 [4.94, 5.05]); social welfare with crime (NZ=5.35 [5.28, 5.42], DK=3.74 [3.69, 3.78]); hospital nights with crime (NZ=1.93 [1.90, 1.96], DK=1.75 [1.73, 1.78]). P-values for all associations are <0.001. NZ=New Zealand, DK=Denmark.
Figure 6.
Figure 6.. Characterizing high-need users.
Human-capital factors predicted the number of high-need groups to which individuals belonged. Early school-leaving (Panels A and B), early-onset psychiatric disorder (Panel C), and low childhood brain health (Panel D) characterized individuals who belonged to multiple high-need groups. The relation between educational attainment and high-need group membership was comparable in the NZIDI 1970–74-born age-band (Panel A: IRR=2.29, 95% CI [2.25, 2.34]) and the Dunedin 1972–73 cohort (Panel B: IRR=2.92 [2.36, 3.61]). In midlife, members of multiple high-need groups reported the poorest life satisfaction (Panel E). P-values for all associations are <0.001. Effect sizes (Pearson’s r and Cohen’s d) for the associations between human-capital factors and high-need group membership are reported in Supplementary Table 7. Error bars and values in parentheses are 95% confidence intervals. Education data were available for 78.9% of the NZIDI study population. Dunedin cohort N=940. IRR=incidence rate ratio.

References

    1. Alvaredo F, Chancel L, Piketty T, Saez E, Zucman C, eds. World Inequality Report 2018 (Belknap Press, 2018).
    1. International Monetary Fund. Fiscal Monitor: Tackling Inequality (IMF, October 2017).
    1. OECD; Income Inequality Update (November 2016).
    1. Keeley B. Income Inequality: the Gap Between Rich and Poor (OECD Publishing, 2015).
    1. Goodman D, Fisher E & Chang C. The Revolving Door: A Report on U.S. Hospital Readmissions (Robert Wood Johnson Foundation, 2013).

Publication types

MeSH terms