. 2020 Feb;21(2):221-231.
doi: 10.1038/s41590-019-0582-z. Epub 2020 Jan 20.

Transcriptomic and epigenetic mechanisms underlying myeloid diversity in the lung

Affiliations

Transcriptomic and epigenetic mechanisms underlying myeloid diversity in the lung

Eniko Sajti et al. Nat Immunol. 2020 Feb.

Abstract

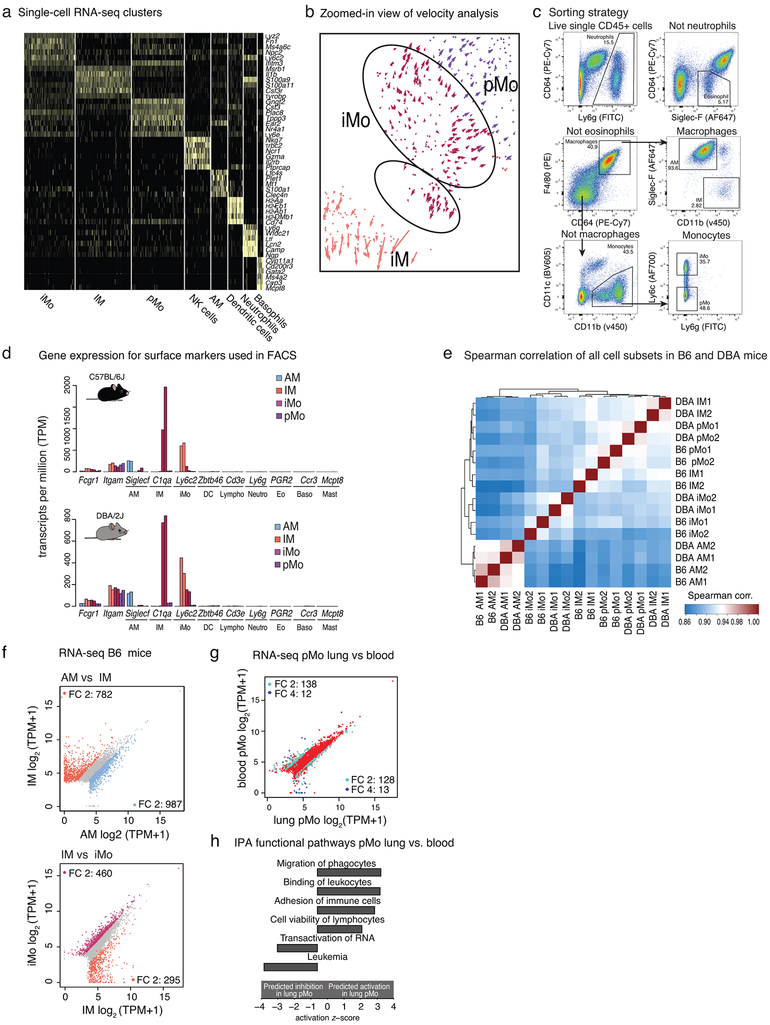
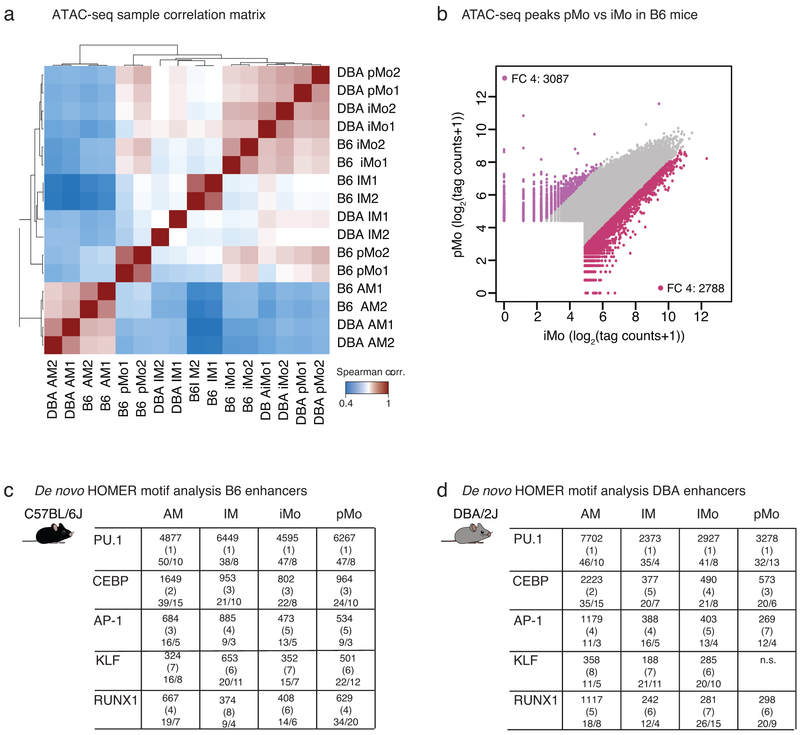
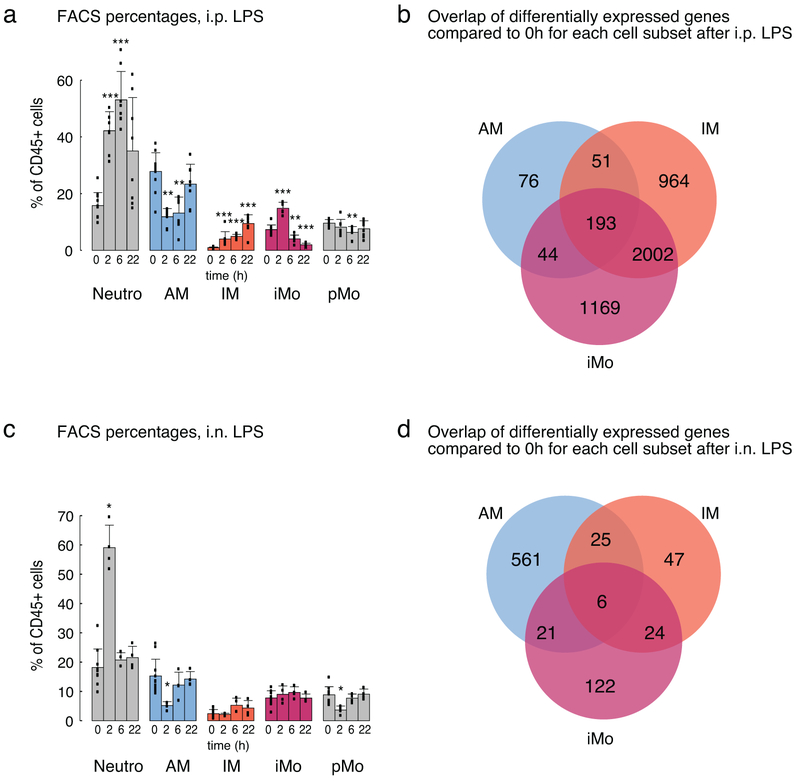
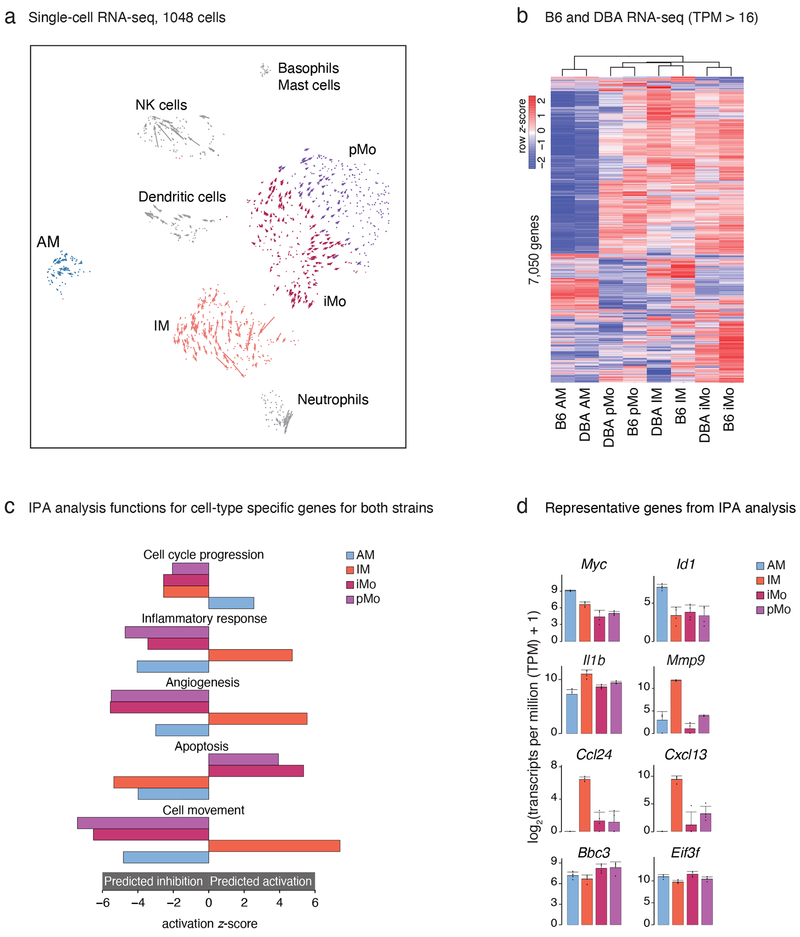
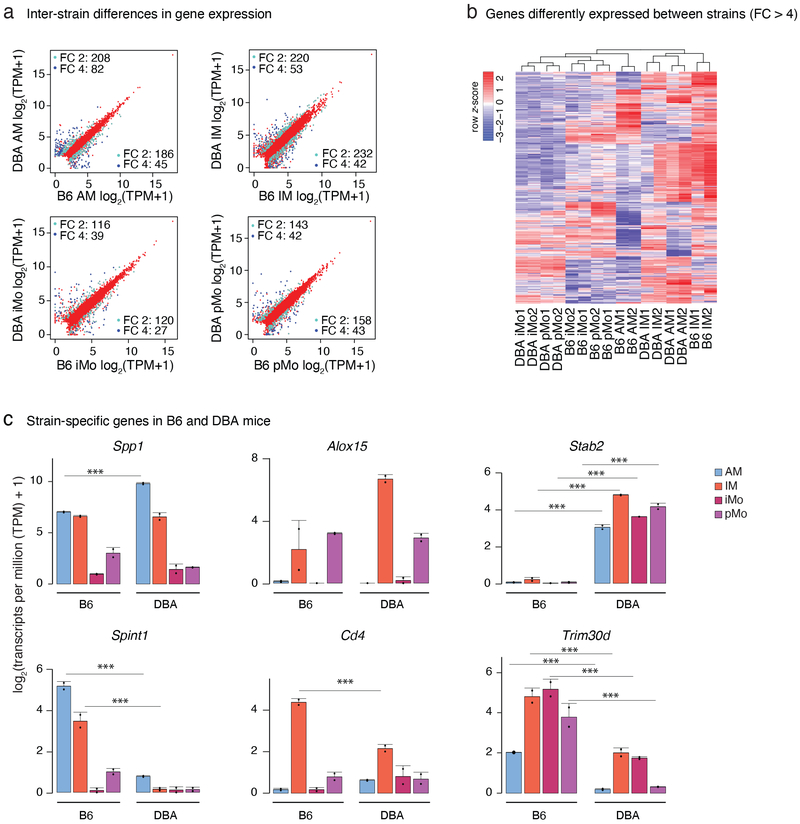
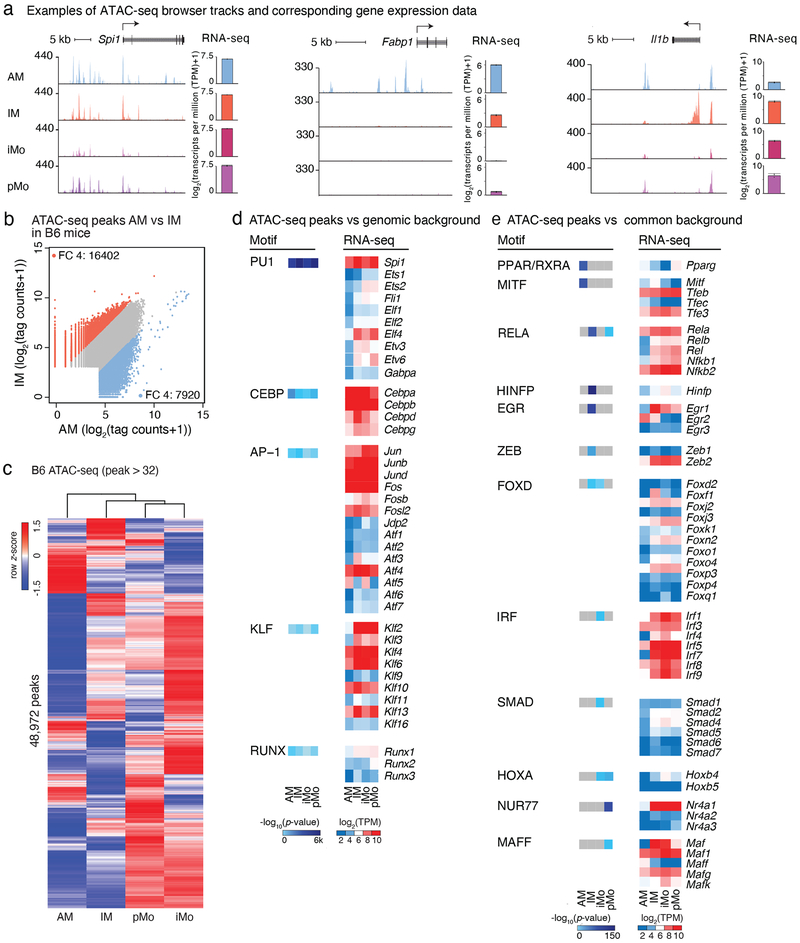
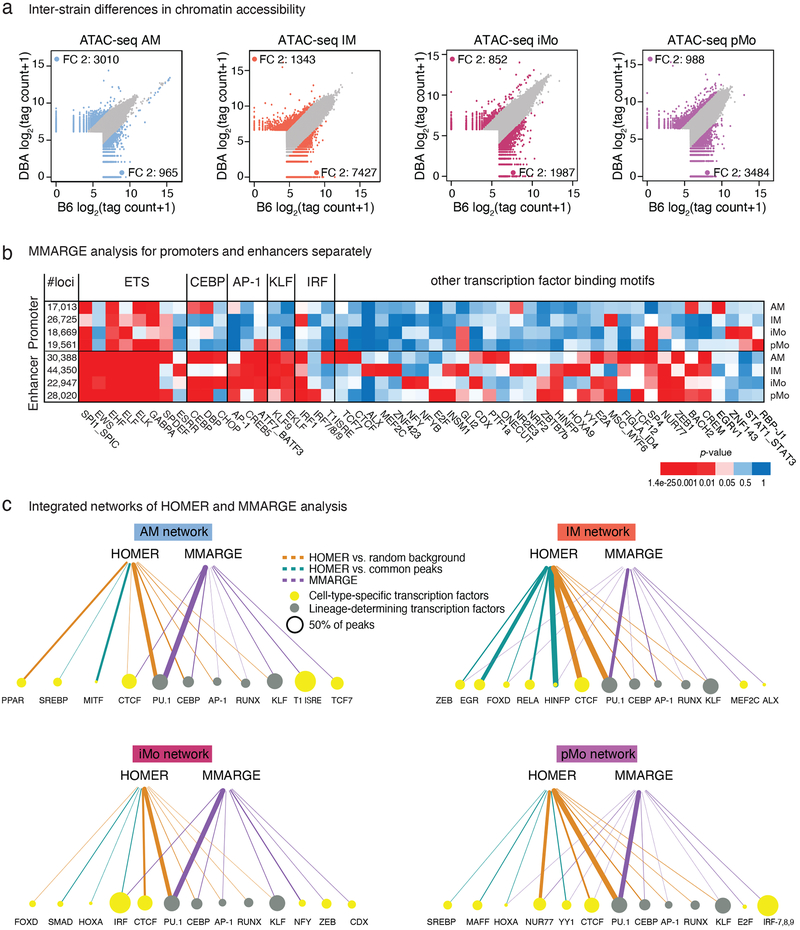
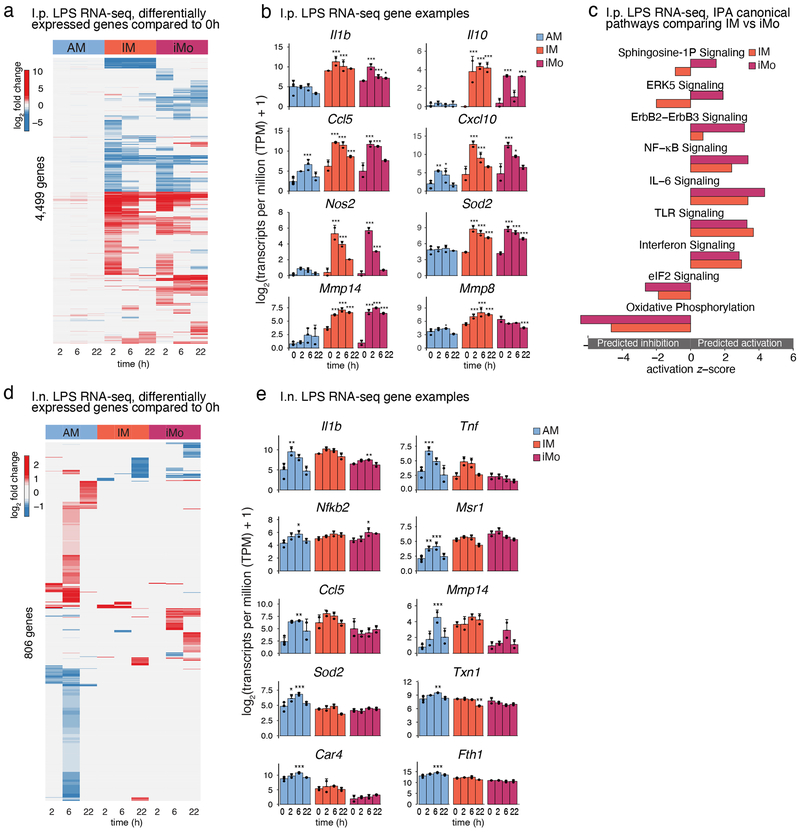
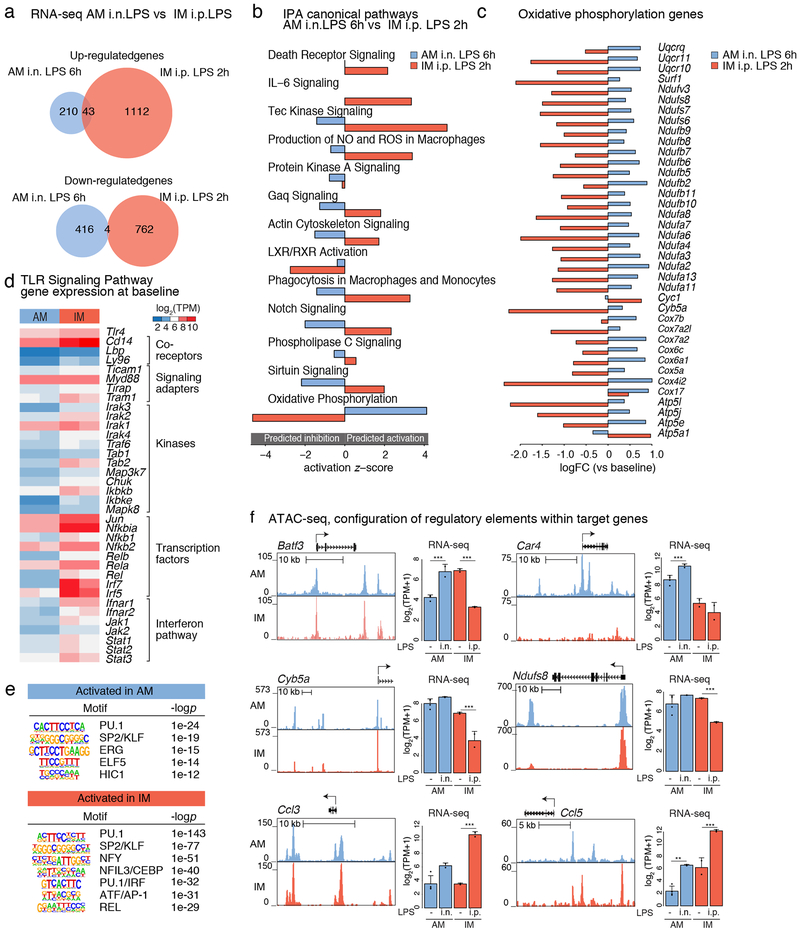
The lung is inhabited by resident alveolar and interstitial macrophages as well as monocytic cells that survey lung tissues. Each cell type plays distinct functional roles under homeostatic and inflammatory conditions, but mechanisms establishing their molecular identities and functional potential remain poorly understood. In the present study, systematic evaluation of transcriptomes and open chromatin of alveolar macrophages (AMs), interstitial macrophages (IMs) and lung monocytes from two mouse strains enabled inference of common and cell-specific transcriptional regulators. We provide evidence that these factors drive selection of regulatory landscapes that specify distinct phenotypes of AMs and IMs and entrain qualitatively different responses to toll-like receptor 4 signaling in vivo. These studies reveal a striking divergence in a fundamental innate immune response pathway in AMs and establish a framework for further understanding macrophage diversity in the lung.


Conflict of interest statement

Declaration of interests

The authors declare no competing interests.

Figures

Extended Data Fig. 1
Extended Data Fig. 1. Single-cell RNA-seq clusters, FACS sorting strategy and quality control of FACS and RNA-seq results
a. Single-cell RNA-seq gene expression in clusters used to determine cluster identities. Heat map is representing expression values for the most significant genes in each cluster. Cells from the lungs of 3 male and 1 female DBA/2J mice were pooled. b. Zoomed-in view of velocity analysis for single-cell RNA-seq from Fig. 1a. c. Flow cytometry analysis and sorting strategy to obtain subsets of lung mononuclear phagocytes (MPs). d. Validation of sorting strategy with gene expression in sorted lung MPs in C57BL/6J (B6) mice (top panel) and DBA/2J (DBA) mice (bottom panel). Bars represent transcripts per million (TPM) for one mouse. Two replicates are shown. e. Spearman correlation heat map of all RNA-seq replicates, N=2 for each cell type in both mouse strains. f. Comparison of gene expression for AM vs. IM and iMo vs. pMo in B6 mice. Scatter plots are showing genes with TPM > 16. Blue dots for AM, orange dots for IM and bordeaux dots for iMo show genes with fold change (FC) 2 or higher. g. Comparison of gene expression in pMo isolated from lung vs pMo isolated from circulating blood. Scatter plots show genes with TPM > 16. Pale blue dots show genes with FC 2 or higher, dark blue dots show genes with FC 4 or higher. h. Ingenuity pathway analysis (IPA) functional pathways for genes differentially regulated in pMo isolated from lung vs pMo isolated from circulating blood.
Extended Data Fig. 2
Extended Data Fig. 2. ATAC-seq quality control and HOMER de novo motif analysis
a. Spearman correlation heat map of all ATAC-seq replicates, N=2 for each cell type in both mouse strains. b. Comparison of open chromatin regions for iMo vs pMo in B6 mice. Scatter plot shows log2 tag counts of ATAC-seq peaks, colored dots show ATAC-seq peaks with fold change (FC) 4 or higher, bordeaux for iMo and purple for pMo. c. HOMER de novo motif enrichment analysis for transcription factor (TF) binding sites in distal regions of open chromatin (> 3 kb from a TSS) likely representing enhancers using GC matched background for B6 mice. Boxes display −log10 p-values for enrichment of the motif, rank order in parenthesis and percentage of motif occurrence in peaks vs background, N=2 for each cell type in both mouse strains. d. HOMER de novo motif enrichment analysis for TF binding sites in distal regions of open chromatin (> 3 kb from a TSS) likely representing enhancers using GC matched background for DBA mice. Boxes display −log10 p-values for enrichment of the motif, rank order in parenthesis and percentage of motif occurrence in peaks vs background, N=2 for each cell type in both mouse strains.
Extended Data Fig. 3
Extended Data Fig. 3. Flow cytometry and ingenuity pathway analysis (IPA) of lung mononuclear phagocytes (MPs) after LPS administration
a. Flow cytometry analysis of lung MP subsets and neutrophils after i.p. LPS administration. Bars represent the average percentage of given cell subset out of CD45+ leukocytes ± SD. Three independent experiments were pooled, 0h N=11, for all other time points N=8. Non-parametric Wilcoxon signed-rank test with Bonferroni correction was used, * p < 0.05, ** p < 0.01, *** p < 0.001. b. Venn diagram of 4,499 differentially expressed genes in AM, IM and iMo after i.p. LPS administration. c. Flow cytometry analysis of lung MP subsets and neutrophils after i.n. LPS administration. Bars represent the average percentage of given cell subset out of CD45+ leukocytes ± SD. Two independent experiments were pooled, 0h N= 11, for all other time points N=4. Non-parametric Wilcoxon signed-rank test with Bonferroni correction was used, * p < 0.05, ** p < 0.01, *** p < 0.001. d. Venn diagram of 806 differentially expressed genes in AM, IM and iMo after i.n. LPS administration.
Figure 1:
Figure 1:. Transcriptomes of lung mononuclear phagocytes (MPs) at baseline
a. Single cell RNA-seq, plot shows dimensionality reduction analysis (t-SNE) incorporated with RNA velocity analysis. Cells from the lungs of 3 male and 1 female DBA/2J mice were pooled. b. Gene expression of lung MP in C57BL/6J (B6) and DBA/2J (DBA) mice. Heat map shows unsupervised hierarchical clustering of genes expressed more than 16 transcripts per million (TPM) in at least one cell type in either B6 or DBA mice. Values are row z-scores. c. Ingenuity pathway analysis (IPA) of genes differentially expressed between lung MP of B6 and DBA mice. Differentially expressed genes calculated using DESeq2 (FC > 2, FDR < 0.01) were merged and submitted to IPA analysis. A selection of highly significant functions and their activation z-scores are shown in the bar graphs (blue for AM, orange for IM, bordeaux for iMo, purple for pMo). The same color scheme is used throughout the article. d. Examples of gene expression from the IPA functions depicted in Fig. 1c. Bar graphs represent mean log2 transcripts per million (TPM+1) ± SD. Differential gene expression was calculated using DESeq2.
Figure 2:
Figure 2:. Strain-specific transcriptomes of lung mononuclear phagocytes (MPs) at baseline
a. Comparison of gene expression in B6 and DBA mice for each lung MP subset. Scatter plots are showing genes with transcripts per million (TPM) > 4. Pale blue dots show genes with fold change (FC) 2 or higher, dark blue dots show genes with FC 4 or higher. N=2 for each cell type in both strains. b. Inter-cellular and inter-strain comparison of highly differentially expressed genes. Heat map shows unsupervised hierarchical clustering of genes with FC 4 or higher between the strains. Values are row z-score. c. Examples of strain specific genes included in the heat map in Fig. 2b. Bar graphs represent mean log2 transcripts per million (TPM+1) ± SD, N=2. Asterisks indicate statistical significance, * p-adj < 0.05, ** p-adj < 0.01, *** p-adj < 0.001 calculated by DESeq2 and multiple-testing corrected with Benjamini-Hochberg.
Figure 3:
Figure 3:. Epigenetic landscapes of lung mononuclear phagocytes (MPs)
a. Examples of ATAC-seq browser tracks for Spi1, Fabp1 and Il1b for the four lung MP subsets. Included are RNA-seq expression data for the same genes. Bar graphs represent mean log2 transcripts per million (TPM+1) ± SD, N=2. b. Comparison of open chromatin regions for AM vs IM in B6 mice. Scatter plots are showing log2 tag counts of ATAC-seq peaks, colored dots show ATAC-seq peaks with a fold change (FC) of 4 or higher (blue dots for AM and orange for IM). c. Heat map of hierarchical clustering of ATAC-seq signal in peaks with more than 32 tag counts in lung MP from B6 mice. Values are row z-scores. d. HOMER de novo motif analysis of distal regions of open chromatin (> 3 kb from a TSS) using GC matched genomic background (left panel). Gene expression of transcription factor family members corresponding to identified motifs (right panel). N=2. e. HOMER de novo motif analysis of cell subset specific distal regions of open chromatin (> 3 kb from a TSS) using all common peaks as background (left panel). Gene expression of transcription factor family members corresponding to identified motifs (right panel). N=2.
Figure 4:
Figure 4:. Effects of natural genetic variation on lung mononuclear phagocyte (MP) open chromatin
a. Inter-strain comparison of ATAC-seq peak tag counts for the four lung MP subsets. Scatter plots are showing log2 tag counts of ATAC-seq peaks, colored dots show ATAC-seq peaks with fold change (FC) 2 or higher (blue for AM, orange for IM, bordeaux for iMo and purple for pMo). b. MMARGE analysis of lung MP. Distribution of chromatin accessibility was calculated for all peaks missing a motif in either B6 or DBA mice. Student’s t-test was used to test for significant differences between these two distributions. Heatmap showing p-values for all significant motifs in enhancers (> 3kb away from TSS) and promoters (< 3kb away from TSS). N=2 for each cell type in both strains. c. Integrated network of HOMER and MMARGE analysis results for each lung MP subset. Node sizes are proportional to the percentage of peaks containing the motif. Lineage-determining transcription factors (TF) are represented with green nodes, other TF with yellow nodes. Edges are proportional to p-values. Edge color represents the analysis method; brown for HOMER with GC matched random background, turquoise for HOMER with common peaks as background, purple for MMARGE.
Figure 5:
Figure 5:. Unique gene expression signatures for lung mononuclear phagocytes (MPs) during the course of acute lung inflammation induced by intraperitoneal (i.p.) and intranasal (i.n.) LPS administration
a. Heat map of differentially expressed genes after i.p. LPS administration. Genes with transcripts per million (TPM) > 8 in at least 2 samples were included. Columns represent the mean fold change of gene expression at different time points after LPS administration compared to the baseline of each cell subset. The heat color represents the log2 fold change for 4,499 genes with a significance of FDR < 0.05 in at least one of the time course comparisons. Red represents up-regulated, blue represents down-regulated genes. b. Examples of genes induced after i.p. LPS administration in AM, IM and iMo. Shown are log2 (TPM+1) ± SD. N=4 for 0h, N=2 for all other time points. Asterisks indicate statistical significance compared to 0h, * p-adj < 0.05, ** p-adj < 0.01, *** p-adj < 0.001 reported by DESeq2 multiple testing corrected with Benjamini-Hochberg method. c. Ingenuity Pathway Analysis (IPA) showing canonical pathways of genes altered by i.p. LPS administration as compared to each cell’s own baseline. Each bar represents the activation z-score for pathways predicted to be activated (positive z-score) or inhibited (negative z-score). d. Heat map of differentially expressed genes after i.n. LPS administration. Genes with TPM > 8 in at least 2 samples were included. Columns represent the mean fold change of gene expression at different time points after LPS administration compared to baseline for each cell subset. The heat color represents the log2 fold change for 806 genes with a significance of FDR < 0.05 in at least one of the time course comparisons. Red represents up-regulated, blue represents down-regulated genes. e. Examples of genes induced after i.n. LPS administration in AM, IM and iMo. Shown are log2 (TPM+1) ± SD. N=4 for 0h, N=2 for all other time points. Asterisks indicates statistical difference compared to 0h, * p-adj < 0.05, ** p-adj < 0.01, *** p-adj < 0.001 calculated by DESeq2 and multiple-testing corrected with Benjamini-Hochberg.
Figure 6:
Figure 6:. Intranasal (i.n.) LPS administration induces a moderate activation of AMs
a. Venn diagram of up-regulated (top panel) and down-regulated (bottom panel) genes after 6h i.n. LPS administration in AM versus 2h i.p. LPS administration in IM. b. Ingenuity Pathway Analysis (IPA) showing canonical pathways of genes altered by 6h i.n. LPS administration in AM (compared to AM baseline) versus 2h i.p. LPS administration in IM (compared to IM baseline). Shown is the z-score for pathways predicted to activated (positive z-score) and inhibited (negative z-score). c. Log fold change (logFC) (versus baseline) for genes from IPA oxidative phosphorylation pathway in AM after i.n. LPS administration at 6h and in IM after i.p. LPS administration at 2h. N=2 for each cell type. d. Gene expression shown in log2 transcripts per million (TPM) for genes of the TLR signaling pathway for AM and IM at baseline. e. HOMER de novo motif analysis results for promoter regions (< 3kb from TSS) of genes activated in AM at 6h after i.n. LPS (top panel) and IM at 2h after i.p. LPS (bottom panel). N=2 for each cell type. f. UCSC genome browser tracks for ATAC-seq signal (left panel) and bar plots for expression signal (right panel) for genes that exhibit divergent responses to LPS in AMs and IMs. N=2. Shown are log2 (TPM+1) ± SD. Asterisks indicates statistical difference compared to 0h, * p-adj < 0.05, ** p-adj < 0.01, *** p-adj < 0.001 calculated by DESeq2 and multiple-testing corrected with Benjamini-Hochberg.

Comment in

  • Diversity at the border.
    Zemans RL, Hagood JS. Zemans RL, et al. Nat Immunol. 2020 Feb;21(2):112-114. doi: 10.1038/s41590-019-0585-9. Nat Immunol. 2020. PMID: 31959978 No abstract available.

References

    1. Pollard JW Trophic macrophages in development and disease. Nat Rev Immunol 9, 259–270 (2009). - PMC - PubMed
    1. Ardini-Poleske ME et al. LungMAP: The Molecular Atlas of Lung Development Program. American journal of physiology. Lung cellular and molecular physiology 313, L733–L740 (2017). - PMC - PubMed
    1. Gomez Perdiguero E et al. Tissue-resident macrophages originate from yolk-sac-derived erythro-myeloid progenitors. Nature 518, 547–551 (2015). - PMC - PubMed
    1. Hoeffel G et al. C-Myb(+) erythro-myeloid progenitor-derived fetal monocytes give rise to adult tissue-resident macrophages. Immunity 42, 665–678 (2015). - PMC - PubMed
    1. Guilliams M et al. Alveolar macrophages develop from fetal monocytes that differentiate into long-lived cells in the first week of life via GM-CSF. The Journal of experimental medicine 210, 1977–1992 (2013). - PMC - PubMed

References (Methods only)

    1. Picelli S et al. Smart-seq2 for sensitive full-length transcriptome profiling in single cells. Nat Methods 10, 1096–1098 (2013). - PubMed
    1. Butler A, Hoffman P, Smibert P, Papalexi E & Satija R Integrating single-cell transcriptomic data across different conditions, technologies, and species. Nat Biotechnol 36, 411–420 (2018). - PMC - PubMed
    1. Dobin A et al. STAR: ultrafast universal RNA-seq aligner. Bioinformatics 29, 15–21 (2013). - PMC - PubMed
    1. Love MI, Huber W & Anders S Moderated estimation of fold change and dispersion for RNA-seq data with DESeq2. Genome Biol 15, 550 (2014). - PMC - PubMed
    1. Langmead B & Salzberg SL Fast gapped-read alignment with Bowtie 2. Nat Methods 9, 357–359 (2012). - PMC - PubMed

Publication types