Observational Study
. 2020 Feb;26(2):215-221.
doi: 10.1038/s41591-019-0714-x. Epub 2020 Jan 20.

Fecal dysbiosis in infants with cystic fibrosis is associated with early linear growth failure

Affiliations
Observational Study

Fecal dysbiosis in infants with cystic fibrosis is associated with early linear growth failure

Hillary S Hayden et al. Nat Med. 2020 Feb.

Abstract

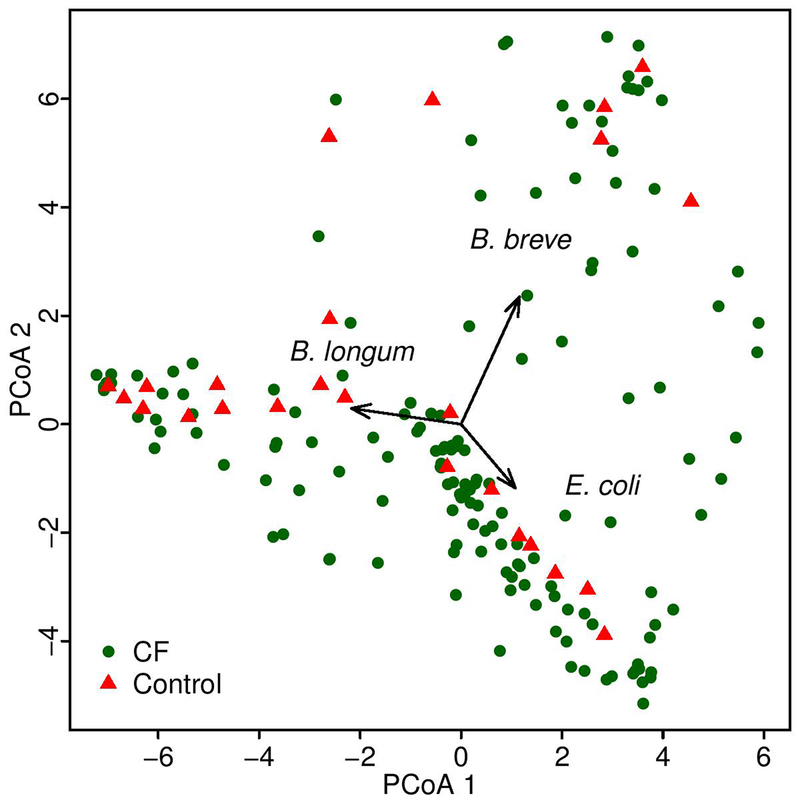
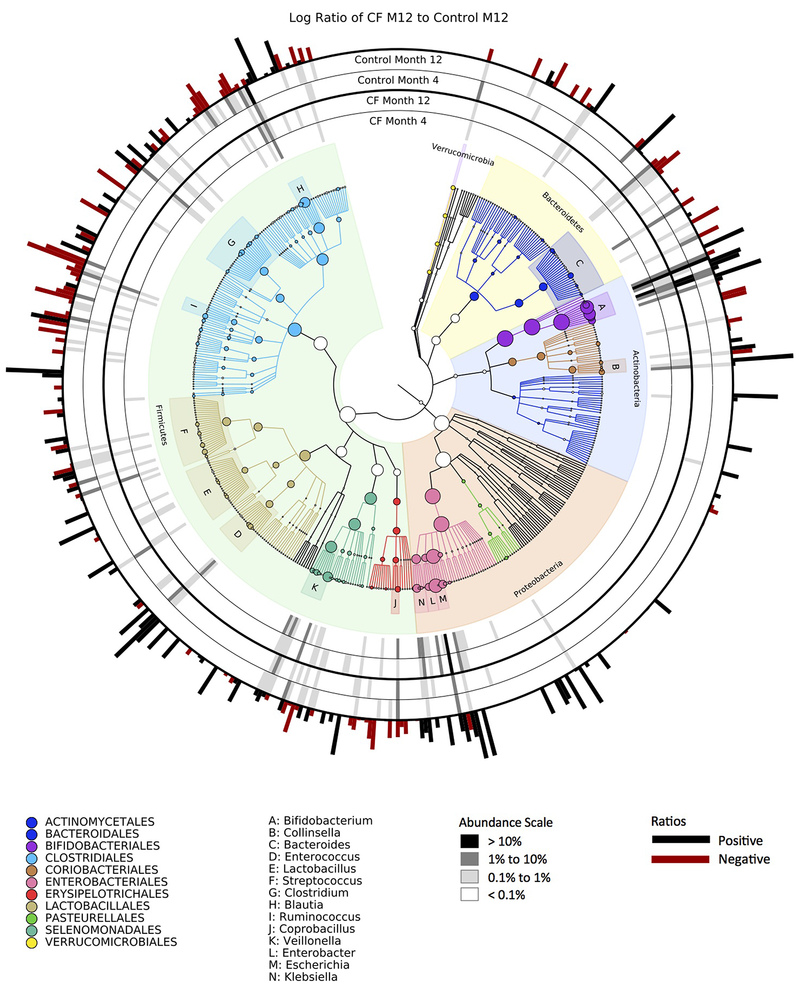
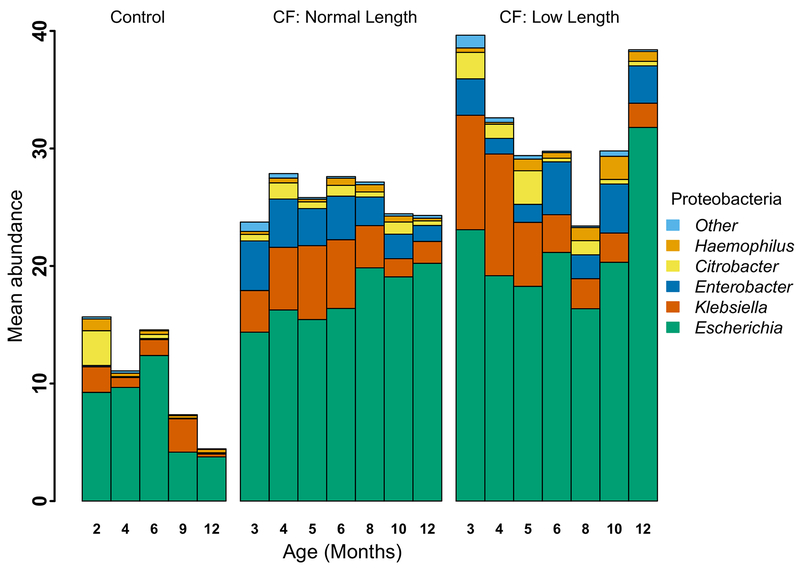
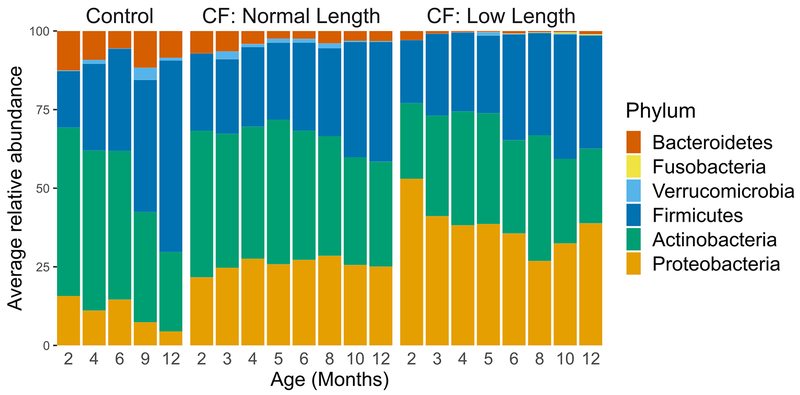
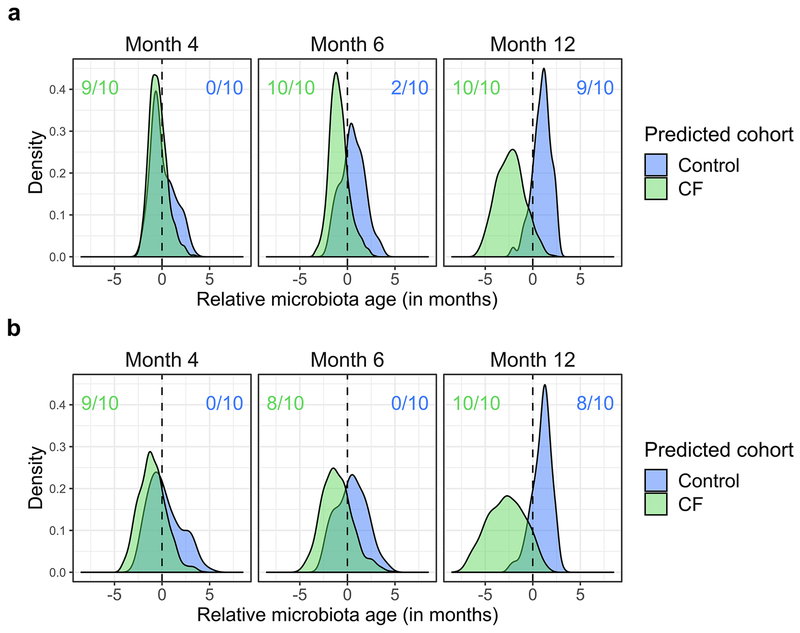
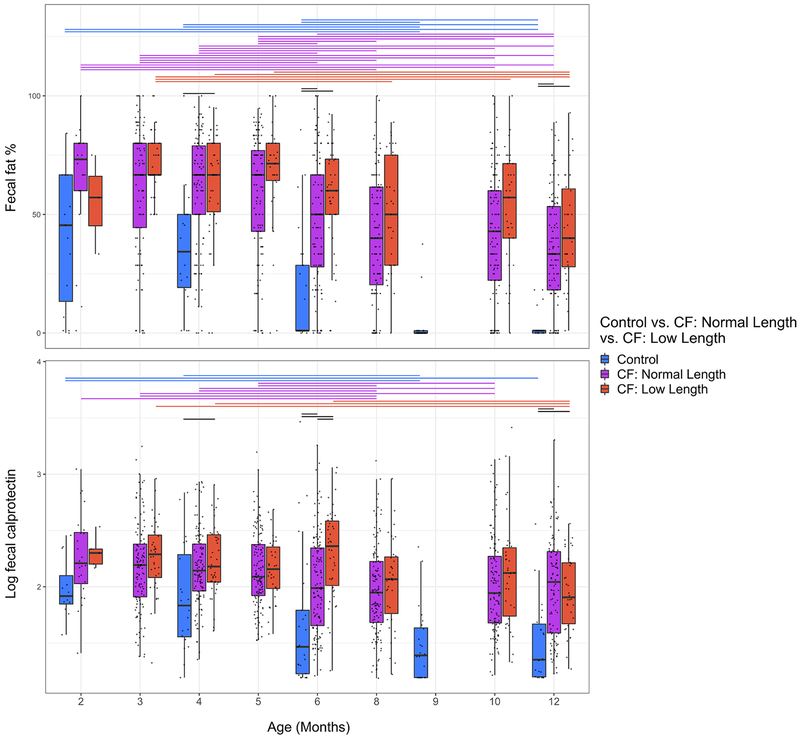
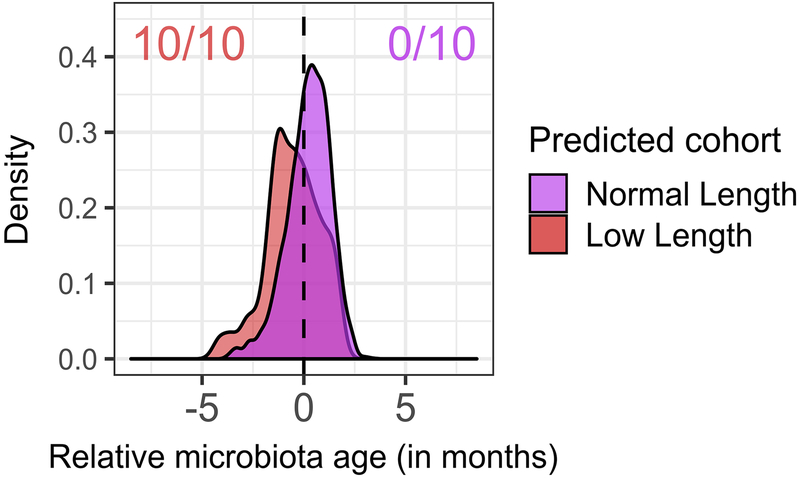
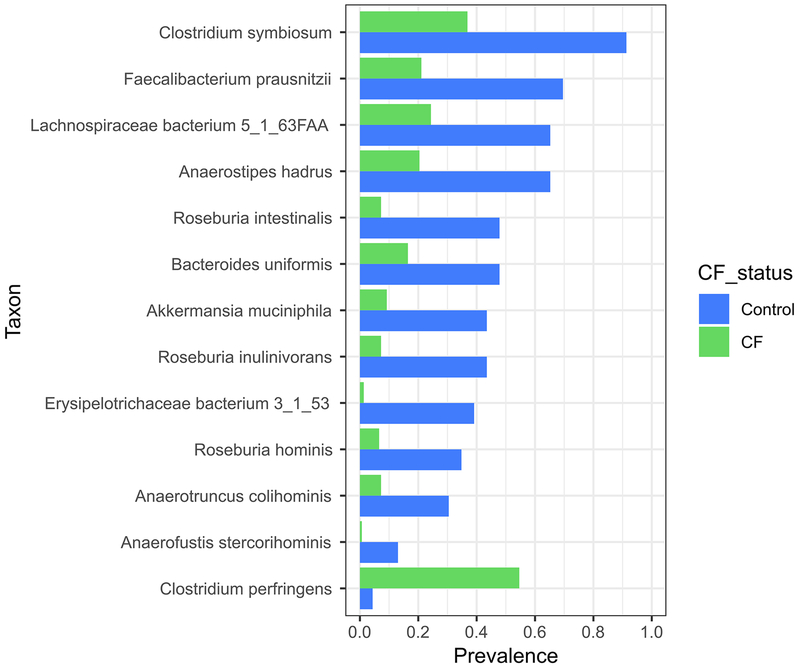
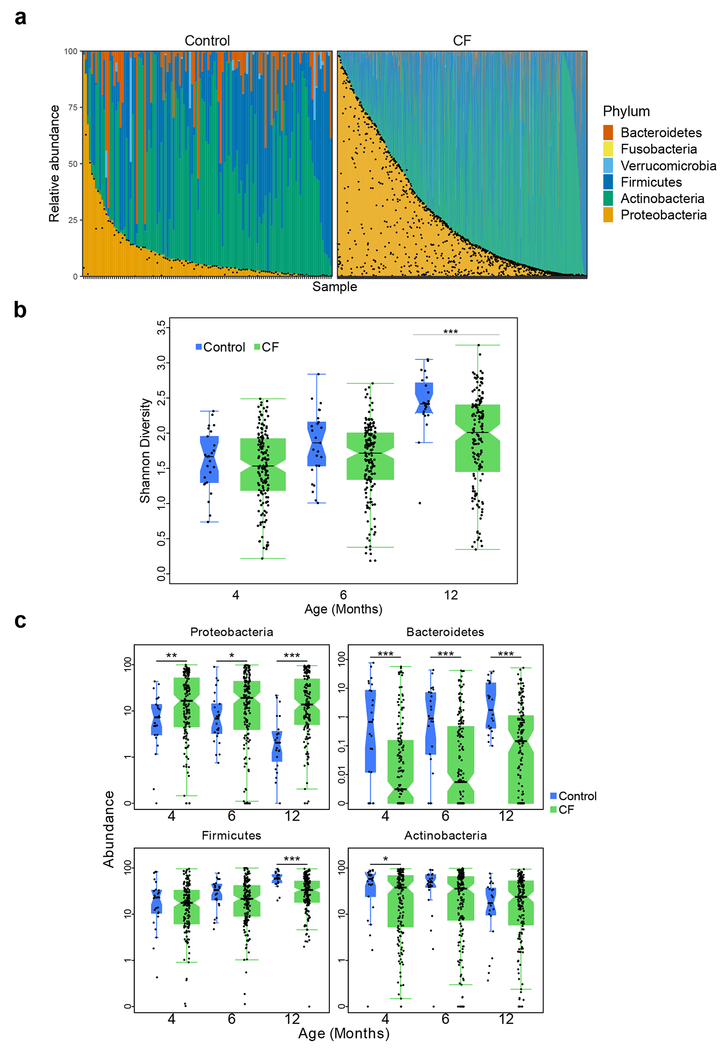
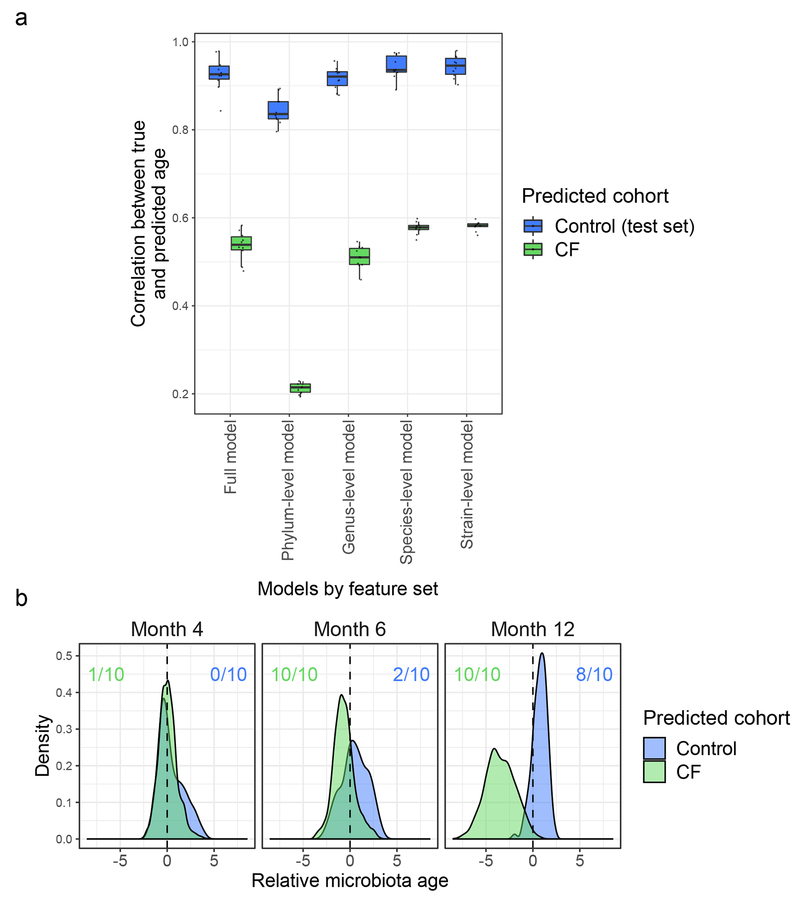
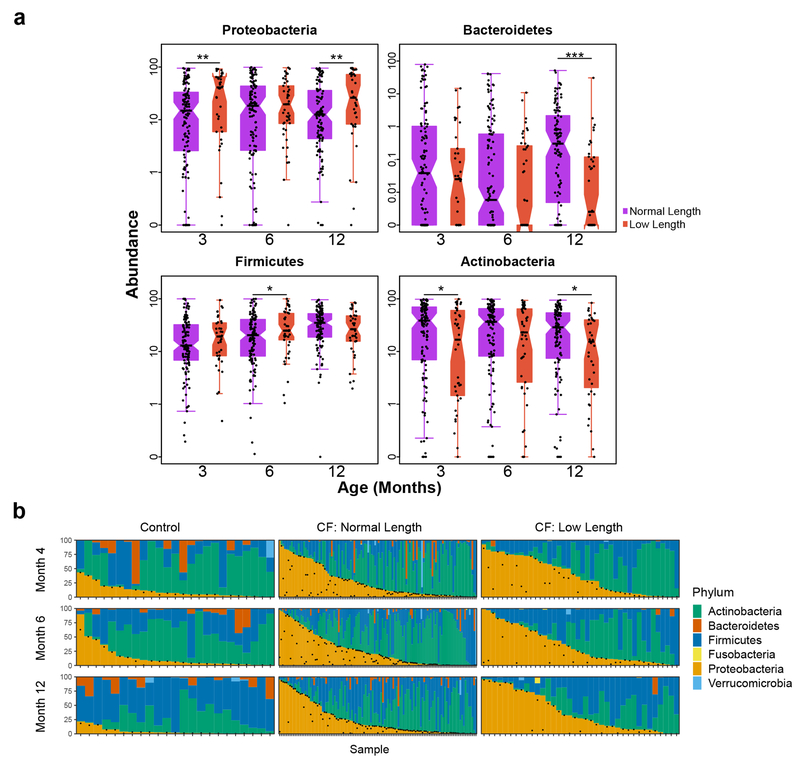
Most infants with cystic fibrosis (CF) have pancreatic exocrine insufficiency that results in nutrient malabsorption and requires oral pancreatic enzyme replacement. Newborn screening for CF has enabled earlier diagnosis, nutritional intervention and enzyme replacement for these infants, allowing most infants with CF to achieve their weight goals by 12 months of age1. Nevertheless, most infants with CF continue to have poor linear growth during their first year of life1. Although this early linear growth failure is associated with worse long-term respiratory function and survival2,3, the determinants of body length in infants with CF have not been defined. Several characteristics of the CF gastrointestinal (GI) tract, including inflammation, maldigestion and malabsorption, may promote intestinal dysbiosis4,5. As GI microbiome activities are known to affect endocrine functions6,7, the intestinal microbiome of infants with CF may also impact growth. We identified an early, progressive fecal dysbiosis that distinguished infants with CF and low length from infants with CF and normal length. This dysbiosis included altered abundances of taxa that perform functions that are important for GI health, nutrient harvest and growth hormone signaling, including decreased abundance of Bacteroidetes and increased abundance of Proteobacteria. Thus, the GI microbiota represent a potential therapeutic target for the correction of low linear growth in infants with CF.


Conflict of interest statement

Competing interests

The authors declare no competing interests.

Figures

Extended Data Fig. 1
Extended Data Fig. 1. Principal coordinates analysis of the fecal microbiota of infants with CF and controls at month 4.
The structure of the fecal microbiomes of infants in this study at month 4 seen in a multidimensional scaling plot is dominated by the large abundances of Bifidobacterium longum, B. breve and E. coli. One samples is represented for each of 109 infants with CF and 25 controls. Each colored dot represents the microbiota of a different study sample, as indicated.
Extended Data Fig. 2
Extended Data Fig. 2. Phylogenetic plot comparing average microbiota at multiple taxonomic levels at months 4 and 12 for infants with CF and controls.
As indicated in the legend at lower right, greyscale bars indicate relative abundance; red vs. black bars on the outside of the circular graph indicate whether taxa were enriched in infants with CF (black) or controls (red) samples at month 12.
Extended Data Fig. 3
Extended Data Fig. 3. Mean percent relative abundance of genera in Phylum Proteobacteria in fecal samples from infants with CF with normal length, infants with CF with low length and controls
Proteobacteria remained relatively high in infants with CF, and especially those with low length, due primarily to replacement with E. coli. In addition, abundances of Klebsiella and Enterobacter remained relatively high. Bar height represents mean percent relative abundance of Proteobacteria at each timepoint, and the mean relative abundance contribution for selected genera are indicated within each bar.
Extended Data Fig. 4
Extended Data Fig. 4. Average percent relative abundance of different bacterial phyla in fecal samples from infants with CF with normal length, infants with CF with low length and controls.
Phylum-level average microbiota at each collection time point of the control infants (left), compared to normal length infants with CF (middle), and low length infants with CF (right).
Extended Data Fig. 5
Extended Data Fig. 5. Fecal microbiota development is significantly delayed in infants with CF relative to controls when omitting infants prescribed any acid suppressors and when models are trained on a sparse set of taxonomic features.
a, infants prescribed any acid suppressors, including proton pump inhibitors and/or H2 blockers were omitted. b, models trained on a sparse set of taxonomic features. Shown are the distributions of “relative microbiota age” (x-axis), following the approach in Subramanian et al. for each subject group (CF or controls) using abundances at all taxonomic levels as the normalized error in a sample’s predicted microbiota age when using a computational model constructed for the other group (e.g., negative relative microbiota age indicates delayed development compared to the group used to construct the model). Y-axis, density of samples that mapped to a given relative microbiota age at the indicated timepoints. Colored ratios summarize the fraction of replicate full-feature models that produced a distribution of relative microbiota ages that was significantly negatively (green for CF samples relative to control models) or positively (blue for control samples relative to CF models) different from zero (q < 0.01, one-sided Wilcoxon signed-rank test).
Extended Data Fig. 6
Extended Data Fig. 6. Levels of fecal fat percentage and fecal calprotectin during the first year of life.
Lines above the boxes represent significant differences (q <= 0.01, two-sided Wilcoxon rank-sum test) between time points within a cohort (colored lines) or between cohorts at the same time point (black lines). Boxplot hinges indicate the first and third quartile, and whiskers indicate 1.5 times the IQR above and below.
Extended Data Fig. 7
Extended Data Fig. 7. Fecal microbiota development is significantly delayed in infants with CF with low length relative to infants with CF with normal length at month 12.
Shown are the distributions of “relative microbiota age” (x-axis), following the approach in Subramanian et al.21 for each subject group (CF low length or CF normal length) as described in Figure 2. Colored ratios summarize the fraction of replicate full-feature models that produced a distribution of relative microbiota ages that was significantly negatively (red for CF low length samples relative to CF normal length models) or positively (purple for CF normal length samples relative to CF low length models) different from zero (q < 0.01, one-sided Wilcoxon signed-rank test).
Extended Data Fig. 8
Extended Data Fig. 8. Prevalence of selected butyrate-producing species with significantly different prevalence between infants with CF compared to controls at month 12.
N = 23 controls, 152 CF, q < 0.05, chi-squared test.
Figure 1.
Figure 1.. Fecal microbial composition is altered in infants with CF compared to controls.
a, The microbiota of all samples at the phylum level among control infants (left) and infants with CF (right). Samples are ordered within each cohort according to the relative abundance of Proteobacteria (and then Actinobacteria for samples where relative abundance of Proteobacteria was negligible). Black dots indicate the relative abundance of E. coli in each sample. b, Boxplot of Shannon Index, with individual data, indicating slower increases in fecal microbiota diversity for infants with CF compared to controls, with significant differences at month 12. Number of samples (N), one per patient at months 4, 6 and 12: 156, 169 and 152 for infants with CF and 25, 25, and 23 for controls. c, Boxplots of Proteobacteria, Bacteroidetes, Firmicutes and Actinobacteria relative abundances at months 4, 6 and 12 for infants with CF and controls. Boxplot hinges indicate the first and third quartile, and whiskers indicate 1.5 times the IQR above and below. Indentations in each box indicate approximately the 95% confidence intervals about the median. Box width is proportional to the square root of N. One-sided Wilcoxon rank-sum test, * p < 0.05, ** p < 0.01, ***p < 0.001.
Figure 2.
Figure 2.. Development of the fecal microbiome in infants with CF is delayed compared to controls.
a, Performance of microbiota age models. Each box summarizes the Pearson correlations (y-axis) between true and predicted microbiota age across replicate models trained on subsets of control samples. The control correlations were calculated from subsets of withheld testing samples and the CF correlations were calculated using these control-trained models on all CF samples. Models differ by the feature set used for prediction as indicated on the x-axis: all MetaPhlAn taxonomic features, phylum-level features, genus-level features, species-level features, or strain-level features (n = 10 replicate models for each feature set). Boxplot hinges indicate the first and third quartile, and whiskers indicate 1.5 times the IQR above and below. b, Development of fecal microbiota among infants with CF is significantly delayed relative to controls. Shown are the distributions of “relative microbiota age” (x-axis), following the approach in Subramanian et al. for each subject group (CF or controls) as the normalized error in a sample’s predicted microbiota age when using a computational model constructed for the other group (e.g., negative relative microbiota age indicates delayed development compared to the group used to construct the model). Y-axis, density of samples that mapped to a given relative microbiota age at the indicated timepoints. Colored ratios summarize the fraction of replicate full-feature models that produced a distribution of relative microbiota ages that was significantly negatively (green for CF samples relative to control models) or positively (blue for control samples relative to CF models) different from zero (q < 0.01, one-sided Wilcoxon signed-rank test).
Figure 3.
Figure 3.. Low length infants with CF have more extreme dysbiosis than normal length infants with CF.
a, Boxplots of Proteobacteria, Bacteroidetes, Firmicutes and Actinobacteria relative fecal abundances at 3, 6 and 12 months for normal length compared to low length infants with CF. The number of samples (N) at month 3, 6 and 12 is 120, 124 and 113 for normal length and 38, 45, and 39 for low length infants. Hinges indicate the first and third quartile, and whiskers 1.5 times the IQR above and below. Indentations in each box indicate approximately the 95% confidence intervals about the median. Box width is proportional to the square root of N. One-sided Wilcoxon rank-sum test, * p < 0.05, ** p < 0.01, ***p < 0.001. b, Dynamics of the fecal microbiota of controls (left) and normal length (middle) and low length (right) infants with CF during the first year of life. Bars represent the relative abundances of bacterial phyla. Samples are ordered within each panel according to the relative abundance of Proteobacteria (and then Actinobacteria once the relative abundance of Proteobacteria is negligible). Vertically-aligned samples are not guaranteed to be from the same subject. Black dots indicate the relative abundance of E. coli in each sample.

References

    1. Leung DH et al. Effects of Diagnosis by Newborn Screening for Cystic Fibrosis on Weight and Length in the First Year of Life. JAMA Pediatr 171, 546–554, doi:10.1001/jamapediatrics.2017.0206 (2017). - DOI - PMC - PubMed
    1. Konstan MW et al. Growth and nutritional indexes in early life predict pulmonary function in cystic fibrosis. J Pediatr 142, 624–630, doi:10.1067/mpd.2003.152 (2003). - DOI - PubMed
    1. Yen EH, Quinton H & Borowitz D Better nutritional status in early childhood is associated with improved clinical outcomes and survival in patients with cystic fibrosis. J Pediatr 162, 530–535 e531, doi:10.1016/j.jpeds.2012.08.040 (2013). - DOI - PubMed
    1. Hoffman LR et al. Escherichia coli dysbiosis correlates with gastrointestinal dysfunction in children with cystic fibrosis. Clin Infect Dis 58, 396–399, doi:10.1093/cid/cit715 (2014). - DOI - PMC - PubMed
    1. Manor O et al. Metagenomic evidence for taxonomic dysbiosis and functional imbalance in the gastrointestinal tracts of children with cystic fibrosis. Sci Rep 6, 22493, doi:10.1038/srep22493 (2016). - DOI - PMC - PubMed

Methods-only References

    1. Bassis CM et al. Comparison of stool versus rectal swab samples and storage conditions on bacterial community profiles. BMC Microbiol 17, 78, doi:10.1186/s12866-017-0983-9 (2017). - DOI - PMC - PubMed
    1. Tedjo DI et al. The effect of sampling and storage on the fecal microbiota composition in healthy and diseased subjects. PLoS One 10, e0126685, doi:10.1371/journal.pone.0126685 (2015). - DOI - PMC - PubMed
    1. Choo JM, Leong LE & Rogers GB Sample storage conditions significantly influence faecal microbiome profiles. Sci Rep 5, 16350, doi:10.1038/srep16350 (2015). - DOI - PMC - PubMed
    1. Yu Z & Morrison M Improved extraction of PCR-quality community DNA from digesta and fecal samples. Biotechniques 36, 808–812, doi:10.2144/04365ST04 (2004). - DOI - PubMed
    1. Morgan XC et al. Dysfunction of the intestinal microbiome in inflammatory bowel disease and treatment. Genome Biol 13, R79, doi:10.1186/gb-2012-13-9-r79 (2012). - DOI - PMC - PubMed

Publication types