Case Reports
. 2020 Feb;26(2):236-243.
doi: 10.1038/s41591-019-0733-7. Epub 2020 Jan 20.

Targeted therapy guided by single-cell transcriptomic analysis in drug-induced hypersensitivity syndrome: a case report

Affiliations
Case Reports

Targeted therapy guided by single-cell transcriptomic analysis in drug-induced hypersensitivity syndrome: a case report

Doyoung Kim et al. Nat Med. 2020 Feb.

Abstract

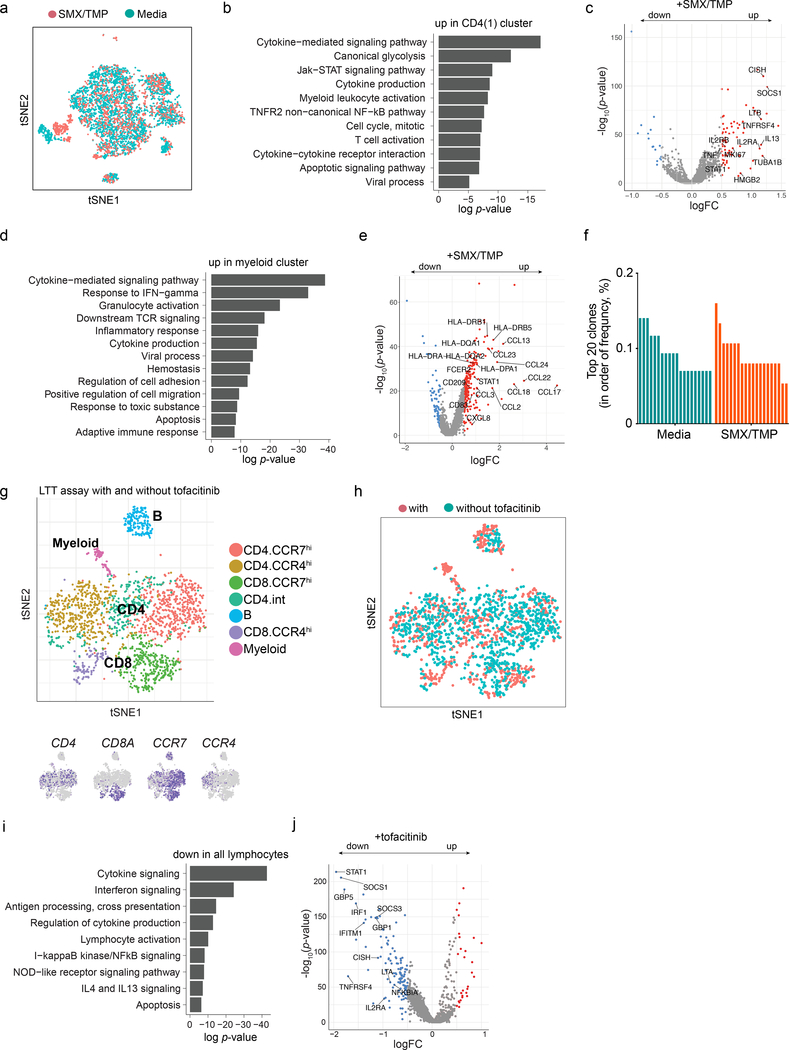
Drug-induced hypersensitivity syndrome/drug reaction with eosinophilia and systemic symptoms (DiHS/DRESS) is a potentially fatal multiorgan inflammatory disease associated with herpesvirus reactivation and subsequent onset of autoimmune diseases1-4. Pathophysiology remains elusive and therapeutic options are limited. Cases refractory to corticosteroid therapy pose a clinical challenge1,5 and approximately 30% of patients with DiHS/DRESS develop complications, including infections and inflammatory and autoimmune diseases1,2,5. Progress in single-cell RNA sequencing (scRNA-seq) provides an opportunity to dissect human disease pathophysiology at unprecedented resolutions6, particularly in diseases lacking animal models, such as DiHS/DRESS. We performed scRNA-seq on skin and blood from a patient with refractory DiHS/DRESS, identifying the JAK-STAT signaling pathway as a potential target. We further showed that central memory CD4+ T cells were enriched with DNA from human herpesvirus 6b. Intervention via tofacitinib enabled disease control and tapering of other immunosuppressive agents. Tofacitinib, as well as antiviral agents, suppressed culprit-induced T cell proliferation in vitro, further supporting the roles of the JAK-STAT pathway and herpesviruses in mediating the adverse drug reaction. Thus, scRNA-seq analyses guided successful therapeutic intervention in the patient with refractory DiHS/DRESS. scRNA-seq may improve our understanding of complicated human disease pathophysiology and provide an alternative approach in personalized medicine.


Conflict of interest statement

Competing interests

All authors declare no competing interests.

Figures

Extended Data Fig. 1.
Extended Data Fig. 1.. Infiltration of T cells in DiHS/DRESS skin.
a, scRNAseq tSNE analysis of DiHS/DRESS and HV skin cells, colour-coded based on origin (n=18,218 cells). b, Heatmap of the top-five genes marking clusters of skin cells (x-axis; from Figure 1b). Keratinocyte (KC); smooth muscle (SM). c, Frequencies of cells in each cluster, color-coded based on origin. d, Nineteen clusters in Fig. 1b were grouped into 7 major subsets based on cell types (DiHS/DRESS cells, n=4,676; HVs cells, n=13,542). Numbers of differentially expressed genes (nDEGs) between DiHS/DRESS- and HV cells within each cell type projected onto a tSNE map. DEG: |log fold change| > 0.5, adjusted p-value < 0.05, Wilcoxon rank sum test. e, Immunohistochemical staining for CD3, CD4, and CD8 in DiHS/DRESS lesional skin. Scale bars, 100 μm. Representatives of six serial sections from one sample. f, tSNE plot for the lymphocyte subcluster, colour-coded based on origin (DiHS/DRESS cells, n=589; HV cells, n=1,148). g, tSNE projections of selected genes (n=1,737 cells). h, Frequency of cells from (f) expressing the displayed genes. i, Immunofluorescence staining with anti-CD3 (green) and anti-CCR10 (red) antibodies or rabbit IgG isotype in DiHS/DRESS lesional skin. Dotted lines denote the boundary between the epidermis (Ep) and dermis. Scale bar, 50 μm. j, Immunofluorescence staining with anti-CD3 (green) and anti-JAK3 (red) in DiHS/DRESS lesional skin. Staining in atopic dermatitis and HV skin sections are shown as comparison. Nuclear labeling with DAPI (blue). Scale bar, 50 μm. k, Hematoxylin and eosin staining (top; H&E) and immunohistochemical staining for phosphorylated STAT1 (pSTAT1) in DiHS/DRESS and HV skin. Scale bar, 20 μm. i-k, Representative of 3 independent experiments.
Extended Data Fig. 2.
Extended Data Fig. 2.. Characterization of DiHS/DRESS T cells in blood.
a, scRNAseq tSNE analysis of DiHS/DRESS and HV PBMCs, colour-coded based on origin (n=14,932 cells). b, Frequencies of cells in each cluster, colour-coded based on origin. c, Heatmap of the top-five genes marking PBMC clusters (from Figure 2a). d, Violin plots show the distribution of the normalized expression levels of selected genes in each lymphocyte cluster (CD4(1), n=2,322 cells; CD4(2), n=1,649 cells; CD4(3), n=1,318 cells; CD8(1), n=2,350 cells; CD8(2), n=850 cells; CD8(3), n=335 cells; mitotic, n=525 cells; Treg, n=245 cells). e, Frequencies of top-20 common T cell receptor (TCR) clonotypes in PBMCs from HV and in PBMCs and skin from DiHS/DRESS patient as determined by single-cell TCR V(D)J gene sequencing. f, Frequent clonotypes, defined as cells expressing common TCR combinations that were shared by more than 10 cells (DiHS/DRESS, n=2 clonotypes in 22 cells; HV, n=21 clonotypes in 1,466 cells), were mapped onto the tSNE plot. g. Trajectory analysis of cells in the CD4 T cell clusters (n=6,059 cells), coloured by pseudotime (top) and clusters (bottom). h, Pseudo-temporal single cell expression of indicated genes, colored by cluster. i, Pathways upregulated in DiHS/DRESS lymphoid clusters with high transcriptomic changes (CD4(3), CD8(1), and mitotic clusters, n=4,193 cells). P-value, hypergeometric test.
Extended Data Fig. 3.
Extended Data Fig. 3.. Reduction of circulating CD8+ effector memory T cells after tofacitinib
Flow cytometry analysis for chemokine receptor expression and memory phenotype in DiHS/DRESS peripheral blood CD3+ CD8+ T cells pre- and 2 weeks post-treatment with tofacitinib. Right panels: Naïve, central memory (CM), and effector memory (EM) CD8+ T cells. Representatives of 2 technical replicates.
Extended Data Fig. 4.
Extended Data Fig. 4.. Pathway analysis of transcriptomic changes induced in CD4+ T cells and myeloid cells during LTT.
a, scRNAseq tSNE analysis of PBMCs after a 4-day culture with or without SMX/TMP, colour-coded based on origin (n=5,881 cells). b, Pathways upregulated in CD4(1) cluster (from Fig. 4b–d, n= 1,486) after SMX/TMP treatment. c, Volcano plot of up- (red) and down-regulated (blue) genes differentially expressed in SMX/TMP treated CD4(1) cells (|log fold change| > 0.5), highlighting relevant genes associated with pathways from (b). With SMX-TMP, n=418 CD4(1) cells; without SMX-TMP, n=1,068 CD4(1) cells. Full list of differentially expressed genes from the three CD4 T cell clusters (n=3,869 cells) observed in LTT (see Fig. 4b–c) is provided in Supplementary Table 2. d, Pathways upregulated in myeloid cells after SMX/TMP treatment. e. Volcano plot of differentially expressed genes in myeloid cells (n=513) by SMX/TMP treatment, labeling relevant genes in pathways from (d). f, Frequencies of top-20 common T cell receptor (TCR) clonotypes in PBMCs after a 4-day culture with or without SMX/TMP as determined by single-cell TCR V(D)J gene sequencing. g,h, scRNAseq tSNE analysis on SMX/TMP-treated PBMCs with or without tofacitinib (n=2,068 cells) colour-coded based on cluster (g, top) and origin (h). tSNE projections of selected marker genes (g, bottom). i, Pathways downregulated in CD4 lymphocytes of tofacitinib-treated PBMC, and j, Volcano plot with labeling of relevant downregulated genes. Tofacitinib-treated CD4 cells, n=825; untreated CD4 cells, n=508. P-values in b,d,I, hypergeometric test; p-values in c,e,j, Wilcoxon rank sum test.
Figure 1.
Figure 1.. Single cell RNA sequencing analysis reveals unique skin T cell transcriptome in DiHS/DRESS.
a, Clinical presentation and course. Prednisone (PSL); intravenous immunoglobulin (IVIG); cyclosporin (CsA); mycophenolate mofetil (MMF). b, Unsupervised t-distributed stochastic neighbor (tSNE) plot displaying 4,676 cells from DiHS/DRESS skin and 13,542 skin cells from 5 healthy volunteers (HVs), coloured by shared nearest neighbor (SNN) clusters. Keratinocyte (KC); smooth muscle (SM). c, Expression levels of (x axis) cluster-defining genes in each cluster. Violin plots show the distribution of the normalized expression levels of genes and are color-coded based on cluster, as in (b). d, Numbers of differentially expressed genes (nDEGs) between DiHS/DRESS- and HV cells within each cluster projected onto the tSNE map. DEG: |log fold change| > 0.5, adjusted p-value < 0.05, Wilcoxon rank sum test. e, Pathways upregulated in DiHS/DRESS lymphoid cells (cluster 4) with representative genes in each pathway. P-value, hypergeometric test. f, A volcano plot of DEGs that are upregulated (red) or downregulated (blue) in lymphoid cells; relevant DEGs identified in the pathways are labeled (Full list in Supplementary Table 1). DiHS/DRESS cells, n=589; HV cells, n=1,148. P-value, Wilcoxon rank sum test. g, Lymphocytes (cluster 4; n=1,737 cells) were aligned across datasets using canonical correlation analysis, and projected onto a tSNE plot, color-coded based on origin (left). Expression of selected genes are projected onto the tSNE plot (top) and shown as violin plots (bottom). Violin plots show the distribution of the normalized expression levels of selected genes and dots represent individual cells.
Figure 2.
Figure 2.. Circulating DiHS/DRESS T cells with distinct transcriptomic profiles and enrichment of human herpesvirus 6b DNA in CD4+ central memory T cells.
a, scRNAseq analysis on PBMCs from DiHS/DRESS (6,956 cells) and an age- and sex-matched HV (7,976 cells). Individual cells are color-coded based on cluster (n=19) in a tSNE plot. tSNE projections of well-known marker genes (bottom). b, Numbers of differentially expressed genes (nDEGs) between DiHS/DRESS and HV clusters. DEG: |log fold change| > 0.5, adjusted p-value < 0.05, Wilcoxon rank sum test. c, tSNE projections of selected genes, segregated by origin. Dotted region highlights clusters with high nDEGs (CD4(3), CD8(1), and mitotic cluster). d, e, Flow cytometry analysis of PBMCs for chemokine receptor expression and memory phenotype (a representative of two independent experiments). f, Violin plots show the distributions of JAK3, STAT1, and IL2RG expression levels in clusters with high transcriptomic changes (CD4(3), CD8(1), and mitotic cluster, DiHS/DRESS, n=925 cells; HV, n=2,960 cells). Numbers indicate percentages of cells that express each gene. g, Quantitative RT-PCR of human herpesviruses (HHV) in PBMC. h, Quantitative PCR for HHV6b DNA using sorted PBMC subsets. g,h, n=1. a representative of two independent sampling point.
Figure 3.
Figure 3.. Clinical improvement with JAK inhibition with reversal of DiHS/DRESS-related transcriptome.
a, Clinical course after intervention with tofacitinib and valganciclovir (VGCV) (left). Prednisone (PSL); cyclosporin (CsA); mycophenolate mofetil (MMF). Clinical presentation at 4 months after starting tofacitinib (right). b, Flow cytometry analysis for chemokine receptors and memory phenotypes in blood CD4+ T cells before and 2 weeks after intervention (representatives of 2 technical replicates). c, scRNAseq analysis on DiHS/DRESS PBMCs that were sampled before and 2 weeks after intervention. Unsupervised tSNE plot generated from merged dataset of the two time-points (n=12,516 cells). Violin plots show the distribution of the normalized expression levels of selected DiHS/DRESS-associated genes in lymphocyte and mitotic cell clusters (bottom). d, tSNE plots segregated by cellular origin (top, pre-treatment, n=7,222 cells; post-treatment, n=5,294 cells). Dotted regions highlight T cell clusters diminished after intervention. Pie charts showing relative cluster abundances pre- and post-intervention (bottom). e, Volcano plot for differentially expressed genes that were up- (red) or down-regulated (blue) by tofacitinib treatment in lymphocytes (pre-treatment, n=4,967 cells; post-treatment, n=4,320 cells; p-value, Wilcoxon rank sum test). f, Long-term follow-up of HHV6b DNA copy numbers in blood pre- and post-tofacitinib.
Figure 4.
Figure 4.. SMX/TMP-induced in vitro T cell proliferation is suppressed by tofacitinib and anti-viral agents.
a, Detection of CD4+ T cell proliferation via lymphocyte transformation test. Carboxyfluorescein succinimidyl ester (CFSE)-labeled DiHS/DRESS PBMC were cultured with indicated concentrations of SMX/TMP for 6 days. Flow cytometry (left), quantification of CD4+ cells that have proliferated (center, the percentage of CFSE-diluted cells among Zombie-aqua CD3+CD4+ cells, n=3, 3 independent experiments) and morphology of cell aggregates induced by SMX/TMP (right). b, scRNAseq tSNE analysis of PBMCs after a 4-day culture with (n=1,628 cells) or without (n=4,253 cells) SMX/TMP. c, Numbers of differentially expressed genes (nDEG) projected onto the tSNE plot (left, with SMX-TMP, n=1,628 cells; without SMX-TMP, n=4,253 cells). DEG: |log fold change| > 0.25, adjusted p-value < 0.05, Wilcoxon rank sum test. Violin plots show the distribution of the normalized expression levels of selected chemokine receptors in CD4 T cell clusters (right). d. Expression of the cell proliferation marker MIK67 across clusters. e,f, The effects of a blocking antibody against HLA-DR (e, n=5 per group) and tofacitinib and anti-viral agents (f, n=5 to 7 per group) in SMX/TMP-induced cell aggregate formation (left) and CD4+ T cell proliferation (right). Statistics are based on one-way ANOVA followed by Tukey’s (e) or Dunnett’s (f) multiple comparison test. F(4,20)=108. 4, p<0.0001 in (e); F(9,51)=37.69, p<0.0001) in (f). Centre value, mean; error bars, SD. ***p < 0.001; ****p < 0.0001; NS, not significant. All p values shown in (f) are compared to the SMX-TMP alone group (1μM ganciclovir vs. SMX-TMP, p=0.7067; 10μM ganciclovir vs. SMX-TMP, p=0.0002; 0.5μM artesunate vs. SMX-TMP, p=0.0605).

Comment in

References

    1. Duong TA, Valeyrie-Allanore L, Wolkenstein P & Chosidow O Severe cutaneous adverse reactions to drugs. Lancet 390, 1996–2011 (2017). - PubMed
    1. Kano Y, et al. Sequelae in 145 patients with drug-induced hypersensitivity syndrome/drug reaction with eosinophilia and systemic symptoms: survey conducted by the Asian Research Committee on Severe Cutaneous Adverse Reactions (ASCAR). J Dermatol 42, 276–282 (2015). - PubMed
    1. Husain Z, Reddy BY & Schwartz RA DRESS syndrome: Part I. Clinical perspectives. J Am Acad Dermatol 68, 693.e691–614; quiz 706–698 (2013). - PubMed
    1. Ushigome Y, Kano Y, Ishida T, Hirahara K & Shiohara T Short- and long-term outcomes of 34 patients with drug-induced hypersensitivity syndrome in a single institution. J Am Acad Dermatol 68, 721–728 (2013). - PubMed
    1. Husain Z, Reddy BY & Schwartz RA DRESS syndrome: Part II. Management and therapeutics. J Am Acad Dermatol 68, 709.e701–709; quiz 718–720 (2013). - PubMed

Publication types

MeSH terms