Case Reports
. 2020 Feb;26(2):244-251.
doi: 10.1038/s41591-019-0730-x. Epub 2020 Jan 20.

A human ciliopathy reveals essential functions for NEK10 in airway mucociliary clearance

Affiliations
Case Reports

A human ciliopathy reveals essential functions for NEK10 in airway mucociliary clearance

Raghu R Chivukula et al. Nat Med. 2020 Feb.

Erratum in

Abstract

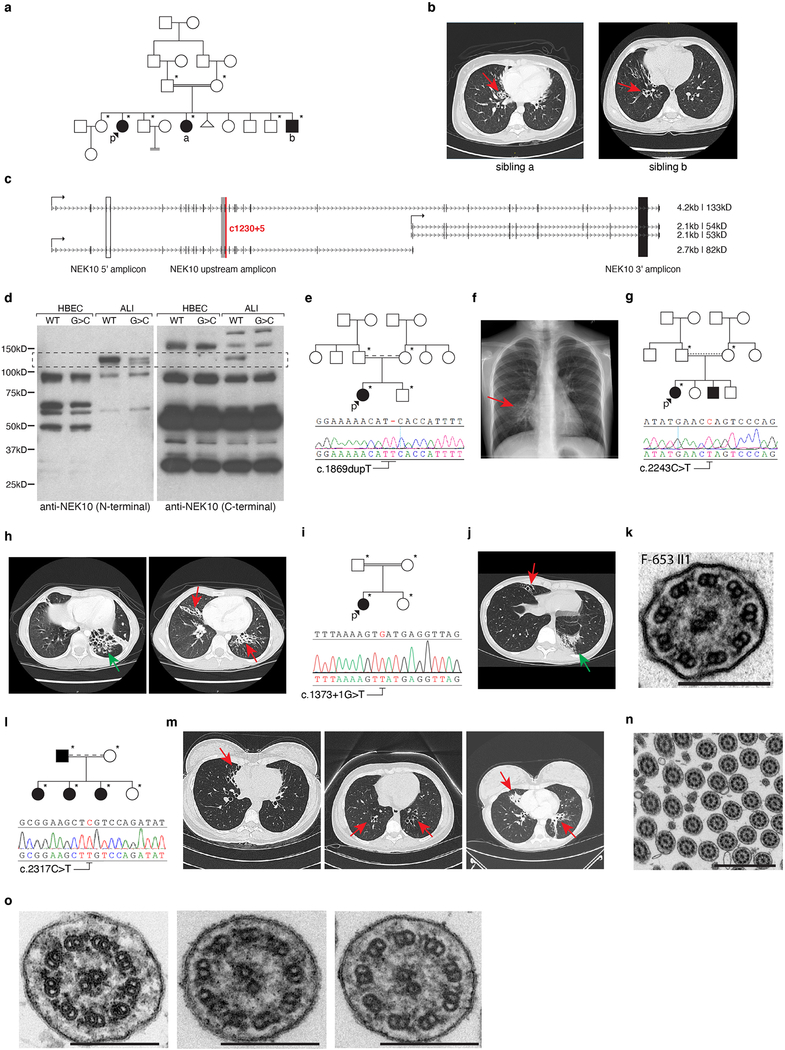
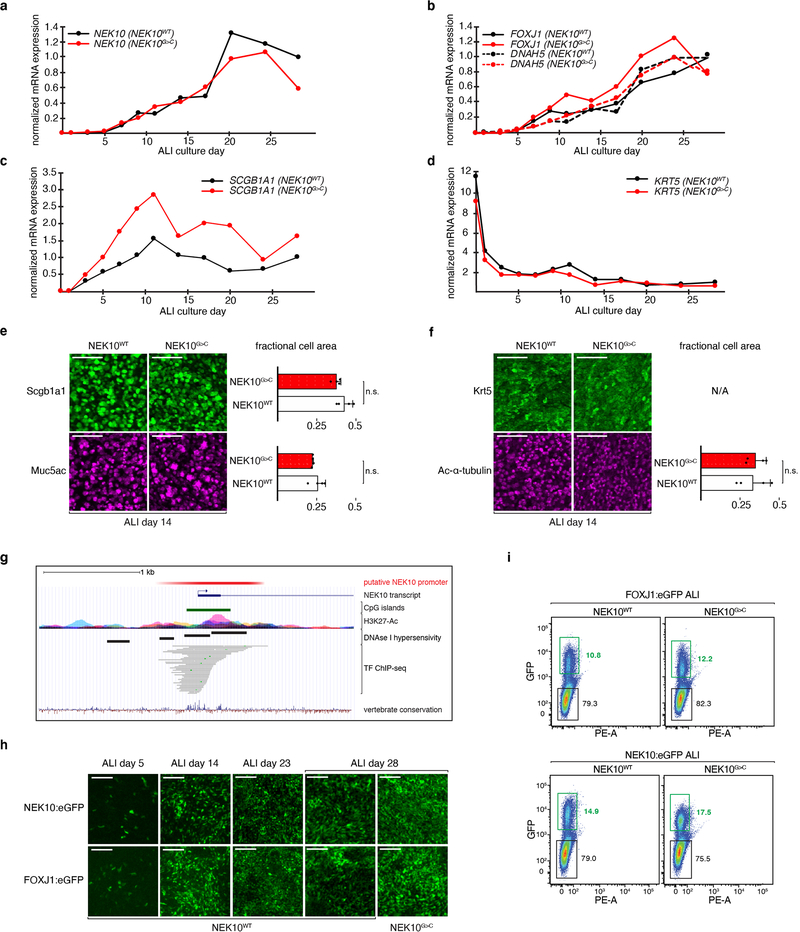
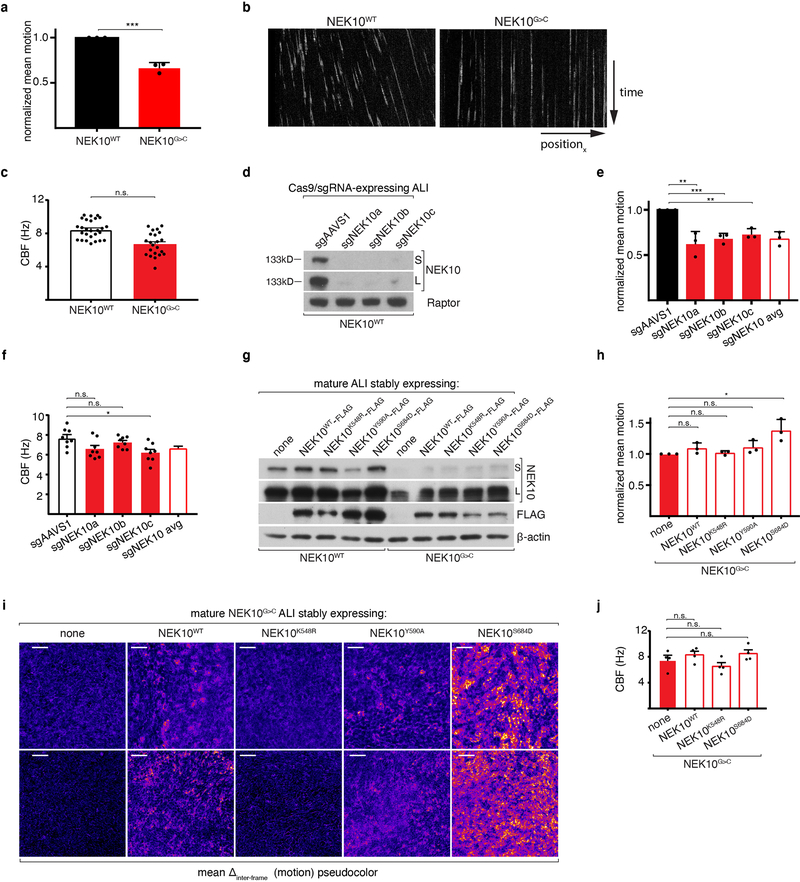
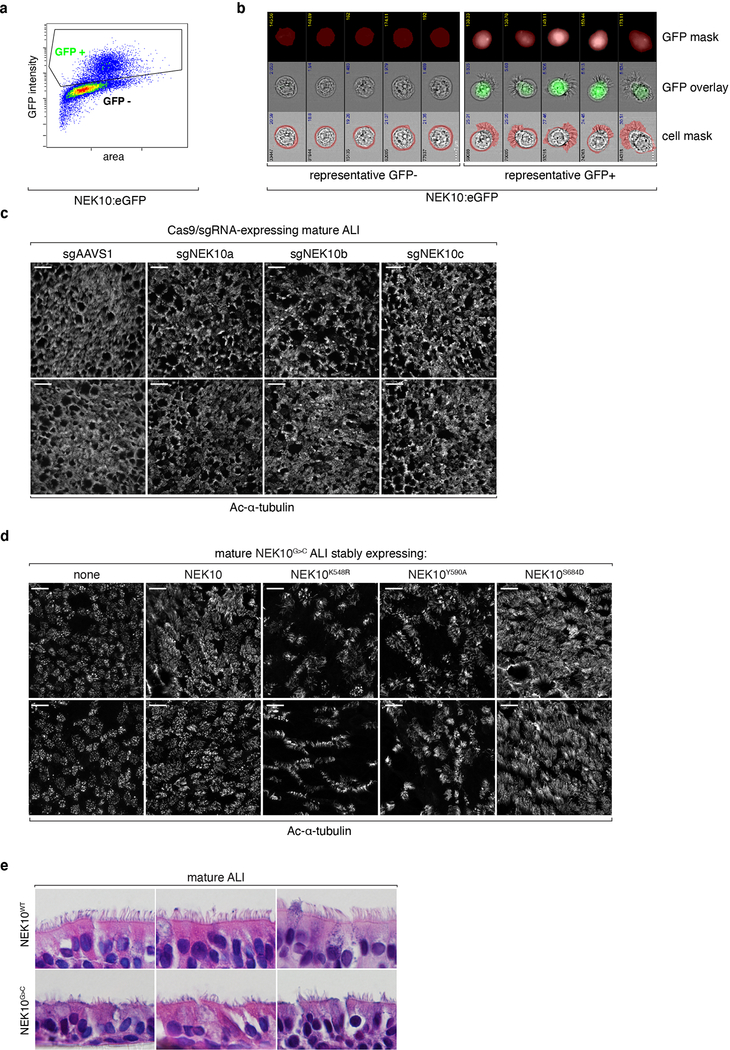
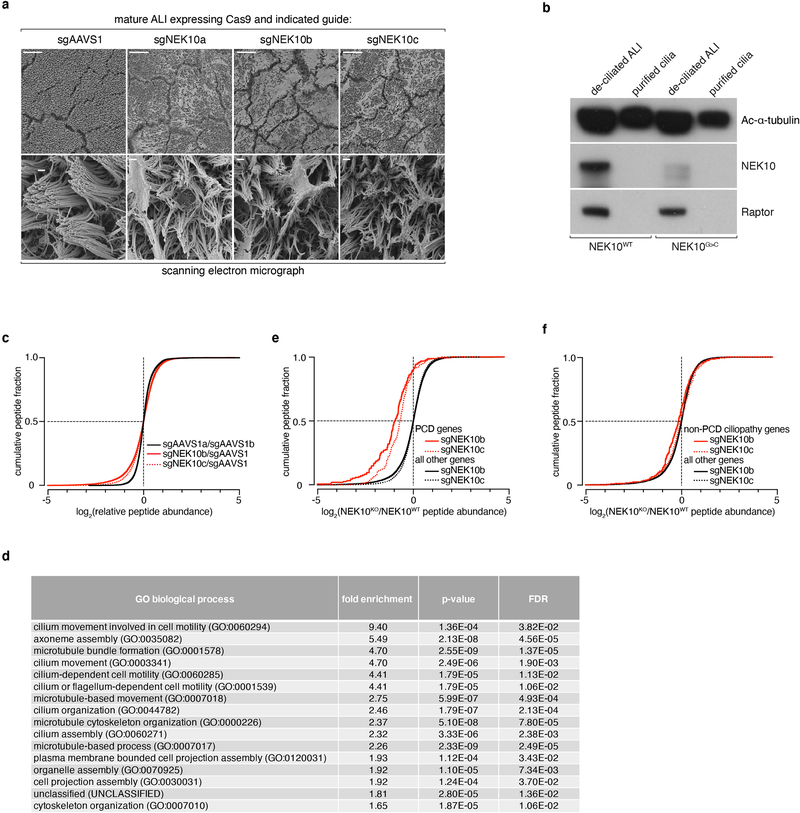
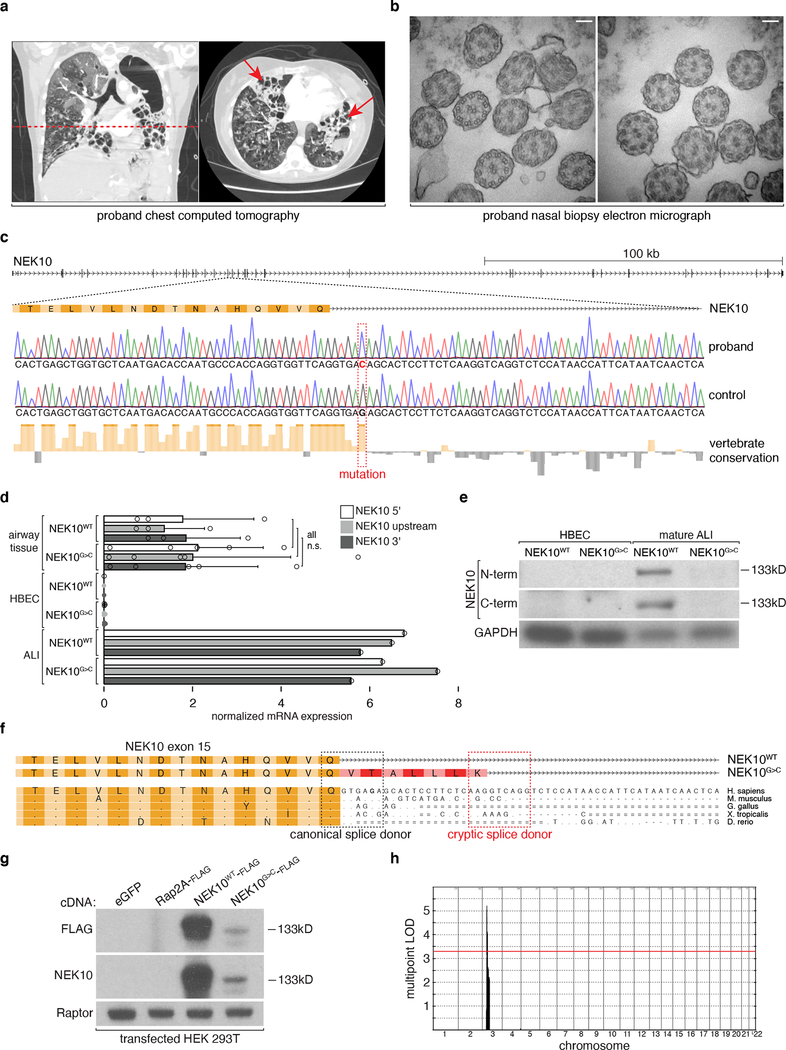
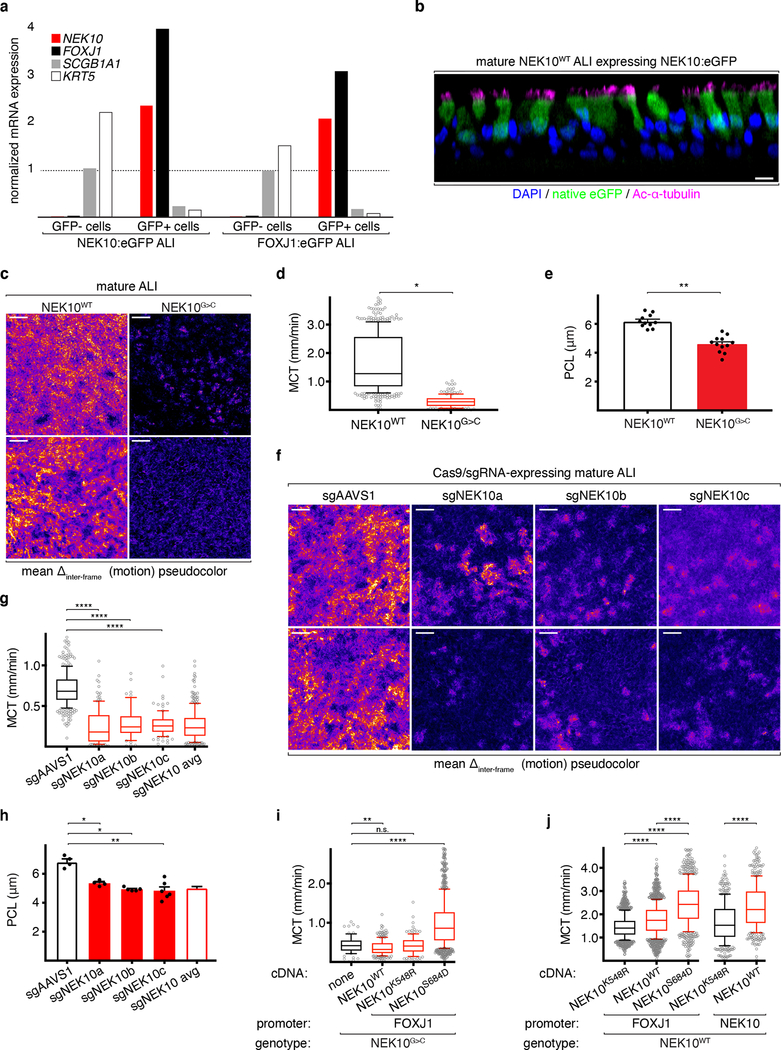
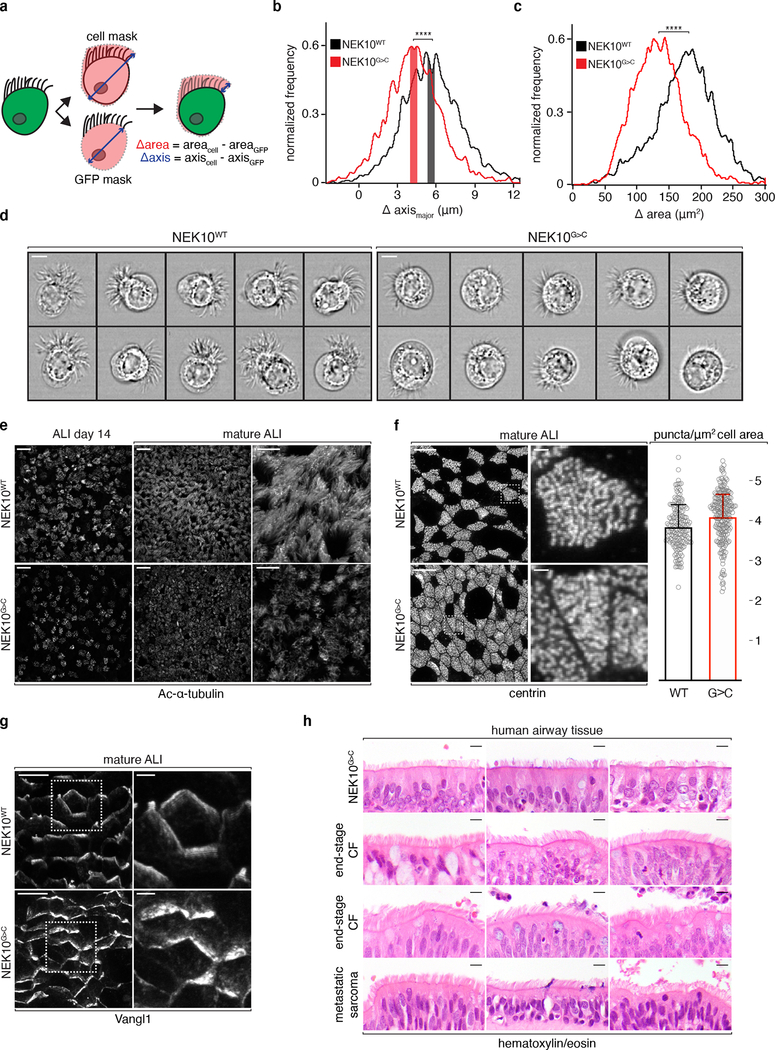
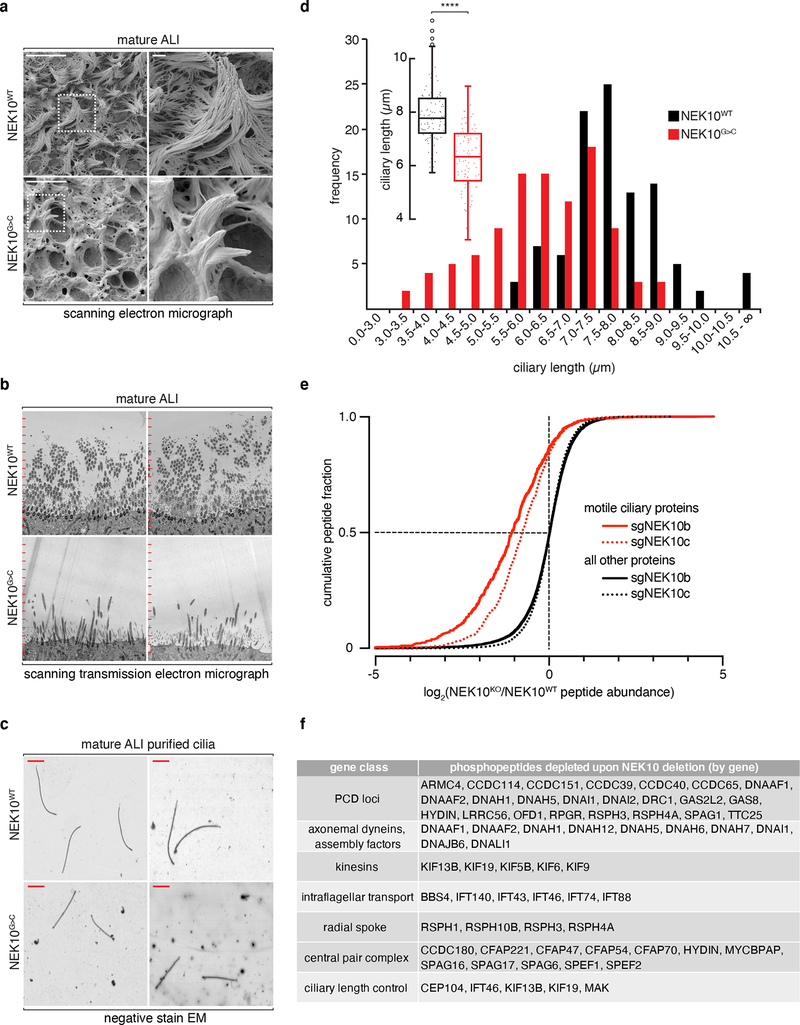
Mucociliary clearance, the physiological process by which mammalian conducting airways expel pathogens and unwanted surface materials from the respiratory tract, depends on the coordinated function of multiple specialized cell types, including basal stem cells, mucus-secreting goblet cells, motile ciliated cells, cystic fibrosis transmembrane conductance regulator (CFTR)-rich ionocytes, and immune cells1,2. Bronchiectasis, a syndrome of pathological airway dilation associated with impaired mucociliary clearance, may occur sporadically or as a consequence of Mendelian inheritance, for example in cystic fibrosis, primary ciliary dyskinesia (PCD), and select immunodeficiencies3. Previous studies have identified mutations that affect ciliary structure and nucleation in PCD4, but the regulation of mucociliary transport remains incompletely understood, and therapeutic targets for its modulation are lacking. Here we identify a bronchiectasis syndrome caused by mutations that inactivate NIMA-related kinase 10 (NEK10), a protein kinase with previously unknown in vivo functions in mammals. Genetically modified primary human airway cultures establish NEK10 as a ciliated-cell-specific kinase whose activity regulates the motile ciliary proteome to promote ciliary length and mucociliary transport but which is dispensable for normal ciliary number, radial structure, and beat frequency. Together, these data identify a novel and likely targetable signaling axis that controls motile ciliary function in humans and has potential implications for other respiratory disorders that are characterized by impaired mucociliary clearance.


Conflict of interest statement

Competing Interests Statement

The authors declare the following competing interests:

Provisional patent application in process: Applicants: Massachusetts General Hospital, Whitehead Institute for Biomedical Research, Massachusetts Institute of Technology; Inventors: Raghu R. Chivukula, David M. Sabatini; Specific aspects covered: Therapeutic augmentation of NEK10 signaling in disorders of mucociliary clearance.

Figures

Extended Data Fig. 1:
Extended Data Fig. 1:. Recurrent NEK10 mutations in familial bronchiectasis
a, pedigree indicating affected siblings (filled), proband (“p”), and subjects from whom genomic DNA was available for analysis (asterisks). b, chest computed tomography (CT) of siblings “a” and “b” from panel (a), arrows indicate regions of bronchiectatic lung. c, RefSeq-annotated NEK10 variants annotated with transcription start sites, transcript sizes, predicted protein molecular weights, and exon-exon junctions assayed by qRT-PCR in (1d). d, immunoblotting against indicated NEK10 epitopes; HBEC bands are non-specific, full-length 133kDa NEK10 protein indicated with dashed box, representative of 3 experiments. e, pedigree of kindred 2, asterisks denote family members from whom genomic DNA was available; dashed line indicates consanguinity by shared tribal ancestry, Sanger sequencing trace confirming c.1869dupT. f, chest radiograph of proband 2, arrow highlights bronchiectasis. g, pedigree of kindred 3; dashed line indicates consanguinity by shared geographical ancestry, Sanger sequencing trace confirming c.2243C>T. h, CT from proband 3 demonstrating cystic (green arrow) and cylindrical (red arrow) bronchiectasis. i, pedigree of kindred 4; Sanger sequencing trace confirming c.1371+1G>T. j, CT from proband 4 indicating right middle lobe (red arrow) and left lower lobe (green arrow) bronchiectasis. k, proband 4 nasal biopsy TEM demonstrating normal radial ciliary ultrastructure, scale bar 200nm. l, pedigree of kindred 5; dashed line indicates consanguinity by shared tribal ancestry, Sanger sequencing trace confirming c.2317C>T. m, CTs of affected siblings in (l) demonstrating bronchiectasis. n-o, nasal biopsy TEM of affected siblings in (l), scale bars 1μm (n), 200nm (o).
Extended Data Fig. 2:
Extended Data Fig. 2:. NEK10 loss does not detectably alter airway epithelial differentiation
a, 18S rRNA-normalized relative NEK10 expression during ALI differentiation; n=1 ALI culture per timepoint. b-d, 18S rRNA-normalized relative expression of ciliated cell markers FOXJ1, DNAH5 (b), secretory cell marker SCGB1A1 (c), and basal cell marker KRT5 (d); n=1 ALI culture per timepoint. e-f, whole-mount immunofluorescence microscopy against SCGB1A1 (e, upper panel), goblet cell marker MUC5AC (e, lower panel), KRT5 (f, upper panel), ciliated cell marker acetylated-α-tubulin (f, lower panel); scale bars 100μm; bar graphs indicate fraction of surface epithelium occupied by marker-positive cells, n=4 per condition representative of 6 ALI differentiations, mean ±S.D. g, schematic depiction of bioinformatic NEK10 promoter (red) identification using indicated UCSC genome browser (hg19) tracks: CpG islands, H3K27-Ac, DNAse I hypersensitivity clusters, transcription factor (TF) chromatin immunoprecipitation sequencing (ChIP-seq). h, live GFP imaging of ALI cultures of the indicated genotypes and maturity, representative of 3 independent ALI differentiations; scale bars 200μm. i, gating strategy for FACS sorting of GFP-labeled ALI cultures, numbers indicate percentage gated cells per population.
Extended Data Fig. 3:
Extended Data Fig. 3:. Functional consequences of NEK10 activity manipulation
a, quantitation of analysis in (Fig. 2c), mean ±S.D. b, kymographs of μOCT-based particle tracking from mature ALI, representative of 3 independent ALI differentiations. c, CBF (μOCT) of mature ALI of the indicated genotypes, n=27 (NEK10WT), 22 (NEK10G>C) pooled from 3 independent ALI differentiations, mean ±S.E.M. d, immunoblotting of mature ALI lysates after CRISPR/Cas9-mediated gene editing with the indicated sgRNAs, representative of 2 experiments; short (S) versus long (L) exposures indicated. e, quantitation of analysis in (Fig. 2f), mean ±S.D. f, CBF of mature ALI edited with the indicated sgRNAs, n=8 per condition pooled from 3 independent ALI differentiations, mean ±S.E.M. g, immunoblotting of mature ALI lysates transduced with the indicated cDNAs, representative of 2 experiments; short (S) versus long (L) exposures indicated. h, quantitation of analysis in (i), mean ±S.D. i, pseudocolored video microscopy of mature ALI transduced with the indicated cDNAs, representative fields from 3 independent ALI differentiations, scale bars 50μm. j, CBF of mature ALI transduced with the indicated cDNAs, n=4 per condition pooled from 3 independent ALI differentiations, mean ±S.E.M. *p≤0.05, **p≤0.01, ****p≤0.0001.
Extended Data Fig. 4:
Extended Data Fig. 4:. Experimental manipulation of NEK10 activity alters ciliated cell morphology
a, gating strategy for imaging flow cytometry analysis of MCCs. b, representative images and masking data of cells in (a), demonstrating ability to generate single NEK10:eGFP+ ciliated cells for analysis. c, confocal maximum intensity projections of mature ALI edited with the indicated sgRNAs after IF against Ac-α-tubulin, scale bars 25μm, representative of 2 independent ALI differentiations. d, confocal maximum intensity projections of mature ALI transduced with the indicated cDNAs after IF against Ac-α-tubulin, scale bars 25μm, representative of 2 independent ALI differentiations. e, H&E stained mature ALI samples of the indicated genotypes after sectioning orthogonal to the epithelial surface, representative of 3 independent ALI differentiations.
Extended Data Fig. 5:
Extended Data Fig. 5:. Structural and proteomic abnormalities in NEK10-deficient airway epithelium
a, SEM of mature ALI edited with the indicated sgRNAs, scale bars 100μm (upper panels) and 1μm (lower panels), representative of 2 independent ALI differentiations. b, immunoblotting against the indicated proteins from lysates generated from purified cilia (lanes 2, 4) or remaining de-ciliated mature ALI (lanes 1, 3), representative of 2 experiments. c, cumulative distribution of phosphopeptides by log2 fold change between indicated conditions, solid (sgNEK10b) and dashed (sgNEK10c) red lines illustrate population of depleted phosphopeptides upon NEK10 deletion. d, table of gene ontology classes enriched among genes (n=395) whose peptides are depleted >1.5 fold (log2) after targeting with sgNEK10b, enrichment level, p-values, and false discovery rates (FDR) indicated. e, cumulative distribution of phosphopeptides by log2 fold change, previously validated PCD in red and all other detected proteins in black, as in (4e). f, cumulative distribution of phosphopeptides by log2 fold change, previously validated non-PCD ciliopathy loci in red and all other detected proteins in black, as in (4e).
Fig. 1:
Fig. 1:. Familial bronchiectasis associated with NEK10 loss-of-function
a, Chest computed tomography (CT) imaging of proband 1 upon clinical presentation. Dashed line indicates level of cross-sectional imaging in right panel. Arrows highlight cystic bronchiectatic destruction of lung. b, transmission electron micrograph of proband 1 nasal biopsy specimen demonstrating normal radial ciliary ultrastructure, scale bars indicate 100nm. c, schematic depiction of 3’ terminus of NEK10 exon 15 and following intron, Sanger sequencing traces highlight G>C point mutation (red nucleotide) and high degree of conservation (red dashed box). d, 18S rRNA-normalized relative expression of indicated amplicons; n=3 independent lung tissue donors (controls), n=5 independently isolated lung regions (NEK10G>C), n=3 independently isolated HBEC lines for NEK10G>C, n=1 for remaining samples, mean ±S.D. e, immunoblotting against the indicated proteins from cultured HBECs and ALI, NEK10 immunogen indicated, representative of 3 experiments. f, schematic representation of NEK10 cDNA sequencing results from indicated genotypes, common (yellow) and NEK10G>C specific (red) residues indicated, canonical and cryptic splice donor motifs highlighted. g, immunoblotting after transient transfection of HEK293T cells with the indicated cDNAs, representative of 2 experiments. h, results of genome-wide linkage analysis incorporating individuals (n=15) highlighted with asterisks in (Extended Data Fig. 1a, 1e, 1g), peak bounded by marker SNPs rs13072262 and rs17798444, red line indicates LOD 3.3, equivalent to genome-wide p<0.05. Images in (c) and (f) generated from UCSC genome browser hg19 assembly (http://genome.ucsc.edu).
Fig. 2:
Fig. 2:. NEK10 is a ciliated cell-specific gene required for effective mucociliary transport
a, 18S rRNA-normalized relative expression of indicated transcripts from FACS-sorted ALI cells; dashed line indicates expression level from unsorted mature ALI. b, confocal immunofluorescence of GFP in ciliated cells in NEK10p:eGFP ALI, representative of 2 independent ALI differentiations, scale bar 10μm. c, pseudocolored video microscopy of ALI of the indicated genotypes, representative of 3 independent ALI differentiations, scale bars 50μm. d, MCT (μOCT) of mature ALI of the indicated genotypes, n=485 (NEK10WT), 180 (NEK10G>C) pooled from 3 independent ALI differentiations, plot indicates median (center line), 25th/75th percentiles (box), 10th/90th (whiskers) percentiles, and remaining points (open circles). e, PCL (μOCT) of ALI of the indicated genotypes, n=11 (NEK10WT), 12 (NEK10G>C) pooled from 3 independent ALI differentiations, mean ±S.E.M. f, pseudocolored video microscopy of CRISPR/Cas9-edited ALI, representative fields from 3 independent ALI differentiations, scale bars 50μm. g, MCT of CRISPR/Cas9-edited ALI, n=361 (sgAAVS1), 131 (sgNEK10a), 59 (sgNEK10b), 104 (sgNEK10c) pooled from 3 independent ALI differentiations, plotted as in (g). h, PCL of CRISPR/Cas9-edited ALI, n=4 (sgAAVS1), 4 (sgNEK10a), 5 (sgNEK10b), 6 (sgNEK10c) pooled from 3 independent ALI differentiations, mean ±S.E.M. i, MCT of NEK10G>C ALI expressing the indicated cDNAs, n=71 (no cDNA), 254 (NEK10WT), 129 (NEK10K548R), 1081 (NEK10S684D), pooled from 3 independent ALI differentiations, mean ±S.E.M. j, MCT of NEK10WT ALI expressing the indicated cDNAs, n=1385 (FOXJ1:NEK10K548R), 1624 (FOXJ1:NEK10WT), 728 (FOXJ1:NEK10S684D), 401 (NEK10:NEK10K548R), 426 (NEK10:NEK10WT) pooled from 3 independent ALI differentiations, plotted as in (g). *p≤0.05, **p≤0.01, ****p≤0.0001
Fig. 3:
Fig. 3:. Morphologically abnormal ciliated cells in NEK10-deficient airway
a, schematic masking workflow for IFC morphological analysis. b, histogram of ciliary zone thickness of mature ALI MCCs of the indicated genotypes, n=4108 (NEK10WT), 3513 (NEK10G>C), shaded bars indicate medians ±0.25μm. c, histogram of ciliary area of mature ALI MCCs of the indicated genotypes, n=4108 (NEK10WT), 3513 (NEK10G>C). d, single cell images taken from the shaded regions in (b), scale bars 7μm. e, confocal maximum intensity projections (MIPs) of ALI of the indicated genotype and maturity following IF against Ac-α-tubulin, representative of 3 independent ALI differentiations, scale bars 25μm (left 4 panels) and 10μm (right 2 panels). f, confocal MIPs of mature ALI after IF against basal body marker centrin, dashed boxes mark full resolution regions in middle panels, scale bars 10μm (left 2 panels) and 1μm (middle 2 panels); column graph: centrin puncta per μm (mean ±S.D.) of ciliated cell surface area, n=71 cells and 10,855 puncta (NEK10WT), 38 cells and 5,369 puncta (NEK10G>C) pooled from 4 independent ALI differentiations. g, confocal MIPs of mature ALI after IF against PCP marker Vangl1, dashed boxes mark full resolution regions in right panel, scale bars 10μm (left panels) and 2.5μm (right panels), representative of 3 independent ALI differentiations. h, hematoxylin/eosin stained human large airway tissue; upper 3 samples taken from lung explants during transplantation for end-stage bronchiectasis due to the indicated etiologies, 4th sample from patient undergoing resection for an unrelated diagnosis, scale bars 5μm. ****p≤0.0001.
Fig. 4:
Fig. 4:. NEK10 regulates ciliary length through widespread effects on the ciliary proteome
a, SEM of mature ALI of the indicated genotype, dashed boxes mark full resolution regions in right panel, scale bars 10μm (left panels) or 1μm (right panels), representative of 3 independent ALI differentiations. b, STEM of mature ALI of the indicated genotype after embedding and sectioning orthogonal to the epithelial surface, tick marks spaced at 1μm, representative of 3 independent ALI differentiations. c, representative negative stain EM grids prepared from purified cilia of the indicated genotypes, red scale bar indicates 1μm, representative of 2 independent ALI differentiations. d, histogram of ciliary length from purified cilia of the indicated genotypes, n=101 (NEK10WT), 102 (NEK10G>C) pooled from 2 independent ALI differentiations; inset: box-and-whisker plot of these data, center-line indicates median, box bounds 25th and 75th percentile, whiskers indicate 1.5*IQR, circles indicate outliers. e, cumulative distribution of phosphopeptides by log2 fold change, previously identified motile ciliary proteins in red, all other detected proteins in black, sgNEK10b and sgNEK10c are independently targeting guide RNAs validated in (Extended Data Fig. 3d). f, Table of ciliary genes by functional class with phosphopeptides depleted ≥2-fold upon NEK10 deletion. ****p≤0.0001

References

Main Text References

    1. Tilley AE, Walters MS, Shaykhiev R & Crystal RG Cilia Dysfunction in Lung Disease. Annu. Rev. Physiol 77, 379–406 (2015). - PMC - PubMed
    1. Montoro DT et al. A revised airway epithelial hierarchy includes CFTR-expressing ionocytes. Nature 560, 319–324 (2018). - PMC - PubMed
    1. Gould CM, Freeman AF & Olivier KN Genetic Causes of Bronchiectasis. Clinics in Chest Medicine 33, 249–263 (2012). - PubMed
    1. Zariwala MA, Knowles MR & Omran H Genetic defects in ciliary structure and function. Annu. Rev. Physiol 69, 423–450 (2007). - PubMed
    1. Online Mendelian Inheritance in Man, OMIM. omim.org Available at: https://www.omim.org/. (Accessed: 11 November 2019)

Methods-only References

    1. Neuberger T, Burton B, Clark H & Van Goor F in Cystic Fibrosis 39–54 (Humana Press, 2011). doi:10.1007/978-1-61779-117-8_4 - DOI - PubMed
    1. Hoffmann K & Lindner TH easyLINKAGE-Plus—automated linkage analyses using large-scale SNP data. Bioinformatics 21, 3565–3567 (2005). - PubMed
    1. Schindelin J et al. Fiji: an open-source platform for biological-image analysis. Nat. Methods 9, 676–682 (2012). - PMC - PubMed
    1. Wang T et al. Identification and characterization of essential genes in the human genome. Science 350, 1096–1101 (2015). - PMC - PubMed
    1. Liu L et al. Imaging the subcellular structure of human coronary atherosclerosis using micro-optical coherence tomography. Nat. Med 17, 1010–1014 (2011). - PMC - PubMed

Publication types

MeSH terms