. 2020 Feb;52(2):160-166.
doi: 10.1038/s41588-019-0556-y. Epub 2020 Jan 20.

Multitrait analysis of glaucoma identifies new risk loci and enables polygenic prediction of disease susceptibility and progression

Affiliations

Multitrait analysis of glaucoma identifies new risk loci and enables polygenic prediction of disease susceptibility and progression

Jamie E Craig et al. Nat Genet. 2020 Feb.

Abstract

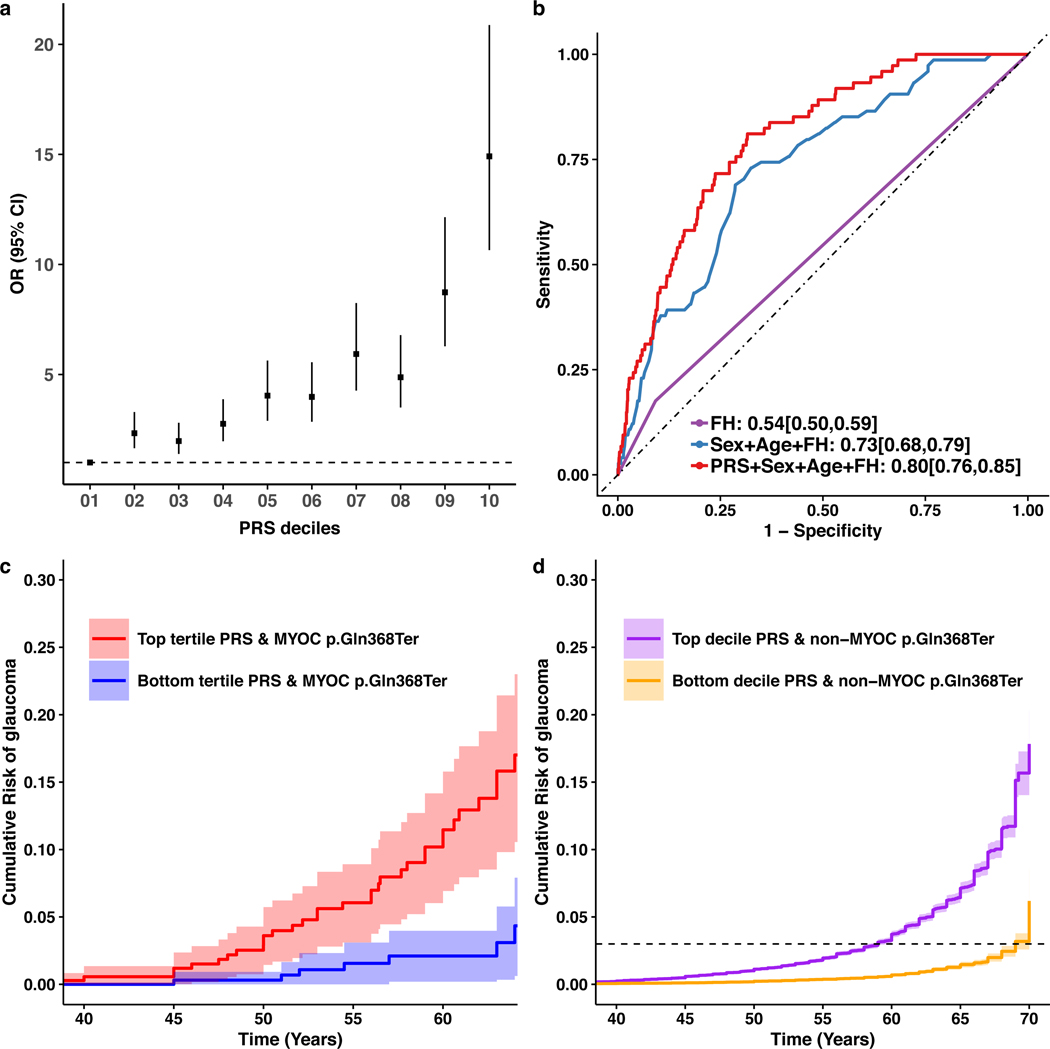
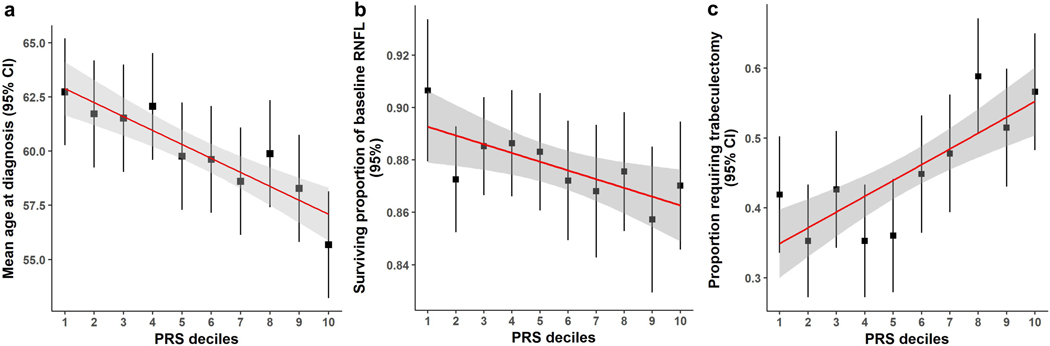
Glaucoma, a disease characterized by progressive optic nerve degeneration, can be prevented through timely diagnosis and treatment. We characterize optic nerve photographs of 67,040 UK Biobank participants and use a multitrait genetic model to identify risk loci for glaucoma. A glaucoma polygenic risk score (PRS) enables effective risk stratification in unselected glaucoma cases and modifies penetrance of the MYOC variant encoding p.Gln368Ter, the most common glaucoma-associated myocilin variant. In the unselected glaucoma population, individuals in the top PRS decile reach an absolute risk for glaucoma 10 years earlier than the bottom decile and are at 15-fold increased risk of developing advanced glaucoma (top 10% versus remaining 90%, odds ratio = 4.20). The PRS predicts glaucoma progression in prospectively monitored, early manifest glaucoma cases (P = 0.004) and surgical intervention in advanced disease (P = 3.6 × 10⁻⁶). This glaucoma PRS will facilitate the development of a personalized approach for earlier treatment of high-risk individuals, with less intensive monitoring and treatment being possible for lower-risk groups.


Figures

Extended Data Fig. 1
Extended Data Fig. 1. Study design
We applied the multi-trait analysis of GWAS (MTAG) algorithm to datasets of European descent (unless otherwise specified). a, We applied MTAG to four datasets (glaucoma case-control GWAS from the UKBB; GWAS meta-analysis of intraocular pressure (IOP) from the International Glaucoma Genetics Consortium (IGGC) and the UKBB; Vertical cup-disc ratio (VCDR) GWAS data that was either adjusted for vertical disc diameter (VDD) in the UKBB dataset; or not adjusted for VDD in the IGGC). Novel variants identified through this analysis were then confirmed in two independent data sets: an Australasian cohort of advanced glaucoma (ANZRAG) and a consortium of cohorts from the United States (NEIGHBORHOOD). The clinical significance of the PRS derived from the MTAG analysis was validated in independent samples: first, in advanced glaucoma cases (ANZRAG and samples from Southampton/Liverpool in the UK), and second, in a prospectively monitored clinical cohort with early manifest glaucoma (PROGRESSA). b, Prediction in BMES, where we removed the IGGC VCDR and IGGC IOP GWAS from the training datasets, given that they contain BMES data. c, Prediction in the UKBB glaucoma and ICD-10 POAG cases. Here we removed all glaucoma cases and 3,000 controls with IOP/VCDR measurements as well as their relatives from UKBB VCDR/IOP GWAS. We also evaluated the performance of PRS in non-European ancestry (192 cases and 6,841 controls of South Asian ancestry in UKBB). d, Cumulative risk of glaucoma in UKBB. For the analysis of MYOC p.Gln368Ter carriers (n = 965; cases = 72; controls = 893), participants were stratified into tertiles of PRS. We also examined cumulative risk of glaucoma in the general population (i.e. in MYOC p.Gln368Ter non-carriers, n = 381,196; cases = 7,381; controls = 373,815) stratifying by deciles of the PRS. The discovery and testing datasets were designed to derive the PRS with no sample overlap (Supplementary Note).
Figure 1 |
Figure 1 |. Manhattan plot displaying glaucoma-specific P values from the multi-trait GWAS (MTAG) analysis.
The samples used in multi-trait analysis is presented in Extended Data Figure1a. Novel SNPs are highlighted in red dots, with the nearest gene names in black text. Known SNPs are highlighted in purple dots, with the nearest gene names in purple text. The red line is the genome-wide significance level at 5 × 10⁻⁸.
Figure 2 |
Figure 2 |. Comparison of the effect sizes (log odds ratio) for 114 genome-wide significant independent SNPs identified from the glaucoma multiple trait analysis of GWAS in the UKBB versus those in independent glaucoma cohorts (meta-analysis of ANZRAG and NEIGHBORHOOD).
Pearson’s correlation coefficient is 0.88 (P = 1.6 × 10−36). The red line is the best fit line, with the 95% confidence interval region in grey. Novel glaucoma SNPs are highlighted in red and known SNPs in purple.
Figure 3 |
Figure 3 |. Multiple trait analysis of GWAS PRS prediction.
a, Odds ratio (OR) of developing advanced glaucoma in the ANZRAG cohort (with 1,734 advanced glaucoma cases and 2,938 controls) for each PRS decile. The square dots are the OR values (adjusted for sex and the first four principal components) and the error bars are 95% confidence interval. The dashed line is the reference at the bottom PRS decile (OR = 1). b, AUCs of PRS in BMES. The MTAG-derived PRS provided additional predictive ability on top of traditional risk factors (age, sex, and self-reported family history (FH), DeLong’s test P = 0.002). The AUC is based on a logistic regression model with the coefficients for age, sex, FH and PRS estimated from the BMES data (Supplementary Table 10). c, Cumulative risk of glaucoma in UKBB MYOC p.Gln368Ter carriers stratifying by the PRS (adjusted for sex and first six genetic principal components). Here the cumulative risk of tertiles (with 95% confidence intervals) of PRS are displayed given the relatively small number of MYOC p.Gln368Ter carriers (n = 965). d, Cumulative risk of glaucoma for people in the top and bottom decile (with 95% confidence intervals) of PRS of the UKBB who do not have the MYOC p.Gln368Ter variant (adjusted for sex and first six genetic principal components). The dashed line is the reference line of cumulative risk at 3%.
Figure 4 |
Figure 4 |. Clinical implications of the glaucoma PRS.
a, Mean age at diagnosis (years) for each decile of PRS in the ANZRAG cohort (linear regression P = 1.8 × 10⁻⁵). A total of 1,336 cases had accurate age at diagnosis information. We calculated the mean age at diagnosis for each decile of PRS, adjusted for sex and the first four principal components in a linear regression model. The square dots are the regression-based mean age at diagnosis, with error bars for 95% confidence intervals. The red line is the line of best fit, with 95% confidence intervals in grey. b, Proportion of preserved baseline retinal nerve fibre layer for PROGRESSA participants with early manifest glaucoma plotted against PRS decile (n = 388; linear regression P = 0.004). The square dots are the retinal nerve fibre layer proportions, with error bars showing 95% confidence intervals. The remaining retinal nerve fibre layer proportion is calculated for the most affected quadrant of the most affected eye of each patient — as determined on optical coherence tomography scans at baseline and latest follow-up scan. c, Proportion of patients requiring trabeculectomy in either eye in the ANZRAG POAG cohort (linear regression P = 3.6 × 10⁻⁶). There were 1,360 cases with records of surgical treatment status. The square dots represent the observed average proportion of cases in each decile of PRS who required trabeculectomy, with 95% confidence interval bars. The line of best fit is shown in red, with 95% confidence interval shaded in grey.

References

    1. Weinreb RN & Khaw PT Primary open-angle glaucoma. Lancet 363, 1711–1720 (2004). - PubMed
    1. Tham Y-C et al. Global prevalence of glaucoma and projections of glaucoma burden through 2040: a systematic review and meta-analysis. Ophthalmology 121, 2081–2090 (2014). - PubMed
    1. Quigley HA & Broman AT The number of people with glaucoma worldwide in 2010 and 2020. Br. J. Ophthalmol 90, 262–267 (2006). - PMC - PubMed
    1. Chan MPY et al. Glaucoma and intraocular pressure in EPIC-Norfolk Eye Study: cross sectional study. BMJ 358, j3889 (2017). - PMC - PubMed
    1. Mitchell P, Smith W, Attebo K. & Healey PR Prevalence of open-angle glaucoma in Australia. The Blue Mountains Eye Study. Ophthalmology 103, 1661–1669 (1996). - PubMed

Methods-only References:

    1. Bycroft C. et al. The UK Biobank resource with deep phenotyping and genomic data. Nature 562, 203–209 (2018). - PMC - PubMed
    1. Han X. et al. Genome-wide association analysis of 95,549 individuals identifies novel loci and genes influencing optic disc morphology. Hum. Mol. Genet (2019). doi:10.1093/hmg/ddz193 - DOI - PubMed
    1. Springelkamp H. et al. New insights into the genetics of primary open-angle glaucoma based on meta-analyses of intraocular pressure and optic disc characteristics. Hum. Mol. Genet 26, 438–453 (2017). - PMC - PubMed
    1. Souzeau E. et al. Australian and New Zealand Registry of Advanced Glaucoma: methodology and recruitment. Clin. Experiment. Ophthalmol 40, 569–575 (2012). - PubMed
    1. Gharahkhani P. et al. Common variants near ABCA1, AFAP1 and GMDS confer risk of primary open-angle glaucoma. Nat. Genet 46, 1120–1125 (2014). - PMC - PubMed

Publication types

MeSH terms

Substances