Observational Study
. 2020 Feb;52(2):167-176.
doi: 10.1038/s41588-019-0567-8. Epub 2020 Jan 20.

Genetic studies of urinary metabolites illuminate mechanisms of detoxification and excretion in humans

Affiliations
Observational Study

Genetic studies of urinary metabolites illuminate mechanisms of detoxification and excretion in humans

Pascal Schlosser et al. Nat Genet. 2020 Feb.

Abstract

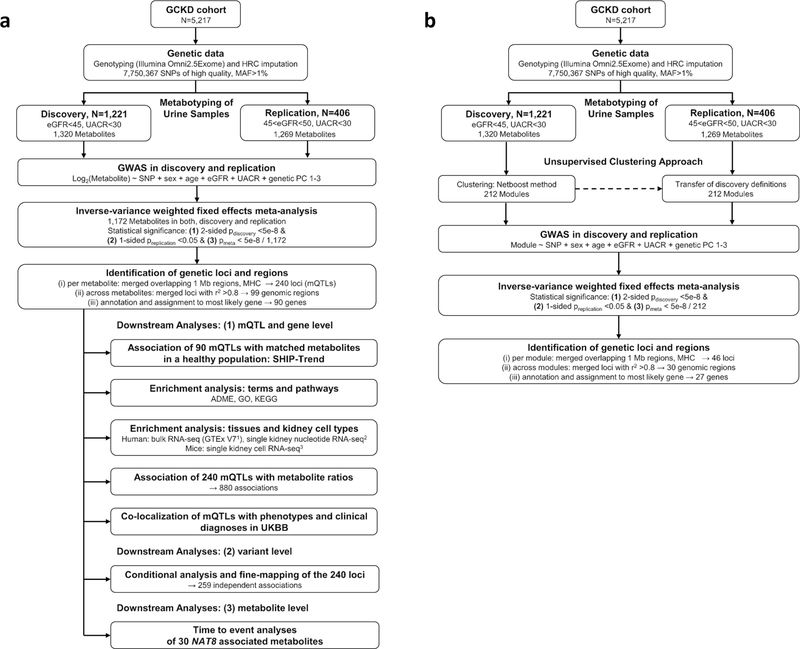
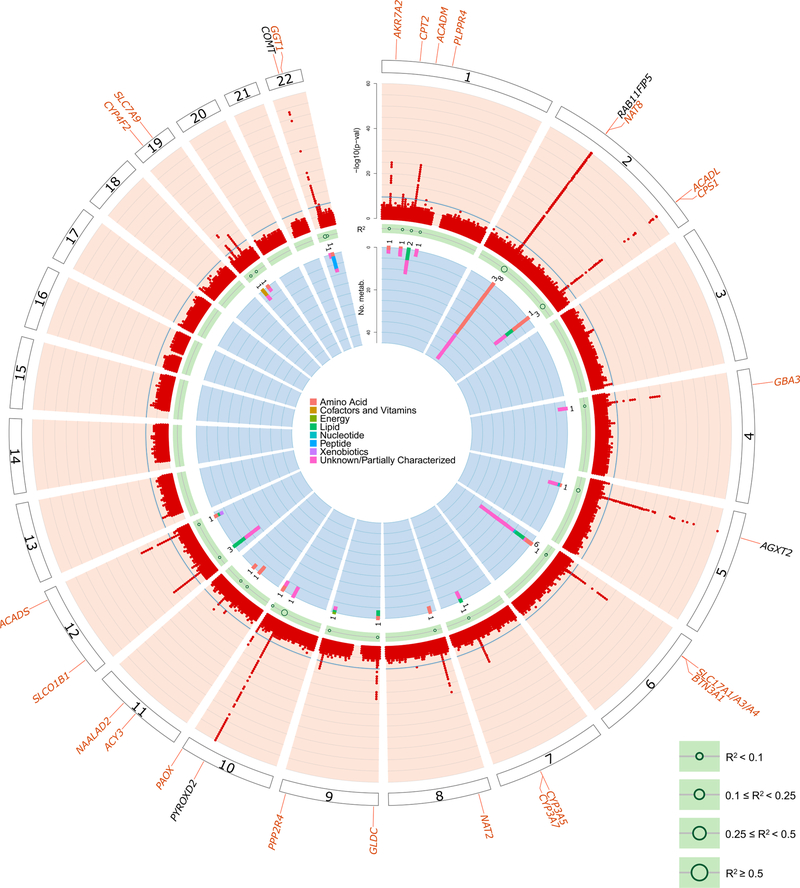
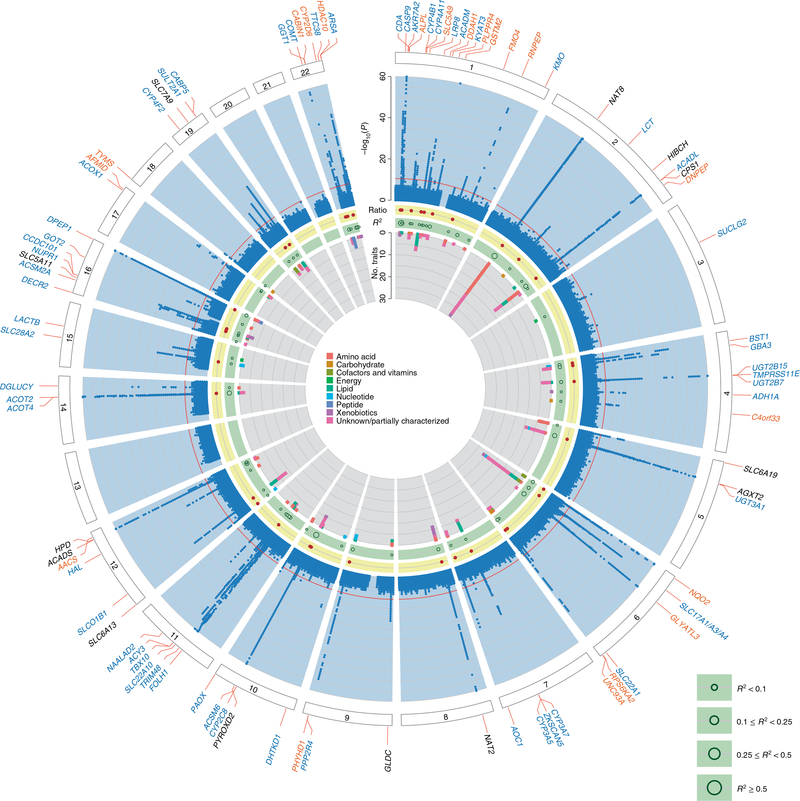
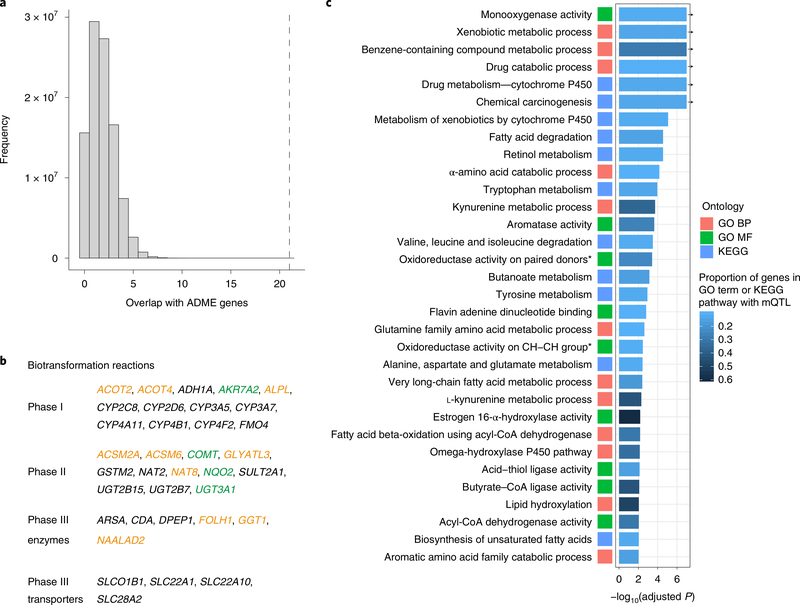
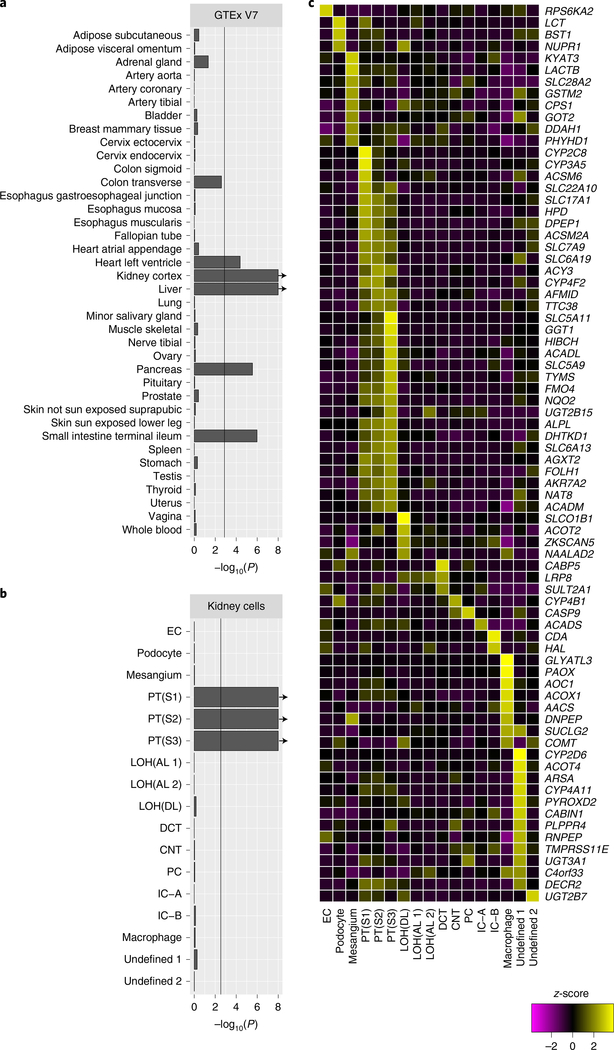
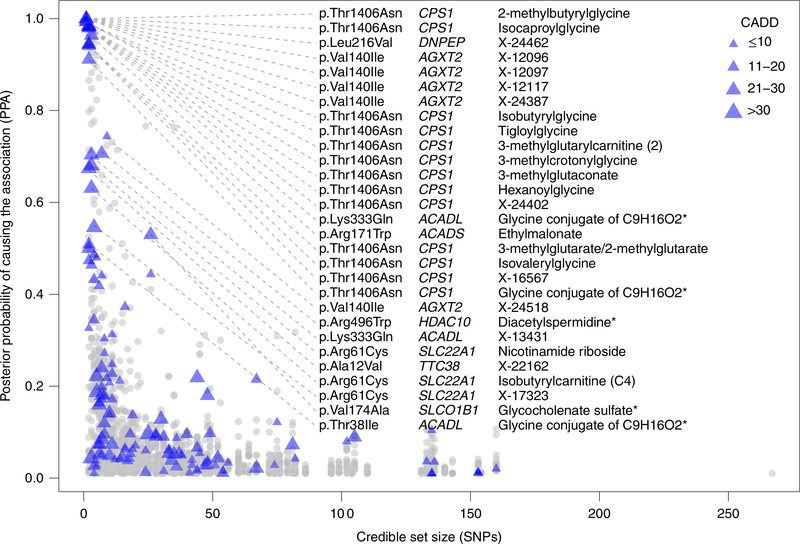
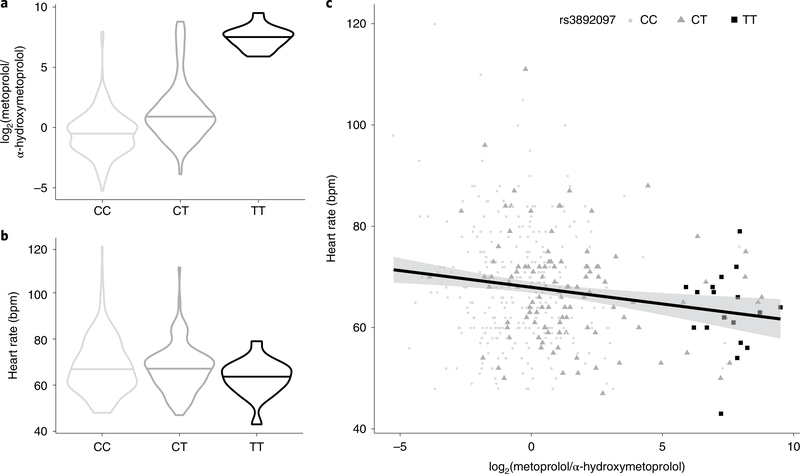
The kidneys integrate information from continuous systemic processes related to the absorption, distribution, metabolism and excretion (ADME) of metabolites. To identify underlying molecular mechanisms, we performed genome-wide association studies of the urinary concentrations of 1,172 metabolites among 1,627 patients with reduced kidney function. The 240 unique metabolite-locus associations (metabolite quantitative trait loci, mQTLs) that were identified and replicated highlight novel candidate substrates for transport proteins. The identified genes are enriched in ADME-relevant tissues and cell types, and they reveal novel candidates for biotransformation and detoxification reactions. Fine mapping of mQTLs and integration with single-cell gene expression permitted the prioritization of causal genes, functional variants and target cell types. The combination of mQTLs with genetic and health information from 450,000 UK Biobank participants illuminated metabolic mediators, and hence, novel urinary biomarkers of disease risk. This comprehensive resource of genetic targets and their substrates is informative for ADME processes in humans and is relevant to basic science, clinical medicine and pharmaceutical research.


Conflict of interest statement

Competing interests

R.P.M. is an employee of Metabolon and, as such, has affiliations with or financial involvement with Metabolon. All other authors have no competing interests.

Figures

Extended Data Fig. 1
Extended Data Fig. 1. Overview of the study design.
Schematic representation of the genome-wide screens for single metabolites (a) and eigenmetabolites (b) and their follow up analyses.
Extended Data Fig. 2
Extended Data Fig. 2. Comparison of genetic effects with and without adjustment for eGFR.
Each point represents one of the 240 replicated metabolite-associated mQTLs. Genetic effect size estimates per modeled risk allele including adjustment for eGFR and UACR (x axis) by linear regression, as done in the main analysis, were plotted against those obtained after adjustment for genetic PCs, age and sex only (y axis).
Extended Data Fig. 3
Extended Data Fig. 3. Evaluation of genetic associations of replicated mQTLs from CKD patients in a healthy population sample.
(a) Each point represents the index SNP of one of 90 associations that could be matched between the Metabolon platforms of the GCKD and SHIP-Trend studies (see Supplementary Table 5). Dot size is proportional to the −log10(P value) in GCKD and error bars represent 1.96× standard errors in each study. The red line corresponds to a linear regression based on the effect estimates of the most significant index SNP in each of the 35 unique genetic regions into which the 90 associations map. (b) 81 mQTLs with −log10 (P value) >12 are plotted. In subsequent panels, the color codes correspond to the detection mode of the mass spectrometer (c), metabolite super pathway (d), differences in relative standard deviation based on measurements of duplicate samples as a measure of precision (e), and the percent of imputed values in GCKD (f). For strata with at least 10 matched mQTLs, additional regression lines were added with color-coding corresponding to the respective legends.
Extended Data Fig. 4
Extended Data Fig. 4. Cell type-specific expression of associated genes in murine kidney.
(a): Resampling based enrichment testing showed that the murine homologs of the 90 associated genes are enriched for cell type-specific expression in proximal tubule in mice (see Supplementary Table 8). The vertical line indicates the statistical significance threshold after Bonferroni adjustment; the arrow indicates a P value<1e-8. (b): Heatmap illustrates the relative expression of each associated gene across the murine kidney cell types; only genes with z-score >2 in at least one cell type are plotted. The mouse gene homologs are provided in parentheses. EC: endothelial cells; PT: proximal tubule; LOH: loop of Henle; DCT: distal convoluted tubule; PC: principal cells; IC: Intercalated cells; CD-Trans: collecting duct transient cells; NK: natural killer cells.
Extended Data Fig. 5
Extended Data Fig. 5. Association between the index SNP at SLC7A9 and pair-wise metabolite ratios reveals transported substrates in vivo.
The figure uses color coding to show the strength of associations (coefficient’s t-test statistics scaled to [-1,1]) between genotype and the 83 ratios that contained information beyond the associations of their individual components (P-gain >6,728,320, Methods), based on linear regression analysis of 672,832 pair-wise metabolite ratios (1172*1171/2, excl. 13,374 ratios with <300 measurements). Coefficient’s test statistics of results that did not confer additional information (P-gain≤6,728,320) are uniformly presented in gray. The metabolite on the y axis represents the numerator and on the x axis the denominator of the respective ratio. Super-pathways: 01 amino acid, 02 carbohydrate, 04 energy, 05 lipid, 06 nucleotide, 08 peptide, 09 unknown. Metabolites that are a member of more than four associated metabolite ratios with a scaled test statistic >0.5 (absolute) are marked in bold. The T allele at rs12460876 was associated with higher gene expression, in agreement with greater tubular reuptake of lysine, resulting in lower urinary levels. Source data underlying this figure including number of values per ratio (column O) can be found in SourceDataEDF5.xlxs.
Extended Data Fig. 6
Extended Data Fig. 6. Overview and examples of metabolite clustering.
(a) shows the dendrogram of the metabolite clustering. The band of color indicates membership of each of the 1,172 metabolites in one of 212 clustered metabolite modules. (b) illustrates module ME193, for which metabolites are labeled. (c) displays the distribution of the eigenmetabolite of ME193 (y axis) with genotype at rs2147896 in PYROXD2 (x axis). (d) illustrates module ME161, for which metabolites are labeled. (e) displays the distribution of the eigenmetabolite of ME161 (y axis) with genotype at rs13538 in NAT8 (x axis). In (c) and (e) horizontal lines indicate medians, violin plots are clipped to the range of the 1,627 samples.
Extended Data Fig. 7
Extended Data Fig. 7. Circular presentation of genetic associations with eigenmetabolites.
The light red band shows the −log10 (P value) for genetic associations with eigenmetabolite levels, representing their respective module, by chromosomal position. Associations of all 212 eigenmetabolites in the 1627 samples are overlaid in the red band, are based on linear regressions, and association P values are capped at 1e-60. The blue line indicates genome-wide significance (P=2.4e-10).For detail about significant associations see Supplementary Table 12. Black gene labels indicate genetic regions in which all members of a given module were also identified in the single metabolite mGWAS, orange labels indicate genetic regions where additional metabolites were implicated as members of a module. The light green band shows the maximum variance in eigenmetabolite levels explained by the index SNP at each genetic region by dark green circles, with the sizes of circles corresponding to different ranges of explained variance. The inner blue band shows a stacked representation of the number of implicated metabolites in each genetic region, is colored according to the super-pathways to which they belong, and the number of modules in the genetic region is given next to it. Color keys of metabolite super-pathways are presented in the middle.
Extended Data Fig. 8
Extended Data Fig. 8. Identification of the unknown metabolite X-13689 as the glucuronide of alpha-CMBHC.
The extracted ion chromatograms (upper right) show the same retention time for both the unknown metabolite in a reference urine matrix (“neat urine”) and the candidate molecule in a neat solution (“neat synthetic”). The MS/MS fragmentation spectra of the candidate molecule (lower left) and of the unknown metabolite (lower right) show the same fragments with equal relative intensities; consequently, the candidate molecule is verified. The m/z (observed) for X-13689 is 495.22438, and the m/z (predicted) for alpha-CMBHC glucuronide is 495.22357, representing a 1.6 ppm error. The 319.1921 fragment peak represents the loss of glucuronic acid (a loss of 176), from which a loss of CO2 (−43.9898) yields the 275.201 fragment peak.
Extended Data Fig. 9
Extended Data Fig. 9. Presence of colocalizing association signals for urinary metabolites and phenotypes and diseases in the UK Biobank.
Colocalizing associations (H4≥0.8, Methods) that showed associations at genome-wide significance (P<5e-8) with both metabolites and traits and diseases in the UK Biobank were found between 68 traits and 66 of the index SNPs. The strength of the associations based on their association P values with the UK Biobank trait are indicated by cross or asterisk as described in the legend. The traits are sorted into five groups: blood count-based parameters, anthropometry, lifestyle, medical conditions, and skin color (left to right). SNPs are sorted by gene and within gene by position. Genes where incorporation of existing biochemical and biological knowledge would have led to prioritization of another most likely causal gene are marked with a # (see Supplementary Note).
Fig. 1
Fig. 1. Circular presentation of 240 identified loci associated with metabolite concentrations in urine.
The −log10(P) for genetic association with metabolite concentrations by chromosomal position is shown by the light blue band. Chromosomes are indicated by numbered panels 1–22. Associations of all 1,172 metabolites, shown in dark blue, are overlaid in the light blue band, are based on linear regressions, and association P values are capped at 1×10−60. The red line indicates genome-wide significance (P = 4.3 × 10⁻¹¹). For details about significant association s see Supplementary Table 3. Genetic regions that were identified in previous mGWAS of urine are shown by gene labels in black, genetic regions that were not identified in previous mGWAS of urine are shown by gene labels in blue, and genetic regions that have not yet been identified in any queried mGWAS are shown by gene labels in orange. The presence of significantly associated metabolite ratios in the genetic region are shown by dark red dots in the yellow band. The light green band shows the maximum variance in metabolite levels that was explained by the index SNP of each genetic region using dark green circles; the size of circles reflects different ranges of explained variance. A stacked representation of the number of associated metabolites in each genetic region, colored according to the super-pathways to which they belong, is shown by the inner gray band. Color keys that represent metabolite super-pathways are shown in the middle.
Fig. 2
Fig. 2. Identified genes are enriched for ADME processes, detoxification reactions and small molecule metabolism.
a, Visual illustration of the enrichment of the observed number of unique genes contained in the ADME gene list (dashed vertical line) with the expected number of unique genes based on one hundred million random draws of 90 genes from the 15,231 genes matched for gene length and the number of independent SNPs (histogram, maximum random overlap at 11). b, Identified genes that could be placed into the context of phase I, II or III biotransformation reactions, which are an important part of ADME processes. Color coding shows genes contained in a list of ADME genes with pharmacological relevance (black), a comprehensive manually curated ADME list (orange), and an additional literature research list (green), resulting in a total of 35 genes. c, The plot shows enriched GO terms and KEGG pathways with adjusted empirical P < 0.05 (Methods)for which more than 10% of the genes in the pathway were identified in the mGWAS. Color coding of squares reflects the different GO aspects (BP, biological process; MF, molecular function) or KEGG pathways. The number of overlapping genes and the GO terms abbreviated with an asterisk are given in Supplementary Table 7. Arrows indicate association P values capped at 1×10⁻⁸.
Fig. 3
Fig. 3. Enriched expression of identified genes in human tissues and kidney cell types reflects those related to metabolite absorption, metabolism and excretion in humans.
a, Expression of identified genes in human tissues. b, Expression of identified genes in kidney cell types. The vertical lines in a and b indicate the statistical significance threshold after Bonferroni adjustment; arrows indicate empirical P values <1×10⁻⁸(Methods).The number of overlapping genes is given in Supplementary Table 8. c, Heatmap illustrates the relative expression of each associated gene across kidney cell types; only genes with a z-score of >2 in at least one cell type are plotted. AL, ascending limb; CNT, connecting segment cells; DCT, distal convoluted tubule; DL, descending limb; EC, endothelial cells; IC, intercalated cells; LOH, loop of Henle; PC, principal cells; PT, proximal tubule.
Fig. 4
Fig. 4. Credible set size plotted against variant posterior probability of 3,348 variants in 259 99% credible sets by annotation.
All 3,348 SNPs with a PPA of >1% in 259 99% credible sets are plotted by credible set size against variant PPA and shown as gray dots or purple triangles. For small credible sets see Supplementary Table 10. All exonic variants with a PPA of >50% are annotated with gene and variant consequence, and are marked by purple triangles, with size proportional to their combined annotation-dependent depletion (CADD) score. The connection between the listed genes and at least one of their associated metabolites is supported by biochemical knowledge (CPS1, HDAC10, SLC22A1, SLCO1B1), corresponding monogenic diseases (CPS1, ACADS) and/or prior functional evidence (CPS1, ACADS, HDAC10, SLC22A1). Missense substitutions refer to NP_114106.1 (AGXT2), NP_001306047.1 (DNPEP), NP_001866.2 (CPS1), NP_001599.1 (ACADL), NP_000008.1 (ACADS), NP_114408.3 (HDAC10), NP_003048.1 (SLC22A1), NP_060401.2 (TTC38) and NP_006437.3 (SLCO1B1). The meaning of asterisks in a metabolite’s name is explained in the footnote of Supplementary Table 2.
Fig. 5
Fig. 5. A splice variant in CYP2D6 results in poor metabolization of the commonly prescribed beta-blocker metoprolol.
a, Distribution of the log2 (metoprolol/α-hydroxymetoprolol) concentration by genotype at rs3892097. b, Distribution of heart rate by genotype at rs3892097. In a and b horizontal lines indicate medians and violin plots are clipped to the range. c, Concentration of log2 (metoprolol/α-hydroxymetoprolol) against heart rate. The line corresponds to the linear regression and shading indicates the 95% confidence level. ac are based on the 416 samples with overlapping measures for metoprolol and α-hydroxymetoprolol.
Fig. 6
Fig. 6. Associations between mQTLs and selected phenotypes and diseases in the UK Biobank reveal pathophysiological insights.
For each genetic region with evidence for colocalization (H4 ≥0.8, Methods) of genetic associations with metabolites and a UK Biobank (UKBB) trait (index SNP P < 5×10⁻⁸), the strongest associated mQTL and selected traits are displayed. Color coding illustrates th e direction of association of the index SNP with the listed metabolite and UK Biobank trait. The strength of associations assessed by their P value is marked with symbols as indicated in the key. The traits are sorted into five groups: blood count-based parameters, anthropometry, lifestyle, medical conditions and skin color (left to right, x axis). The left y axis contains information about the index SNP for each association and the most likely causal gene; the right y axis lists the corresponding metabolite, with the total number of associated and colocalizing metabolites in the region provided in parentheses and individual metabolites listed in Supplementary Table 13. Genes for which incorporation of existing biochemical and biological knowledge would have led to prioritization of another most likely causal gene are marked with a # (see Supplementary Note). The meaning of asterisks in a metabolite’s name is explained in the footnote of Supplementary Table 2.

Comment in

References

    1. Caldwell J, Gardner I & Swales N An introduction to drug disposition: the basic principles of absorption, distribution, metabolism, and excretion. Toxicol. Pathol 23, 102–114 (1995). - PubMed
    1. Köttgen A, Raffler J, Sekula P & Kastenmuller G Genome-wide association studies of metabolite concentrations (mGWAS): Relevance for nephrology. Semin. Nephrol 38, 151–174 (2018). - PubMed
    1. Homuth G, Teumer A, Volker U & Nauck M A description of large-scale metabolomics studies: increasing value by combining metabolomics with genome-wide SNP genotyping and transcriptional profiling. J. Endocrinol. 215, 17–28 (2012). - PubMed
    1. Kalim S & Rhee EP An overview of renal metabolomics. Kidney Int. 91, 61–69 (2017). - PMC - PubMed
    1. Nigam SK et al. Handling of drugs, metabolites, and uremic toxins by kidney proximal tubule drug transporters. Clin. J. Am. Soc. Nephrol. 10, 2039–2049 (2015). - PMC - PubMed

Publication types

MeSH terms