

Crizotinib sensitizes the erlotinib resistant HCC827GR5 cell line by influencing lysosomal function
- PMID: 31960422
- PMCID: PMC7540474
- DOI: 10.1002/jcp.29463
Crizotinib sensitizes the erlotinib resistant HCC827GR5 cell line by influencing lysosomal function
Abstract
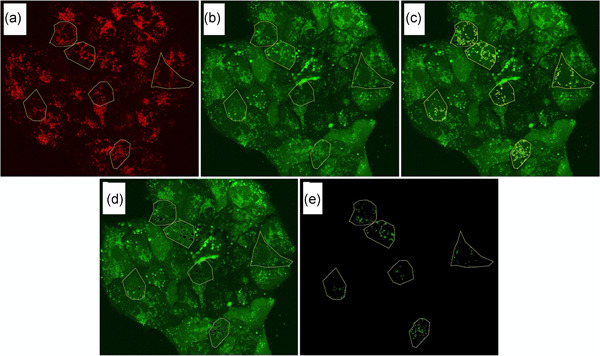
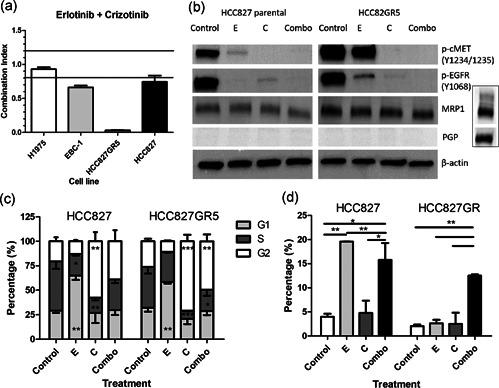
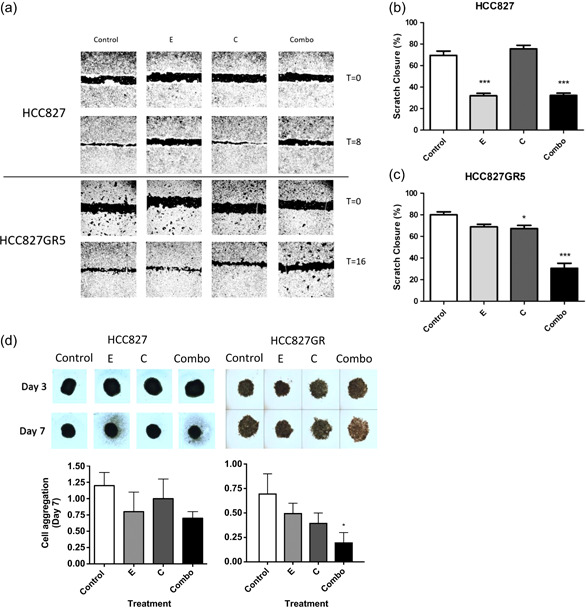
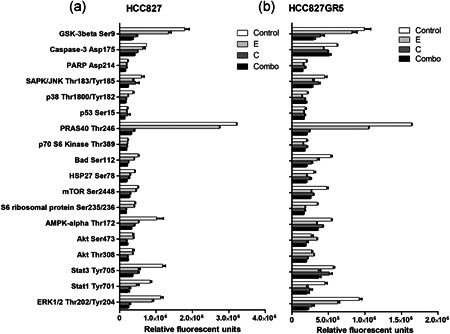
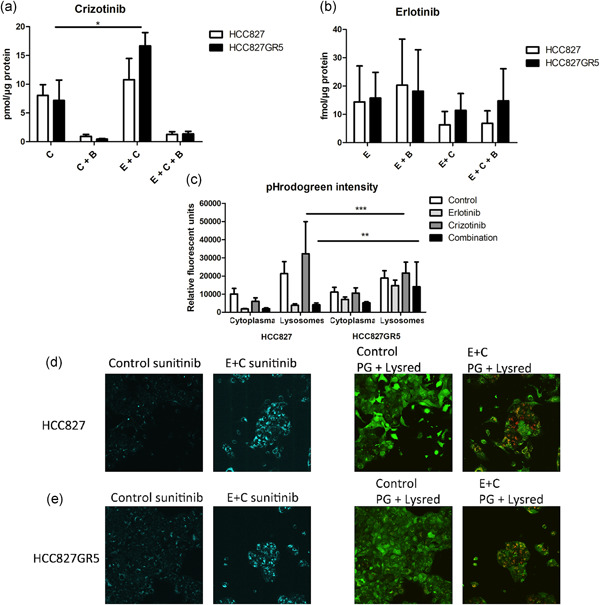
In non-small cell lung cancer, sensitizing mutations in epidermal growth factor receptor (EGFR) or cMET amplification serve as good biomarkers for targeted therapies against EGFR or cMET, respectively. Here we aimed to determine how this different genetic background would affect the interaction between the EGFR-inhibitor erlotinib and the cMET-inhibitor crizotinib. To unravel the mechanism of synergy we investigated the effect of the drugs on various parameters, including cell cycle arrest, migration, protein phosphorylation, kinase activity, the expression of drug efflux pumps, intracellular drug concentrations, and live-cell microscopy. We observed additive effects in EBC-1, H1975, and HCC827, and a strong synergism in the HCC827GR5 cell line. This cell line is a clone of the HCC827 cells that harbor an EGFR exon 19 deletion and has been made resistant to the EGFR-inhibitor gefitinib, resulting in cMET amplification. Remarkably, the intracellular concentration of crizotinib was significantly higher in HCC827GR5 compared to the parental HCC827 cell line. Furthermore, live-cell microscopy with a pH-sensitive probe showed a differential reaction of the pH in the cytoplasm and the lysosomes after drug treatment in the HCC827GR5 in comparison with the HCC827 cells. This change in pH could influence the process of lysosomal sequestration of drugs. These results led us to the conclusion that lysosomal sequestration is involved in the strong synergistic reaction of the HCC827GR5 cell line to crizotinib-erlotinib combination. This finding warrants future clinical studies to evaluate whether genetic background and lysosomal sequestration could guide tailored therapeutic interventions.
Keywords: EGFR; cMET; crizotinib; erlotinib; lysosomes; tyrosine kinase inhibitors.
© 2020 The Authors. Journal of Cellular Physiology published by Wiley Periodicals, Inc.
Figures
Similar articles
-
Met gene amplification and protein hyperactivation is a mechanism of resistance to both first and third generation EGFR inhibitors in lung cancer treatment.Cancer Lett. 2016 Oct 1;380(2):494-504. doi: 10.1016/j.canlet.2016.07.021. Epub 2016 Jul 19. Cancer Lett. 2016. PMID: 27450722
-
Combined therapy with mutant-selective EGFR inhibitor and Met kinase inhibitor for overcoming erlotinib resistance in EGFR-mutant lung cancer.Mol Cancer Ther. 2012 Oct;11(10):2149-57. doi: 10.1158/1535-7163.MCT-12-0195. Epub 2012 Jul 25. Mol Cancer Ther. 2012. PMID: 22844075
-
Decrease in phospho-PRAS40 plays a role in the synergy between erlotinib and crizotinib in an EGFR and cMET wild-type squamous non-small cell lung cancer cell line.Biochem Pharmacol. 2019 Aug;166:128-138. doi: 10.1016/j.bcp.2019.05.014. Epub 2019 May 10. Biochem Pharmacol. 2019. PMID: 31078602
-
Mechanisms of resistance to EGFR tyrosine kinase inhibitors gefitinib/erlotinib and to ALK inhibitor crizotinib.Lung Cancer. 2013 Sep;81(3):328-336. doi: 10.1016/j.lungcan.2013.05.020. Epub 2013 Jun 25. Lung Cancer. 2013. PMID: 23809060 Review.
-
Management and future directions in non-small cell lung cancer with known activating mutations.Am Soc Clin Oncol Educ Book. 2014:e353-65. doi: 10.14694/EdBook_AM.2014.34.e353. Am Soc Clin Oncol Educ Book. 2014. PMID: 24857124 Review.
Cited by
-
Lysosome-mediated chemoresistance in acute myeloid leukemia.Cancer Drug Resist. 2022 Mar 14;5(1):233-244. doi: 10.20517/cdr.2021.122. eCollection 2022. Cancer Drug Resist. 2022. PMID: 35582535 Free PMC article. Review.
-
Epithelial Transfer of the Tyrosine Kinase Inhibitors Erlotinib, Gefitinib, Afatinib, Crizotinib, Sorafenib, Sunitinib, and Dasatinib: Implications for Clinical Resistance.Cancers (Basel). 2020 Nov 10;12(11):3322. doi: 10.3390/cancers12113322. Cancers (Basel). 2020. PMID: 33182766 Free PMC article.
References
-
- Assaraf, Y. G. , Rothem, L. , Hooijberg, J. H. , Stark, M. , Ifergan, I. , Kathmann, I. , … Jansen, G. (2003). Loss of multidrug resistance protein 1 expression and folate efflux activity results in a highly concentrative folate transport in human leukemia cells. Journal of Biological Chemistry, 278(9), 6680–6686. 10.1074/jbc.M209186200 - DOI - PubMed
-
- Bahcall, M. , Sim, T. , Paweletz, C. P. , Patel, J. D. , Alden, R. S. , Kuang, Y. , … Oxnard, G. R. (2016). Acquired MET D1228V mutation and resistance to MET inhibition in lung cancer. Cancer Discovery, 6(12), 1334–1341. 10.1158/2159-8290.CD-16-0686 - DOI - PMC - PubMed
Publication types
MeSH terms
Substances
LinkOut - more resources
Full Text Sources
Research Materials
Miscellaneous
