

Review
doi: 10.1161/JAHA.119.013755.
Epub 2020 Jan 21.
Multimodality Cardiac Imaging in the Era of Emerging Cancer Therapies
Affiliations
- PMID: 31960741
- PMCID: PMC7033826
- DOI: 10.1161/JAHA.119.013755
Item in Clipboard
Review
Multimodality Cardiac Imaging in the Era of Emerging Cancer Therapies
J Am Heart Assoc.
.
No abstract available
Keywords: cancer therapeutics–related cardiac dysfunction; cardiac computed tomography imaging; cardiac magnetic resonance imaging; cardiac positron emission tomography; cardio‐oncology; chimeric antigen receptor T‐cell therapy; immune checkpoint inhibitor.
Figures
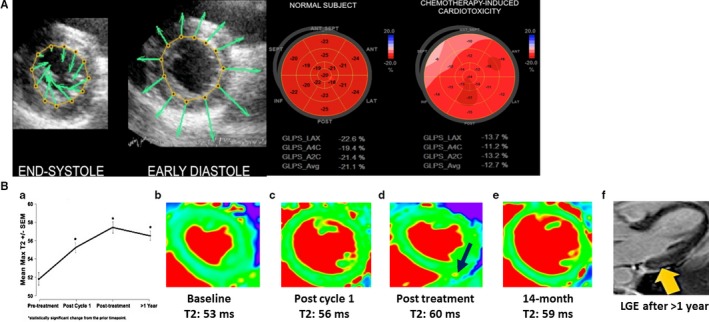
A, (Left) Velocity vector imaging tracking endomyocardial border throughout the cardiac cycle. (Right) Bull's‐eye plot of average peak systolic global longitudinal strain in a normal subject compared with that of a patient with chemotherapy‐induced cardiotoxicity. Adapted from Mele et al17 under the Creative Commons Attribution Non‐Commercial‐NoDerivs (CC ‐BY ‐NC ‐ND ) license. B, Objective increase in myocardial T2 mapping values (a marker of inflammation/edema) after cardiotoxic anthracycline therapy exposure (A through E), even before cardiac fibrosis (F; yellow arrow, LGE ) and clinical heart failure (with left ventricular ejection fraction decline) development among breast cancer patients via use of T2 mapping. Note: maximum T2 plateaus and actually declines after cancer therapy cessation (A, D, and E; black arrow in D, high T2). Adapted with permission from Lustberg et al18 Copyright ©2019, Wolters Kluwer Health, Inc. LGE indicates late gadolinium enhancement.
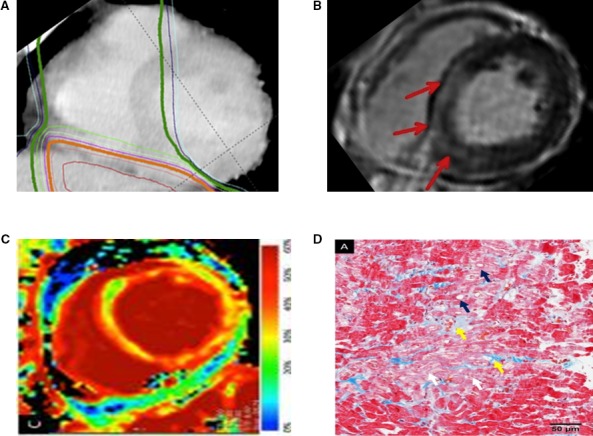
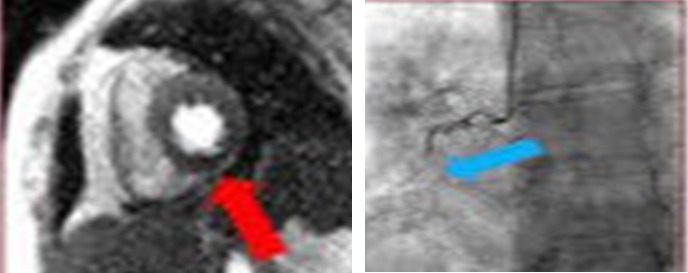
Correlation between radiotherapy (A) and discrete myocardial fibrosis (LGE , red arrows; B). Cardiac magnetic resonance imaging‐detectable diffuse fibrosis (ECV ; C) corresponding to biopsy‐proven fibrosis (D), after esophageal cancer radiotherapy. Specifically, histopathologically, interstitial fibrosis (yellow arrow) and myocardial degeneration such as irregular arrangement (white arrow) or vacuolar changes (blue arrow) are seen. Adapted with permission from Mukai‐Yatagai et al.59 Copyright ©2018, Elsevier. ECV indicates extracellular volume; LGE, late gadolinium enhancement.
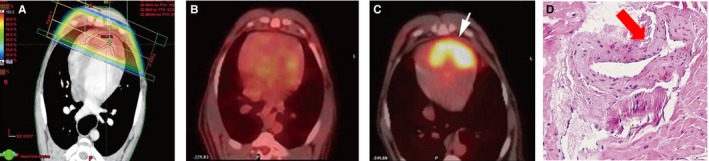
Within the radiation field (A), change in positron emission tomography (PET )‐measured myocardial metabolic activity from before (B) to 3 months after (C, white arrow) radiotherapy treatment, with corresponding fibrosis (D, red arrow) observed on histopathological examination following local heart irradiation in beagles. Echocardiographic parameters remained unchanged. Adapted from Yan et al69 under the Creative Commons Attribution Non‐Commercial (CC ‐BY ‐NC ) License.
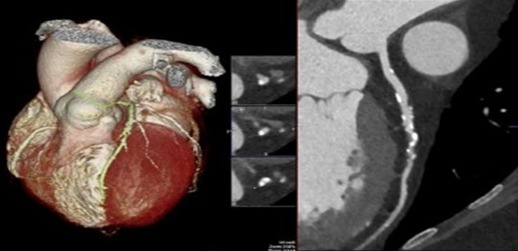
(Left) Cardiac computed tomography (CT ) with 3‐dimensional reconstruction rendering allowing for (right) omniplane visualization of coronary artery plaque and calcification. Adapted with permission from Layoun et al.88 Copyright © 2019, Springer Science Business Media, LLC , part of Springer Nature.
Cardiac magnetic resonance imaging scan of short‐axis plane of left ventricle in a breast cancer survivor showing inferior wall perfusion defect consistent with prior myocardial infarction (left) with corresponding occlusion of the right coronary artery (right). Adapted from Vasu et al93 under the Creative Commons Attribution (CC ‐BY ) license.
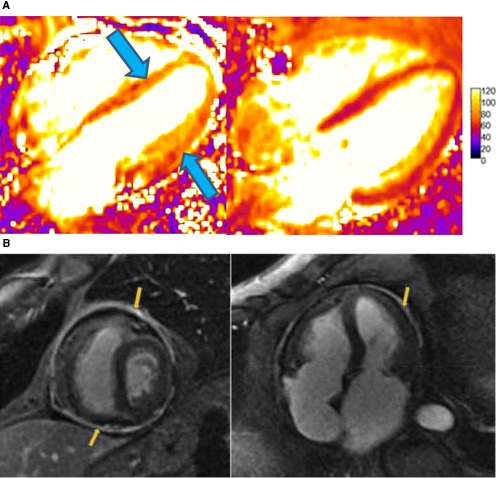
A, (Left) Cardiac MRI T2 maps at diagnosis of myocarditis in a patient treated with pembrolizumab showing global hypokinesis with moderate systolic dysfunction (LVEF , 41%) and diffusely elevated T2 signal (arrows). (Right) T2 maps after withdrawal of pembrolizumab and 1‐month course of prednisone 1 mg/kg with resultant normalized systolic function (LVEF, 59%) and improved T2 signal. B, Cardiac magnetic resonance imaging scan late gadolinium enhancement (LGE ) sequences showing thickened and enhanced pericardium in a patient with constrictive pericarditis following radiation therapy. Adapted with permission from Aldweib et al.123 Copyright © 2018, Eureka Science (FZC ). LVEF, left ventricular ejection fraction.
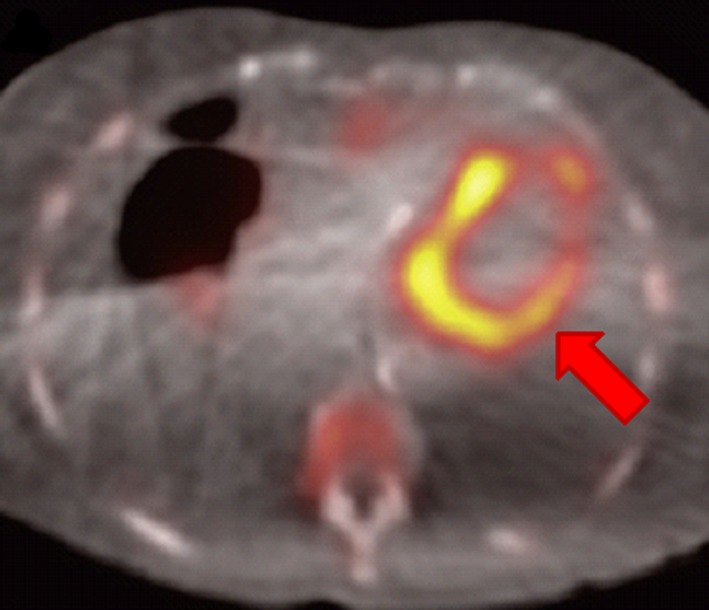
88‐year‐old female with aortic stenosis and amyloid transthyretin cardiac amyloidosis by 99mTc‐3,3‐diphosphono‐1,2‐propanodicarboxylic acid scan; arrow points to regions of increased uptake. Adapted from Scully et al131 under the Creative Commons Attribution (CC ‐BY ) license.
References
-
- Siegel RL, Miller KD, Jemal A. Cancer statistics, 2019. CA Cancer J Clin. 2019;69:7–34. - PubMed
-
- Moslehi JJ. Cardiovascular toxic effects of targeted cancer therapies. N Engl J Med. 2016;375:1457–1467. - PubMed
-
- Strongman H, Gadd S, Matthews A, Mansfield KE, Stanway S, Lyon AR, Dos‐Santos‐Silva I, Smeeth L, Bhaskaran K. Medium and long‐term risks of specific cardiovascular diseases in survivors of 20 adult cancers: a population‐based cohort study using multiple linked UK electronic health records databases. Lancet. 2019;394:1041–1054. - PMC - PubMed
Publication types
MeSH terms
Substances
Grants and funding
LinkOut - more resources
Full Text Sources
Medical
