. 2020 Jan 21;18(1):e3000595.
doi: 10.1371/journal.pbio.3000595. eCollection 2020 Jan.

A role for triglyceride lipase brummer in the regulation of sex differences in Drosophila fat storage and breakdown

Affiliations

A role for triglyceride lipase brummer in the regulation of sex differences in Drosophila fat storage and breakdown

Lianna W Wat et al. PLoS Biol. .

Abstract

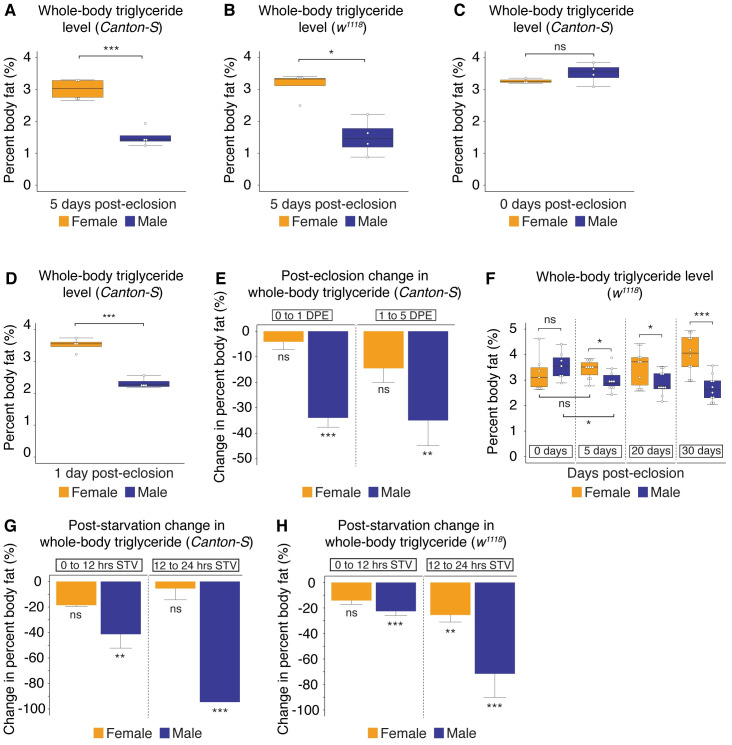
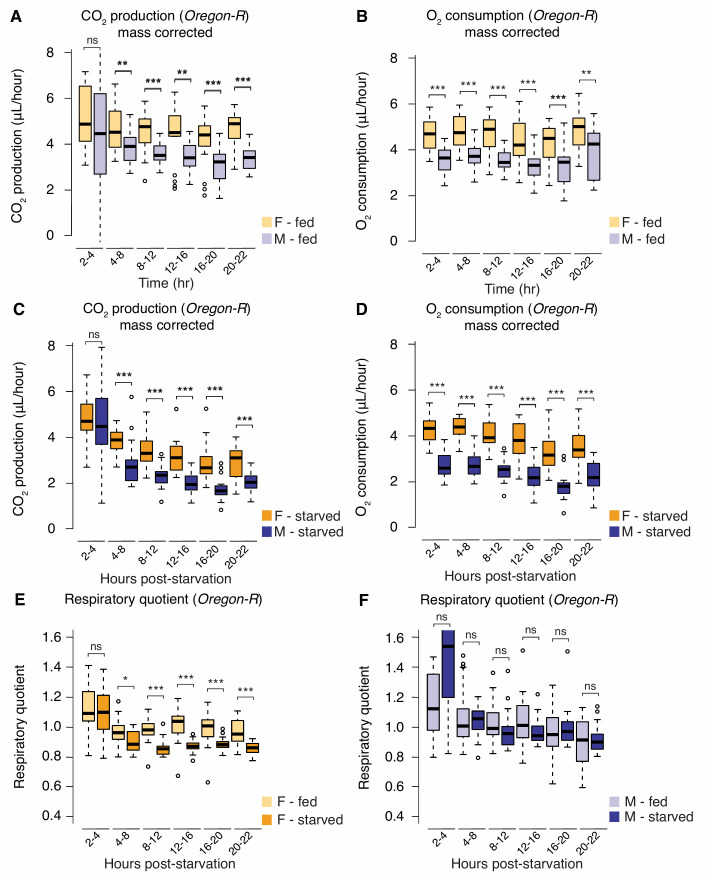
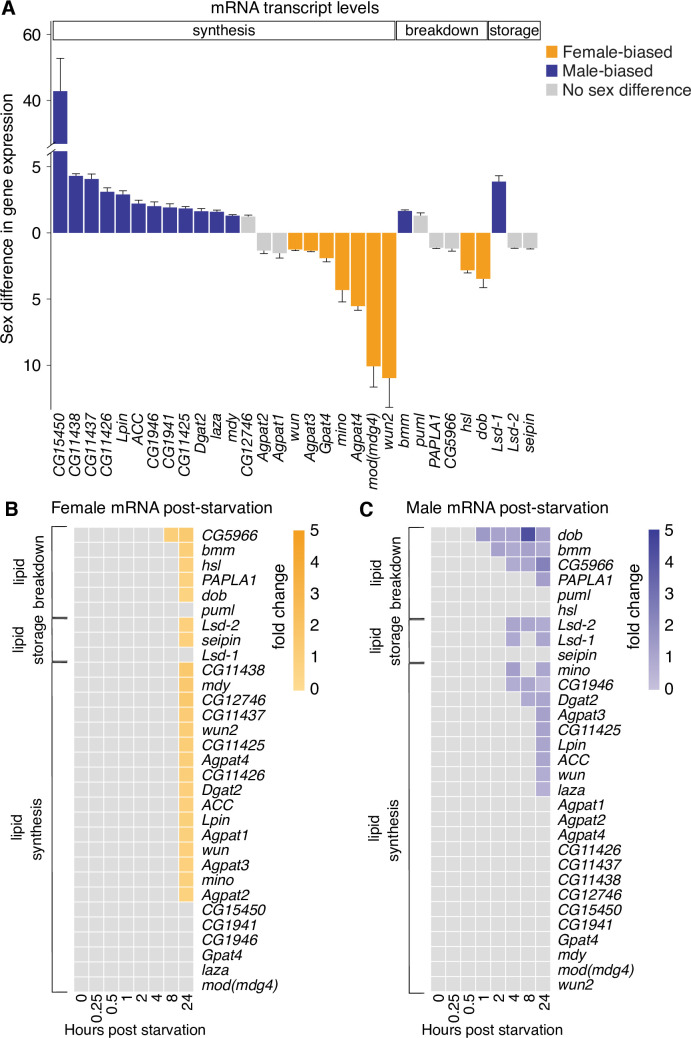
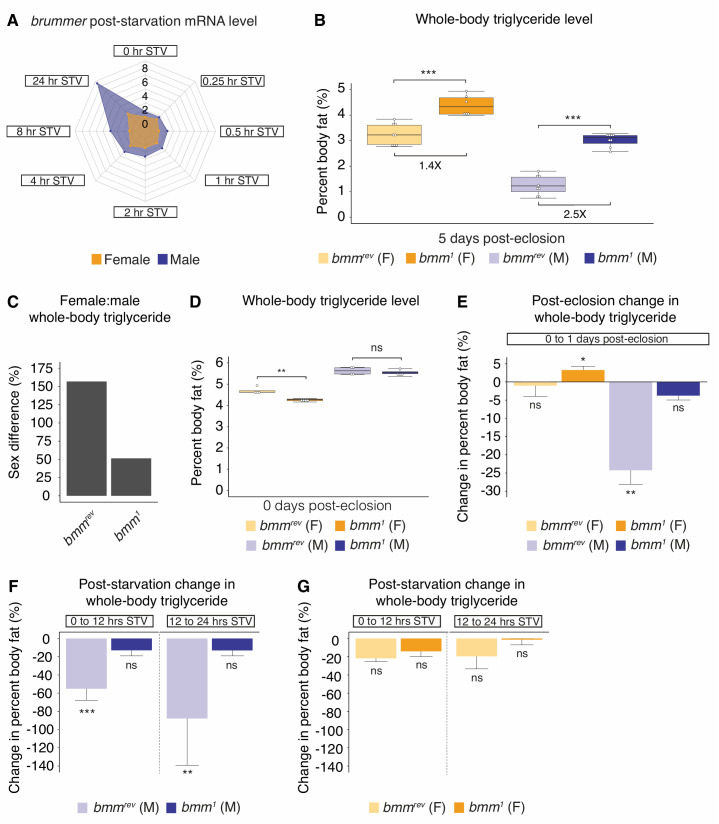
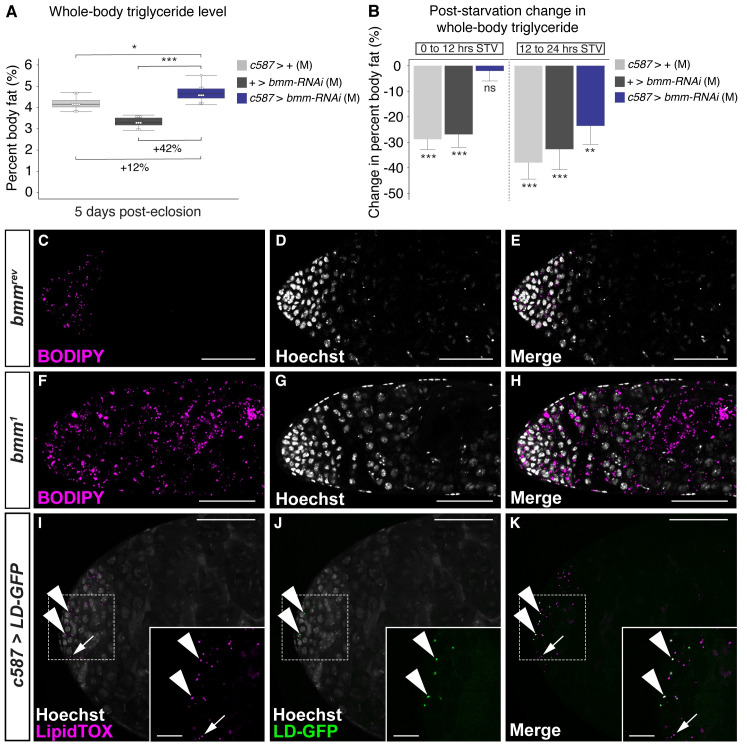
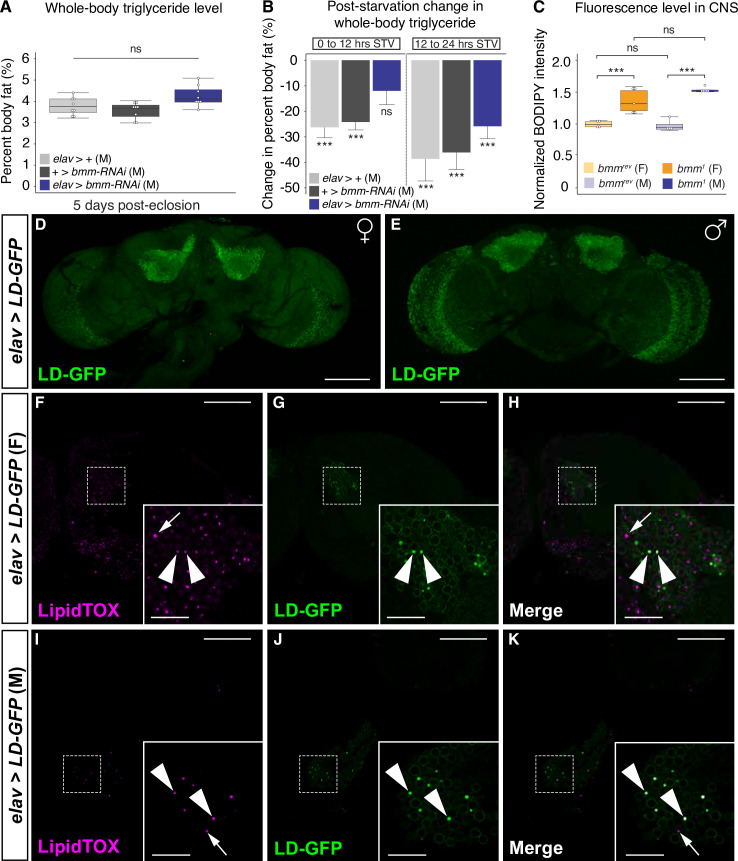
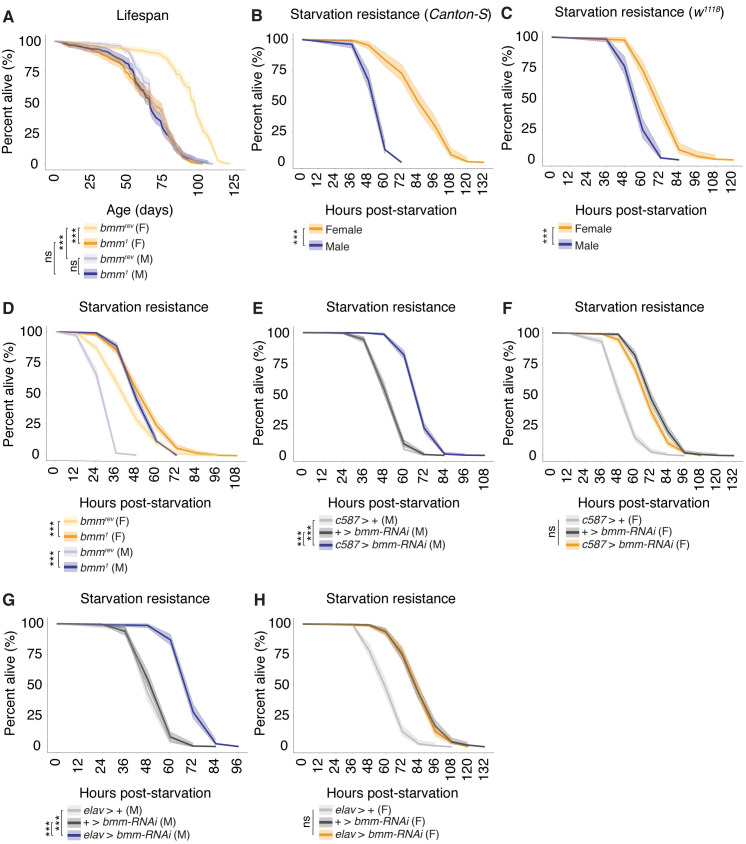
Triglycerides are the major form of stored fat in all animals. One important determinant of whole-body fat storage is whether an animal is male or female. Here, we use Drosophila, an established model for studies on triglyceride metabolism, to gain insight into the genes and physiological mechanisms that contribute to sex differences in fat storage. Our analysis of triglyceride storage and breakdown in both sexes identified a role for triglyceride lipase brummer (bmm) in the regulation of sex differences in triglyceride homeostasis. Normally, male flies have higher levels of bmm mRNA both under normal culture conditions and in response to starvation, a lipolytic stimulus. We find that loss of bmm largely eliminates the sex difference in triglyceride storage and abolishes the sex difference in triglyceride breakdown via strongly male-biased effects. Although we show that bmm function in the fat body affects whole-body triglyceride levels in both sexes, in males, we identify an additional role for bmm function in the somatic cells of the gonad and in neurons in the regulation of whole-body triglyceride homeostasis. Furthermore, we demonstrate that lipid droplets are normally present in both the somatic cells of the male gonad and in neurons, revealing a previously unrecognized role for bmm function, and possibly lipid droplets, in these cell types in the regulation of whole-body triglyceride homeostasis. Taken together, our data reveal a role for bmm function in the somatic cells of the gonad and in neurons in the regulation of male-female differences in fat storage and breakdown and identify bmm as a link between the regulation of triglyceride homeostasis and biological sex.


Conflict of interest statement

The authors have declared that no competing interests exist.

Figures

Fig 1
Fig 1. Sexual dimorphism in Drosophila triglyceride storage and breakdown.
(A) Whole-body triglyceride storage in 5-day-old Canton-S virgin females was significantly higher than in age-matched Canton-S virgin male flies (p = 5.4 × 10⁻⁴; Student t test). (B) Whole-body triglyceride storage in 5-day-old w1118 virgin female flies was significantly higher than in age-matched w1118 virgin male flies (p = 2.3 × 10⁻²; Student t test). (C) No significant difference in whole-body triglyceride storage was found between newly eclosed virgin Canton-S females and age-matched virgin males (p = 0.73; Student t test). (D) Whole-body triglyceride storage in 1-day-old Canton-S virgin females was significantly higher than in age-matched virgin males (p = 1.2 × 10⁻⁴; Student t test). (E) In females, whole-body triglyceride levels were not significantly different between newly eclosed flies and flies collected at 1 DPE or between flies collected at 1 DPE and 5 DPE (p = 0.91 and 0.38, respectively; one-way ANOVA followed by Tukey HSD test). In males, whole-body triglyceride storage was significantly lower at 1 DPE than in newly eclosed flies, with a further reduction in triglyceride storage between 1 DPE and 5 DPE (p = 4.2 × 10⁻⁴ and 5.7 × 10⁻³, respectively; one-way ANOVA followed by Tukey HSD test). (F) Whole-body triglyceride storage in w1118 virgin females was not significantly higher than males at eclosion, but it was significantly higher by 5 DPE, a sex difference that was maintained in 20- and 30-day-old males and females (p = 0.38, 0.024, 0.029, 1.5 × 10⁻⁴, respectively; Student t test at each time point). (G) In 5-day-old Canton-S virgin females, there was no significant difference in whole-body triglyceride levels between 0 and 12 hours STV or between 12 and 24 hours STV (p = 0.097, 0.92, respectively; one-way ANOVA followed by Tukey HSD test). In males, there was a significant decrease in whole-body triglyceride storage between 0 and 12 hours STV and a further decrease in triglyceride levels between 12 and 24 hours STV (p = 2.2 × 10⁻³, 1.7 × 10⁻⁴, respectively; one-way ANOVA followed by Tukey HSD test). (H) In 5-day-old w1118 virgin females, there was no significant difference in whole-body triglyceride levels between 0 and 12 hours STV and a modest difference between 12 and 24 hours STV (p = 0.11, 2.2 × 10⁻³, respectively; one-way ANOVA followed by Tukey HSD test). In 5-day-old w1118 virgin males, we observed a significant decrease in triglyceride levels between 0 and 12 hours STV and a further decrease between 12 and 24 hours STV (p = 3.0 × 10⁻⁵, 0.0, respectively; one-way ANOVA followed by Tukey HSD test). Asterisks indicate a significant difference between two sexes, two genotypes, or two time points (*p < 0.05, **p < 0.01, ***p < 0.001). Error bars on graphs depicting percent body fat represent SEM; error bars on graphs depicting the change in percent body fat represent COE. See S1 Table for all multiple comparisons and p-values; quantitative measurements underlying all graphs are available in S1 Data. COE, coefficient of error; DPE, days post-eclosion; HSD, honest significant difference; ns, no significant difference between two sexes, two genotypes, or time points; STV, post-starvation; w, white.
Fig 2
Fig 2. Sex differences in metabolic rate and macronutrient utilization.
(A) Mass-corrected CO2 production was significantly higher in fed Oregon-R virgin females than in virgin males for most intervals during the observation period (p = 0.18, 4.5 × 10⁻³, 5.2 × 10⁻⁵, 4.9 × 10⁻³, 6.6 × 10⁻⁴, 2.43 × 10⁻⁷, respectively; Student t test at each time point). (B) Mass-corrected O2 consumption was significantly higher at each interval in fed Oregon-R females than in males during the observation period (p = 9.8 × 10⁻⁶, 1.8 × 10⁻⁶, 2.2 × 10⁻⁶, 5.2 × 10⁻⁴, 7.9 × 10⁻⁴, 4.3 × 10⁻³, respectively; Student t test at each time point). (C) Mass-corrected CO2 production post-starvation was significantly higher in females than in males for most intervals during the observation period (p = 0.55, 3.5 × 10⁻⁴, 6.4 × 10⁻⁷, 2.7 × 10⁻⁶, 8.0 × 10⁻⁶, 5.9 × 10⁻⁵, respectively; Student t test at each time interval). (D) Mass-corrected O2 consumption post-starvation was significantly higher in females at all intervals during the observation period (p = 2.4 × 10⁻¹⁰, 3.4 × 10⁻¹¹, 1.4 × 10⁻¹⁰, 1.9 × 10⁻⁸, 1.1 × 10⁻⁷, 2.5 × 10⁻⁶, respectively; Student t test at each time interval). (E) The RQ was calculated as the ratio between CO2 production to O2 consumption at defined intervals over a 24-hour observation period in 5-day-old Oregon-R virgin females and males that were placed on either standard media or starvation media. In starved females, we observed a significant reduction in RQ compared with control females on standard media from 4 to 8 hours post-starvation onward (p = 0.85, 0.014, 6.5 × 10⁻⁶, 1.3 × 10⁻⁵, 8 × 10⁻⁴, 2.2 × 10⁻⁵, respectively; Student t test at each time point). (F) In male flies, we observed no significant change in RQ compared with control males on standard medium at any time during the observation period (p = 0.066, 0.89, 0.24, 0.079, 0.39, 0.62, respectively; Student t test at each time point). For indirect calorimetry measurements, the p-values are listed in the following order: difference between fed and starved animals at 2–4 hours, 4–8 hours, 8–12 hours, 12–16 hours, 16–20 hours, and 20–22 hours. Asterisks indicate a significant difference between two sexes, two genotypes, or two time points (*p < 0.05, **p < 0.01, ***p < 0.001). Error bars on graphs represent SEM. Quantitative measurements underlying all graphs are available in S2 Data. F, female; M, male; ns, no significant difference between two sexes, two genotypes, or time points; RQ, respiratory quotient.
Fig 3
Fig 3. Extensive sex-biased expression of genes involved in maintaining triglyceride homeostasis.
(A) Sex-biased mRNA levels of a panel of 31 genes known or predicted to be involved in triglyceride metabolism in 5-day-old virgin w1118 females and males. Gray-colored bars indicate no significant difference in mRNA level between the sexes. Orange-colored bars indicate that mRNA levels are significantly higher in virgin females than in virgin males. Purple-colored bars indicate that mRNA levels are significantly higher in virgin males than in virgin females. (B, C) mRNA levels of a panel of genes involved in triglyceride metabolism in virgin 5-day-old female w1118 flies (B) and virgin 5-day-old male w1118 flies (C) measured at different times post-starvation. Gray boxes indicate that mRNA levels were not significantly different from sex-matched, fed controls; colored boxes indicate that mRNA levels were significantly different from age-matched fed flies, and the intensity of the color corresponds to the fold change in mRNA level (refer to legend). Error bars on graphs represent SEM. See S1 Table for a list of all multiple comparisons and p-values; quantitative measurements underlying gene expression data are available in S3 Data. w, white.
Fig 4
Fig 4. A role for bmm in the regulation of sex differences in triglyceride homeostasis.
(A) Radar plot showing sex-specific regulation of bmm mRNA levels STV in 5-day-old virgin w1118 females and males STV. bmm mRNA levels were 1.8-fold higher in 5-day-old fed virgin males than in age-matched virgin females (p = 0.016; Student t test). At 4 hours STV, bmm mRNA levels were 1.6-fold higher in males than females (p = 0.019; Student t test). By 8 hours STV, mRNA levels were 3.1-fold higher in males than females (p = 8.6 × 10⁻⁴; Student t test). (B) Whole-body triglyceride storage was significantly higher in 5-day-old bmm1 homozygous mutant males compared with bmmrev control males (p = 0; one-way ANOVA followed by Tukey HSD). Whole-body triglyceride storage was significantly increased in bmm1 homozygous mutant females compared with bmmrev female controls (p = 1.9 × 10⁻⁶; one-way ANOVA followed by Tukey HSD). (C) The male-biased effect of bmm loss on triglyceride storage reduced the sexual dimorphism in triglyceride storage. (D) Whole-body triglyceride storage at eclosion was not significantly different between bmm1 mutant males compared with bmmrev control males (p = 0.84; Student t test). (E) Triglyceride levels were lower in 1-day-old bmmrev males compared with newly eclosed bmmrev males (p = 0.0013; Student t test); however, there was no significant difference in whole-body triglyceride levels between 1-day-old bmm1 males and newly eclosed bmm1 males (p = 0.0793; Student t test). (F) In 5-day-old bmmrev males, whole-body triglyceride storage significantly decreased between 0 and 12 hours STV, with a further reduction between 12 and 24 hours STV (p = 6.2 × 10⁻⁵ and 2.4 × 10⁻³, respectively; one-way ANOVA followed by Tukey HSD test). No significant change in whole-body triglyceride levels was observed in bmm1 mutant males between 0 and 12 hours STV, or between 12 and 24 hours STV (p = 0.244 and 0.349, respectively; one-way ANOVA followed by Tukey HSD test). (G) There was no significant change in whole-body triglyceride levels in either bmmrev females or bmm1 females between 0 and 12 hours STV or between 12 and 24 hours STV (p = 0.0503 and 0.171 [0–12 hours], 0.244 and 0.998 [12–24 hours], respectively; one-way ANOVA followed by Tukey HSD test). Asterisks indicate a significant difference between two sexes, two genotypes, or two time points (*p < 0.05, **p < 0.01, ***p < 0.001). Error bars on graphs depicting percent body fat represent SEM; error bars on graphs depicting the change in percent body fat represent COE. See S1 Table for a list of all multiple comparisons and p-values; quantitative measurements for all data presented are available in S1 and S3 Datas. bmm, brummer; COE, coefficient of error; F, female; HSD, honest significant difference; M, male; ns, no significant difference between two sexes, two genotypes, or time points; STV, post-starvation; w, white.
Fig 5
Fig 5. A role for bmm function in the somatic cells of the gonad in the regulation of whole-body triglyceride storage and breakdown in males.
(A) Whole-body triglyceride storage in males overexpressing the UAS-bmm-RNAi transgene in the somatic cells of the male gonad (c587>UAS-bmm-RNAi) was significantly higher than in control males (c587>+ and +>UAS-bmm-RNAi) (p = 0.027 and 2 × 10⁻⁷, respectively; one-way ANOVA followed by Tukey HSD test). (B) Whole-body triglyceride levels in c587>+ and +>UAS-bmm-RNAi control males showed a significant decrease between 0 and 12 hours STV (1 × 10⁻⁷ and 1.1 × 10⁻⁶, respectively; one-way ANOVA followed by Tukey HSD test), whereas triglyceride levels were not significantly different between 0 and 12 hours STV in c587>UAS-bmm-RNAi males (p = 0.997; one-way ANOVA followed by Tukey HSD test). (C–H) We detected lipid droplets in testes dissected from 0-day-old bmm1 and bmmrev virgin male flies using BODIPY, a neutral lipid stain. Dissected testis from 0-day-old virgin bmm1 mutant males (F–H) show a dramatic increase in lipid droplets compared with control bmmrev males (C–E). (I–K) Using an LD-GFP, we found that a subset of the LipidTOX-positive lipid droplets in the testis (arrowheads) represent droplets in the somatic cells of the gonad. Non-GFP-positive droplets (arrow) likely represent lipid droplets in the germline, another cell type in the testis. Scale bars = 50 μm, except for inset images for (I–K), in which scale bars = 12.5 μm. The p-values are listed in the following order: difference between the GAL4/UAS genotype and the GAL4 control/difference between the GAL4/UAS genotype and the UAS control. Asterisks indicate a significant difference between two sexes, two genotypes, or two time points (*p < 0.05, **p < 0.01, ***p < 0.001). Error bars on graphs depicting percent body fat represent SEM; error bars on graphs depicting the change in percent body fat represent COE. See S1 Table for a list of all multiple comparisons and p-values; quantitative measurements underlying data presented in the figure are available in S1 Data. Original image files corresponding to all images acquired from genotype-matched individuals presented in panels C–K are available upon request. bmm, brummer; BODIPY, boron-dipyrromethene; COE, coefficient of error; GFP, green fluorescent protein; HSD, honest significant difference; LD-GFP, lipid droplet–targeted GFP; M, male; ns indicates no significant difference between two sexes, two genotypes, or time points; STV, post-starvation; UAS, upstream activation sequence.
Fig 6
Fig 6. A role for bmm function in neurons in the regulation of whole-body triglyceride breakdown in males.
(A) Whole-body triglyceride storage in 5-day-old virgin males overexpressing UAS-bmm-RNAi in postmitotic neurons (elav>UAS-bmm-RNAi) was not significantly different from age-matched control males (elav>+ and +>UAS-bmm-RNAi) (p = 0.095 and 0.011; one-way ANOVA followed by Tukey HSD test). (B) There was a significant reduction in whole-body triglyceride levels in 5-day-old elav>+ and +>UAS-bmm-RNAi control males between 0 and 12 hours STV (p = 1 × 10⁻⁵ and 9 × 10⁻⁶, respectively; one-way ANOVA followed by Tukey HSD test); however, no significant decrease in triglyceride levels was observed between 0 and 12 hours STV in elav>UAS-bmm-RNAi males (p = 0.13; one-way ANOVA followed by Tukey HSD test). (C) In both sexes, lipid droplet–derived fluorescence in dissected Drosophila brains was significantly higher in 5-day-old bmm1 mutants compared with bmmrev controls (p = 2.5 × 10⁻⁵ and 0.002 in males and females, respectively; one-way ANOVA followed by Tukey HSD). (D, E) Expression of an LD-GFP transgene in neurons revealed GFP-positive punctae throughout the Drosophila CNS in females (D) and males (E). Maximum Z-projections, dorsal view, anterior up. Scale bars = 100 μm. (F–K) Expression of LD-GFP in neurons revealed that a subset of the LipidTOX-positive lipid droplets found in the CNS of 5-day-old adult females (F–H) and males (I–K) represent droplets in neurons (arrowheads). (F–K) Non-GFP-positive droplets likely represent lipid droplets in glia, another cell type in the CNS (arrow). White boxes indicate area magnified in inset. Single confocal slice through the Drosophila brain, dorsal view, anterior up. Scale bars = 50 μm; scale bars = 12.5 μm in magnified inset images. The p-values are listed in the following order: difference between the GAL4/UAS genotype and the GAL4 control/difference between the GAL4/UAS genotype and the UAS control. Asterisks indicate a significant difference between two sexes, two genotypes, or two time points (*p < 0.05, **p < 0.01, ***p < 0.001). Error bars on graphs depicting percent body fat or BODIPY intensity represent SEM; error bars on graphs depicting the change in percent body fat represent COE. See S1 Table for a list of all multiple comparisons and p-values; quantitative measurements for all data are available in S1 Data. Original image files corresponding to all images acquired from genotype-matched individuals presented in panels D–K are available upon request. bmm, brummer; BODIPY, boron-dipyrromethene; CNS, central nervous system; COE, coefficient of error; elav, embryonic lethal abnormal vision; F, female; GFP, green fluorescent protein; HSD, honest significant difference; LD-GFP, lipid droplet–targeted GFP; M, male; ns, no significant difference between two sexes, two genotypes, or time points; STV, post-starvation; UAS, upstream activation sequence.
Fig 7
Fig 7. bmm-mediated regulation of triglyceride homeostasis affects life span and contributes to the sex difference in starvation resistance.
(A) Median life span was significantly higher in bmmrev virgin females than in bmmrev virgin males (p = 2 × 10⁻¹⁶; Log-rank test with Bonferroni correction for multiple comparisons; n > 297 for all sexes and genotypes). Median life span was significantly reduced in bmm1 mutant females compared with bmmrev control females (28-day reduction in survival, p = 2 × 10⁻¹⁶; Log-rank test with Bonferroni correction for multiple comparisons). No significant decrease was found in bmm1 mutant males compared with control males (p = 0.17; Log-rank test with Bonferroni correction for multiple comparisons). (B) Median survival post-starvation was significantly higher in 5-day-old virgin Canton-S females than in virgin Canton-S males (p = 2 × 10⁻¹⁶; Log-rank test with Bonferroni correction for multiple comparison; n > 154). (C) Median survival post-starvation was significantly higher in 5-day-old w1118 virgin females compared with w1118 virgin males (p = 2 × 10⁻¹⁶; Log-rank test with Bonferroni correction for multiple comparisons; n > 123). (D) Median survival post-starvation was significantly higher in 5-day-old bmmrev virgin females than in bmmrev virgin males (p = 2 × 10⁻¹⁶; Log-rank test with Bonferroni correction for multiple comparisons; n > 454 for both sexes and genotypes). Median survival post-starvation was significantly increased in male bmm1 mutants compared with bmmrev control males (p = 2 × 10⁻¹⁶; Log-rank test with Bonferroni correction for multiple comparisons) and in bmm1 mutant females compared with bmmrev controls (p = 2 × 10⁻¹⁶; Log-rank test with Bonferroni correction for multiple comparisons). The male-biased effects of bmm loss on starvation resistance reduced the sex difference in median survival. (E) Median survival was significantly higher in virgin males with bmm inhibition in somatic cells of the male gonad (c587>UAS-bmm-RNAi) compared with control males (c587>+ and +>UAS-bmm-RNAi) (p = 2 × 10⁻¹⁶ and 2 × 10⁻¹⁶, respectively; Log-rank test with Bonferroni correction for multiple comparisons; n > 326 for all genotypes). (F) Median survival post-starvation was not significantly different in c587>UAS-bmm-RNAi virgin females compared with c587>+ and +>UAS-bmm-RNAi control females (p = 2 × 10⁻¹⁶ and 1.5 × 10⁻⁵, respectively; Log-rank test with Bonferroni correction for multiple comparisons; n > 408 for all genotypes). (G) Median survival post-starvation was significantly higher in virgin males with bmm inhibition in postmitotic neurons (elav>UAS-bmm-RNAi) compared with elav>+ and +>UAS-bmm-RNAi control males (p = 2 × 10⁻¹⁶ and 2 × 10⁻¹⁶, respectively; Log-rank test with Bonferroni correction for multiple comparisons; n > 178 for all genotypes). (H) Median survival post-starvation was not significantly higher in elav>UAS-bmm-RNAi virgin females compared with elav>+ and +>UAS-bmm-RNAi control females (p = 2 × 10⁻¹⁶ and 1, respectively; Log-rank test with Bonferroni correction for multiple comparisons; n > 253 for all genotypes). The male-specific effects of bmm inhibition in neurons reduced the sex difference in median survival. The p-values are listed in the following order: difference between the GAL4/UAS genotype and the GAL4 control/difference between the GAL4/UAS genotype and the UAS control. Asterisks indicate a significant difference between two sexes, two genotypes, or two time points (*p < 0.05, **p < 0.01, ***p < 0.001). Shaded areas represent the 95% confidence interval. See S1 Table for a list of all multiple comparisons and p-values; quantitative measurements corresponding to all data presented in the figure are available in S4 Data. bmm, brummer; elav, embryonic lethal abnormal vision; F, female; M, male; ns, no significant difference between two sexes, two genotypes, or time points; UAS, upstream activation sequence; w, white.

Similar articles

Cited by

References

    1. Murphy DJ. The biogenesis and functions of lipid bodies in animals, plants and microorganisms. Progress in lipid research. 2001;40(5):325–438. 10.1016/s0163-7827(01)00013-3 - DOI - PubMed
    1. Thiele C, Spandl J. Cell biology of lipid droplets. Current opinion in cell biology. 2008;20(4):378–85. 10.1016/j.ceb.2008.05.009 - DOI - PubMed
    1. Walther TC, Farese RV Jr. Lipid droplets and cellular lipid metabolism. Annual review of biochemistry. 2012;81:687–714. 10.1146/annurev-biochem-061009-102430 - DOI - PMC - PubMed
    1. Kuhnlein RP. Thematic review series: Lipid droplet synthesis and metabolism: from yeast to man. Lipid droplet-based storage fat metabolism in Drosophila. J Lipid Res. 2012;53(8):1430–6. 10.1194/jlr.R024299 - DOI - PMC - PubMed
    1. Walther TC, Chung J, Farese RV Jr. Lipid Droplet Biogenesis. Annu Rev Cell Dev Biol. 2017;33:491–510. 10.1146/annurev-cellbio-100616-060608 - DOI - PMC - PubMed

Publication types

LinkOut - more resources