. 2020 Jan 17;21(2):612.
doi: 10.3390/ijms21020612.

Glioblastoma Exhibits Inter-Individual Heterogeneity of TSPO and LAT1 Expression in Neoplastic and Parenchymal Cells

Affiliations

Glioblastoma Exhibits Inter-Individual Heterogeneity of TSPO and LAT1 Expression in Neoplastic and Parenchymal Cells

Linzhi Cai et al. Int J Mol Sci. .

Abstract

Molecular imaging is essential for diagnosis and treatment planning for glioblastoma patients. Positron emission tomography (PET) with tracers for the detection of the solute carrier family 7 member 5 (SLC7A5; also known as the amino acid transporter light chain L system, LAT1) and for the mitochondrial translocator protein (TSPO) is successfully used to provide additional information on tumor volume and prognosis. The current approaches for TSPO-PET and the visualization of tracer ([18F] Fluoroethyltyrosine, FET) uptake by LAT1 (FET-PET) do not yet exploit the full diagnostic potential of these molecular imaging techniques. Therefore, we investigated the expression of TSPO and LAT1 in patient glioblastoma (GBM) samples, as well as in various GBM mouse models representing patient GBMs of different genetic subtypes. By immunohistochemistry, we found that TSPO and LAT1 are upregulated in human GBM samples compared to normal brain tissue. Next, we orthotopically implanted patient-derived GBM cells, as well as genetically engineered murine GBM cells, representing different genetic subtypes of the disease. To determine TSPO and LAT1 expression, we performed immunofluorescence staining. We found that both TSPO and LAT1 expression was increased in tumor regions of the implanted human or murine GBM cells when compared to the neighboring mouse brain tissue. While LAT1 was largely restricted to tumor cells, we found that TSPO was also expressed by microglia, tumor-associated macrophages, endothelial cells, and pericytes. The Cancer Genome Atlas (TCGA)-data analysis corroborates the upregulation of TSPO in a bigger cohort of GBM patient samples compared to tumor-free brain tissue. In addition, AIF1 (the gene encoding for the myeloid cell marker Iba1) was also upregulated in GBM compared to the control. Interestingly, TSPO, as well as AIF1, showed significantly different expression levels depending on the GBM genetic subtype, with the highest expression being exhibited in the mesenchymal subtype. High TSPO and AIF1 expression also correlated with a significant decrease in patient survival compared to low expression. In line with this finding, the expression levels for TSPO and AIF1 were also significantly higher in (isocitrate-dehydrogenase wild-type) IDHWT compared to IDH mutant (IDHMUT) GBM. LAT1 expression, on the other hand, was not different among the individual GBM subtypes. Therefore, we could conclude that FET- and TSPO-PET confer different information on pathological features based on different genetic GBM subtypes and may thus help in planning individualized strategies for brain tumor therapy in the future. A combination of TSPO-PET and FET-PET could be a promising way to visualize tumor-associated myeloid cells and select patients for treatment strategies targeting the myeloid compartment.

Keywords: Iba1; LAT1; PBR; SLC7A5; TSPO; glioblastoma.


Conflict of interest statement

The authors declare no conflicts of interest.

Figures

Figure 1
Figure 1
Mitochondrial translocator protein (TSPO) expression is increased in human glioblastoma compared to tumor-free brain tissue. (A) Immunohistochemistry of epilepsy (n = 4) and glioblastoma (GBM) patient samples (n = 4) was performed. Scale size is indicated in individual micrographs. (B) Number of TSPO-positive cells per field of view under a 20× objective was counted in all immunostained samples. In human GBM, significantly more cells were TSPO-positive compared to a tumor-free brain. Statistical significance (t-test) is indicated. **** p < 0.0001.
Figure 2
Figure 2
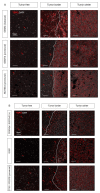
TSPO is expressed in mouse models of different GBM subtypes; (A) Human GBM stem-like cells (GSCs) were orthotopically xenografted in immunodeficient mice. Immunofluorescent staining against TSPO (red) and nuclear counterstaining for DAPI (gray) shows a high level of expression in classical (GBM2) and proneural (GBM14 and NCH644) human GBM subtypes. (B) TSPO immunofluorescent staining (red) and nuclear counterstaining (gray) of murine Gl261 and the classical (cdkn2aKOEGFRvIII) and proneural (p53KOPDGFB) murine GBMs. (A,B) Scale size is indicated in individual micrographs. A representative image from a cohort of five mice per experimental group is shown.
Figure 3
Figure 3
TSPO is expressed in tumor endothelia, pericytes, and myeloid cells. (A) Gl261 tumors grown for 3 weeks were co-stained by immunofluorescence for-anti-TSPO- (red), anti-CD31- (green), and anti-PDGFRB-antibodies (cyan) showing TSPO expression (red) in endothelia (green) and pericytes (cyan). (B) From Gl261 implants of PDGFRB::CreERT2,R26-tdTomato (red), mice immunofluorescent co-staining was performed using anti-CD31 (cyan) and TSPO (green), demonstrating the co-expression of TSPO in tdTomato-expressing pericytes (red). (C) Fluorescence staining with anti-Iba1 (green) and anti-TSPO (red) antibodies shows co-expression in tumor-associated myeloid cells. (D) TSPO immunofluorescence in the GL261 implant in CX3CR1-GFP mice confirms the co-expression of TSPO (red) in GFP (green)-positive microglia. (AD) DAPI nuclear counterstaining is shown in gray; scale-size is indicated in the individual micrographs.
Figure 4
Figure 4
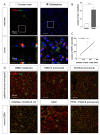
Microglia express TSPO, independent of the genetic GBM subtype. (A) Immunofluorescence staining of epilepsy and GBM patients. Co-staining for Iba1 (green) and TSPO (red) indicated the co-expression of both proteins in cells (zoom). (B) The number of Iba1-positive cells per field of view at 20x was counted. In the tumor area, significantly more Iba1-positive microglia could be found. The p-value of Student’s t test is indicated as **** p < 0.0001. (C) Immunohistochemical analysis of human GBM samples was performed and the number of positive cells was determined. A strong positive correlation between the amount of Iba1-positive cells and TSPO-positive cells was observed (n = 8). (D) Immunofluorescent staining of patient-derived xenografts (PDX) and orthotopic murine GBM implants was performed using anti-Iba1 (green) and anti-TSPO antibodies (red). In all models, TSPO-positive (red) and myeloid (green) cells were detected (arrows). (A,D) Scale size is indicated in individual micrographs.
Figure 5
Figure 5
Amino acid transporter light chain L system (LAT1) expression is increased in human and murine GBM. (A) Immunohistochemistry of epilepsy (n = 4) and GBM patient samples (n = 4) was performed. LAT1 expression is more prominent in cells in the GBM sample compared to the control brain. (B) Number of LAT1-positive cells per field of view under a 20× objective was counted in all immunostained samples. In human GBM, significantly more cells were LAT1-positive compared to the tumor-free brain. Statistical significance (t-test) is indicated. **** p < 0.0001. (C) Immunofluorescent staining was performed against LAT1 in orthotop murine GBM (Gl261) or patient-derived xenografts (GBM2). LAT1 (red) expression was strong in the tumor boarder, while a weaker expression was visible outside the tumor area. (D) Immunofluorescent co-staining of orthotop murine glioblastoma (Gl261) or human xenograft (GBM2) for LAT1 (red) and Iba1 (green) shows no co-expression of LAT1 in myeloid cells. Scale size is indicated in individual micrographs.
Figure 6
Figure 6
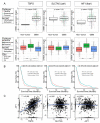
TSPO, solute carrier family 7 member 5 (SLC7A5), and AIF1 expression analysis in a TCGA GBM cohort. Patient GBM samples of the TCGA database were analyzed using GlioVis [29]. (A) Gen expression levels in GBM compared to the tumor-free brain showed that expression levels for TSPO and AIF1 were significantly higher in GBM. P-value of Student’s t test is indicated (upper panel). Significant differences between the gene expression of TSPO and AIF1 were also detected for GBM subtypes. Statistical significance (Tukey’s Honest Significant Difference) is indicated, *** p < 0.0005 (lower panel). (B) Survival of patients with a high or low expression of TSPO, SLC7A5, or AIF1 was analyzed. High TSPO or AIF1 expression was associated with significantly shorter survival, while high SLC7A5 expression levels were favorable for survival. Patient number indicated in graph. (C) A correlation between the genes TSPO, SLC7A5, and AIF1 was performed. A significant positive correlation between TSPO and AIF1 (Pearson’s r = 0.489) was observed, while no correlation between the other pairs could be seen. (D) Expression levels for TSPO and AIF1 were significantly higher in IDHWT GBM than in IDHMUT. P-value of Student’s t-test is indicated.
Figure 6
Figure 6
TSPO, solute carrier family 7 member 5 (SLC7A5), and AIF1 expression analysis in a TCGA GBM cohort. Patient GBM samples of the TCGA database were analyzed using GlioVis [29]. (A) Gen expression levels in GBM compared to the tumor-free brain showed that expression levels for TSPO and AIF1 were significantly higher in GBM. P-value of Student’s t test is indicated (upper panel). Significant differences between the gene expression of TSPO and AIF1 were also detected for GBM subtypes. Statistical significance (Tukey’s Honest Significant Difference) is indicated, *** p < 0.0005 (lower panel). (B) Survival of patients with a high or low expression of TSPO, SLC7A5, or AIF1 was analyzed. High TSPO or AIF1 expression was associated with significantly shorter survival, while high SLC7A5 expression levels were favorable for survival. Patient number indicated in graph. (C) A correlation between the genes TSPO, SLC7A5, and AIF1 was performed. A significant positive correlation between TSPO and AIF1 (Pearson’s r = 0.489) was observed, while no correlation between the other pairs could be seen. (D) Expression levels for TSPO and AIF1 were significantly higher in IDHWT GBM than in IDHMUT. P-value of Student’s t-test is indicated.

References

    1. Ostrom Q.T., Gittleman H., Truitt G., Boscia A., Kruchko C., Barnholtz-Sloan J.S. CBTRUS Statistical Report: Primary Brain and Other Central Nervous System Tumors Diagnosed in the United States in 2011–2015. NeuroOncology. 2018;20:iv1–iv86. doi: 10.1093/neuonc/noy131. - DOI - PMC - PubMed
    1. Leibetseder A., Ackerl M., Flechl B., Wohrer A., Widhalm G., Dieckmann K., Kreinecker S.S., Pichler J., Hainfellner J., Preusser M., et al. Outcome and molecular characteristics of adolescent and young adult patients with newly diagnosed primary glioblastoma: A study of the Society of Austrian Neurooncology (SANO) NeuroOncology. 2013;15:112–121. doi: 10.1093/neuonc/nos283. - DOI - PMC - PubMed
    1. Verhaak R.G., Hoadley K.A., Purdom E., Wang V., Qi Y., Wilkerson M.D., Miller C.R., Ding L., Golub T., Mesirov J.P., et al. Integrated genomic analysis identifies clinically relevant subtypes of glioblastoma characterized by abnormalities in PDGFRA, IDH1, EGFR, and NF1. Cancer Cell. 2010;17:98–110. doi: 10.1016/j.ccr.2009.12.020. - DOI - PMC - PubMed
    1. Karsy M., Guan J., Cohen A.L., Jensen R.L., Colman H. New Molecular Considerations for Glioma: IDH, ATRX, BRAF, TERT, H3 K27M. Curr. Neurol. Neurosci. Rep. 2017;17:19. doi: 10.1007/s11910-017-0722-5. - DOI - PubMed
    1. Brito C., Azevedo A., Esteves S., Marques A.R., Martins C., Costa I., Mafra M., Bravo Marques J.M., Roque L., Pojo M. Clinical insights gained by refining the 2016 WHO classification of diffuse gliomas with: EGFR amplification, TERT mutations, PTEN deletion and MGMT methylation. BMC Cancer. 2019;19:968. doi: 10.1186/s12885-019-6177-0. - DOI - PMC - PubMed

MeSH terms