

The Major Heat Shock Proteins, Hsp70 and Hsp90, in 2-Methoxyestradiol-Mediated Osteosarcoma Cell Death Model
- PMID: 31963524
- PMCID: PMC7014403
- DOI: 10.3390/ijms21020616
The Major Heat Shock Proteins, Hsp70 and Hsp90, in 2-Methoxyestradiol-Mediated Osteosarcoma Cell Death Model
Abstract
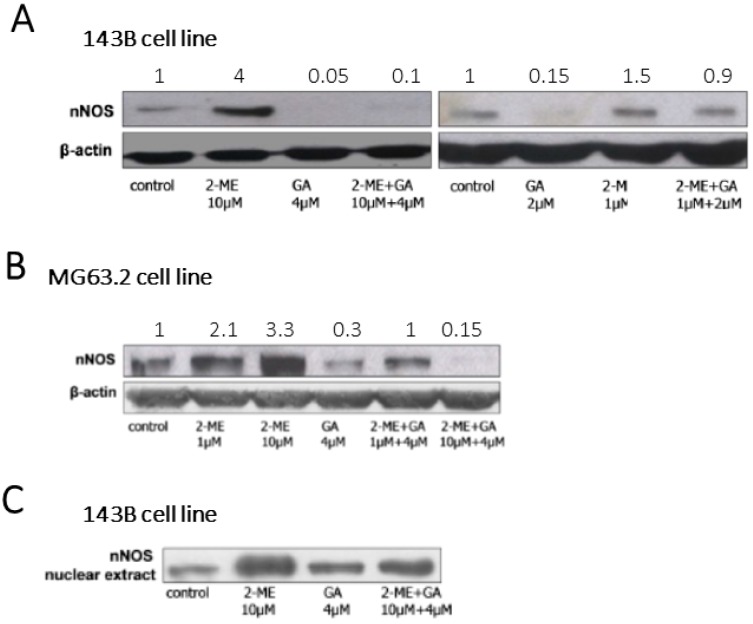
2-Methoxyestradiol is one of the natural 17β-estradiol derivatives and a potential novel anticancer agent currently being under evaluation in advanced phases of clinical trials. However, the mechanism of anticancer action of 2-methoxyestradiol has not been yet fully established. In our previous studies we have demonstrated that 2-methoxyestradiol selectively induces the expression and nuclear translocation of neuronal nitric oxide synthase in osteosarcoma 143B cells. Heat shock proteins (Hsps) are factors involved in the regulation of expression and activity of nitric oxide synthases. Herein, we chose osteosarcoma cell lines differed in metastatic potential, metastatic 143B and highly metastatic MG63.2 cells, in order to further investigate the anticancer mechanism of 2-methoxyestradiol. The current study aimed to determine the role of major heat shock proteins, Hsp90 and Hsp70 in 2-methoxyestradiol-induced osteosarcoma cell death. We focused on the implication of Hsp90 and Hsp70 in control under expression of neuronal nitric oxide synthase, localization of the enzyme, and further generation of nitro-oxidative stress. To give the insight into the role of Hsp90 in regulation of anticancer efficacy of 2-methoxyestradiol, we used geldanamycin as a potent Hsp90 inhibitor. Herein, we evidenced that inhibition of Hsp90 controls the protein expression of 2-methoxyestradiol-induced neuronal nitric oxide synthase and inhibits enzyme nuclear translocation. We propose that decreased level of neuronal nitric oxide synthase protein after a combined treatment with 2-methoxyestradiol and geldanamycin is directly associated with the accompanying upregulation of Hsp70 and downregulation of Hsp90. This interaction resulted in abrogation of anticancer efficacy of 2-methoxyestradiol by geldanamycin.
Keywords: 2-methoxyestradiol; geldanamycin; neuronal nitric oxide synthase; osteosarcoma.
Conflict of interest statement
The authors declare no conflict of interest.
Figures


Similar articles
-
Geldanamycin-induced osteosarcoma cell death is associated with hyperacetylation and loss of mitochondrial pool of heat shock protein 60 (hsp60).PLoS One. 2013 Aug 28;8(8):e71135. doi: 10.1371/journal.pone.0071135. eCollection 2013. PLoS One. 2013. PMID: 24015183 Free PMC article.
-
Hsp90 inhibitor induces autophagy and apoptosis in osteosarcoma cells.Int J Oncol. 2015 Jan;46(1):47-54. doi: 10.3892/ijo.2014.2727. Epub 2014 Oct 23. Int J Oncol. 2015. PMID: 25351442 Free PMC article.
-
Neuronal nitric oxide synthase induction in the antitumorigenic and neurotoxic effects of 2-methoxyestradiol.Molecules. 2014 Aug 28;19(9):13267-81. doi: 10.3390/molecules190913267. Molecules. 2014. PMID: 25170949 Free PMC article.
-
Discovery and development of heat shock protein 90 inhibitors as anticancer agents: a review of patented potent geldanamycin derivatives.Expert Opin Ther Pat. 2013 Aug;23(8):919-43. doi: 10.1517/13543776.2013.780597. Epub 2013 May 4. Expert Opin Ther Pat. 2013. PMID: 23641970 Review.
-
Geldanamycin and its derivatives as Hsp90 inhibitors.Front Biosci (Landmark Ed). 2012 Jun 1;17(6):2269-77. doi: 10.2741/4050. Front Biosci (Landmark Ed). 2012. PMID: 22652777 Review.
Cited by
-
The chaperone system in cancer therapies: Hsp90.J Mol Histol. 2023 Apr;54(2):105-118. doi: 10.1007/s10735-023-10119-8. Epub 2023 Mar 18. J Mol Histol. 2023. PMID: 36933095 Free PMC article. Review.
-
2-Methoxyestradiol and Hydrogen Peroxide as Promising Biomarkers in Parkinson's Disease.Mol Neurobiol. 2024 Jan;61(1):148-166. doi: 10.1007/s12035-023-03575-6. Epub 2023 Aug 17. Mol Neurobiol. 2024. PMID: 37589832 Free PMC article.
-
2-Methoxyestradiol Damages DNA in Glioblastoma Cells by Regulating nNOS and Heat Shock Proteins.Antioxidants (Basel). 2022 Oct 12;11(10):2013. doi: 10.3390/antiox11102013. Antioxidants (Basel). 2022. PMID: 36290736 Free PMC article.
-
Influence of green tea on alcohol aggravated neurodegeneration of cortex, cerebellum and hippocampus of STZ-induced diabetic rats.Heliyon. 2023 Jun 24;9(7):e17385. doi: 10.1016/j.heliyon.2023.e17385. eCollection 2023 Jul. Heliyon. 2023. PMID: 37449181 Free PMC article.
References
-
- Biazzo A., De Paolis M. Multidisciplinary approach to osteosarcoma. Acta Orthop. Belg. 2016;82:690–698. - PubMed
-
- Gorska-Ponikowska M., Kuban-Jankowska A., Eisler S.A., Perricone U., Lo Bosco G., Barone G., Nussberger S. 2-methoxyestradiol affects mitochondrial biogenesis pathway and succinate dehydrogenase complex flavoprotein subunit A in osteosarcoma cancer cells. Cancer Genom. Proteom. 2018;15:73–89. - PMC - PubMed
MeSH terms
Substances
Grants and funding
LinkOut - more resources
Full Text Sources
Medical
