. 2020 Jan 17;9(1):238.
doi: 10.3390/cells9010238.

Prevention of DNA Replication Stress by CHK1 Leads to Chemoresistance Despite a DNA Repair Defect in Homologous Recombination in Breast Cancer

Affiliations

Prevention of DNA Replication Stress by CHK1 Leads to Chemoresistance Despite a DNA Repair Defect in Homologous Recombination in Breast Cancer

Felix Meyer et al. Cells. .

Abstract

Chromosomal instability not only has a negative effect on survival in triple-negative breast cancer, but also on the well treatable subgroup of luminal A tumors. This suggests a general mechanism independent of subtypes. Increased chromosomal instability (CIN) in triple-negative breast cancer (TNBC) is attributed to a defect in the DNA repair pathway homologous recombination. Homologous recombination (HR) prevents genomic instability by repair and protection of replication. It is unclear whether genetic alterations actually lead to a repair defect or whether superior signaling pathways are of greater importance. Previous studies focused exclusively on the repair function of HR. Here, we show that the regulation of HR by the intra-S-phase damage response at the replication is of overriding importance. A damage response activated by Ataxia telangiectasia and Rad3 related-checkpoint kinase 1 (ATR-CHK1) can prevent replication stress and leads to resistance formation. CHK1 thus has a preferred role over HR in preventing replication stress in TNBC. The signaling cascade ATR-CHK1 can compensate for a double-strand break repair error and lead to resistance of HR-deficient tumors. Established methods for the identification of HR-deficient tumors for Poly(ADP-Ribose)-Polymerase 1 (PARP1) inhibitor therapies should be extended to include analysis of candidates for intra-S phase damage response.

Keywords: CHK1; CIN70 score; DNA-damage response (DDR); chromosomal instability (CIN); homologous recombination (HR); triple-negative breast cancer (TNBC).


Conflict of interest statement

The authors declare no conflicts of interest.

Figures
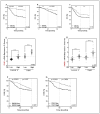
Figure 1
Figure 1
A high gene expression profile consisting of 70 genes associated with a functional aneuploidy (CIN70) score is negatively associated with disease-specific survival in luminal A (LumA) and triple-negative breast cancer (TNBC) subtypes and correlates with the expression of RAD51 and CHK1. (AC). Kaplan–Meier analysis of the CIN70 score as prognostic factor for disease-specific survival (DSS) in breast cancer patients (A) (n = 400) patients with LumA (B) (n = 200) and TNBCs (C) (n = 150) using the two extreme quartiles. The CIN70 score defines the differential mRNA expression of 70 genes in tumors classified as stable and unstable based on their structural and numerical chromosomal alterations [3]. DSS is plotted against time after therapy. All, LumA and TNBC tumors with CIN high showed significantly worse 5- and 10-year DSS compared to tumors with CIN low, with 52% vs. 86% after 10 years for all, 84% vs. 67% after 10 years (n.s/p = 0.0084) for LumA and 52% vs. 62% after 10 years (n.s/n.s) for TNBC tumors. p-values were calculated on the basis of the log-rank test. (D,E). mRNA expression of RAD51 (D) and CHK1 (E) for LumA and TNBC tumors of the Metabric data set sorted by CIN70 score using the two extreme quartiles. RAD51 is expressed significantly higher in CIN high than in CIN low tumors, both in LumA, with −0.88 ± 0.09 vs. 0.27 ± 0.1 and −0.11 ± 0.01 vs. 1.92 ± 0.19, respectively. A significantly increased expression in CIN high compared to CIN low was also found for CHK1, with 1.17 ± 0.04 and −0.03 ± 0.096 for LumA and 0.13 ± 0.1 vs. 2.08 ± 0.1 for TNBC. (F,G). Kaplan–Meier analysis of DSS of 400 patients according to the RAD51 (F) or CHK1 (G) expression using the two extreme quartiles. DSS is plotted against time after therapy. Patients whose tumor had a high expression of RAD51 showed significantly lower DSS compared to low RAD51 expression (68% vs. 62%). For the expression of CHK1, the negative effect of a high expression on survival was even more evident (62% vs. 80%). p-values were calculated on the basis of the log-rank test (**** p < 0.0001; Student’s t-test).
Figure 2
Figure 2
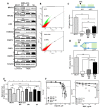
Low homologous recombination (HR) capacity is compatible with efficient replication fork protection and resistance to PARP1 inhibition and mitomycin C (MMC) in TNBCs. (A) Immunoblot detection of BRCA1, BRCA2, ATR, FANCD2, PARP1, CHK1 and RAD51 derived from total cell extracts of exponentially growing MCF7 and MDA-MB-231/BR/SA cells. The MDA-MB-231 showed a slightly increased expression of CHK1 (1.49 ± 0.1) and a further increase in BR (3.7 ± 0.1) and SA (4.3 ± 0.3) compared to MCF7 cells. The same pattern is observed for the expression of RAD51 with a significant increase of 1.64 ± 0.3 in MDA-MB-231, 2.4 ± 0.5 and 2.6 ± 0.3 in BR and SA compared to MCF7 cells. ß-Actin was used as the loading control. Data are presented as mean ± SEM. Immunoblot signals were detected and quantified by a LiCor system. (BD) Repair of open and replication-associated DNA double-strand break (DSB) as a measure of HR capacity, determined by plasmid-reconstruction assay and analyzed by FACS. Cells were transiently transfected with the pDRGFP construct (C) or DR-ori-GFP plus the ori-activating MSCV-N EBNA1 construct (D) for 24 h. The number of GFP-expressing cells was normalized to the absolute HR capacity of MCF7. A significantly lower HR capacity for frank DSB was found in all TNBCs compared to MCF7 cells, with 0.12 ± 0.008 for MDA-MB-231, 0.23 ± 0.04 for BR, and 0.45 ± 0.07 for SA. The same pattern was observed for DSBs adjacent to a DNA replication origin, with 0.17 ± 0.03 for MDA-MB-231, 0.27 ± 0.03 for BR, and 0.75 ± 0.05 for SA compared to MCF7 cells. (E) Mean length of DNA fibers in MCF7 and MDA-MB-231/BR/SA cells. The cells were sequentially labelled with CldU and IdU for 30 min and treated with HU between both labels for 4 h. DNA was spread on slides, fixed and incorporated nucleotides were detected by immunofluorescence. Although all cell lines showed a shortening of the CldU tract, MCF7 showed the most pronounced shortening with 0.8 ± 0.004, followed by MDA-MB-231 and BR with 0.89 ± 0.003 and 0.89 ± 0.001. SA showed only a minimal shortening of the CldU tract with 0.93 ± 0.006. The length of the DNA fibers was measured with the Image J software and calculated relative to the absolute length of the untreated controls. (F) Cellular survival after treatment with olaparib (left) or MMC (right) in MCF7 and MDA-MB-231/BR/SA cells. The cells were seeded 24-h prior treatment with olaparib or MMC for 5 days or 1 h, fixed after 14 days, and the number of colonies was counted. Shown are means from three independent experiments ± SEM. Asterisks represent significant differences (* p < 0.05; ** p < 0.01; *** p < 0.001; **** p < 0.0001, n.s. not significant; Student’s t-test).
Figure 3
Figure 3
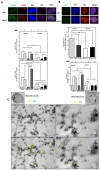
Resistance to MMC is due to the improved repair of DNA damage at DNA replication forks. (A) RAD51(green) and γH2AX foci (red) as well as (B) RPA foci (green) in S-Phase (Edu+) cells arising spontaneously or after treatment with MMC. Cells were treated with 0.5 µg/mL MMC for 1 h after pulse labeling with 10 µM Edu for 20 min. Immunofluorescent staining was performed 24 h after treatment with γH2AX or RPA and fluorescent second antibodies. Replicating cells were discriminated by incorporated Edu stained with the “click-it” reaction. Foci analysis was done with the Image J Software. Foci were only counted in Edu-positive nuclei (n = 100). DNA was counterstained by DAPI. The number of Foci was calculated relatively to the number of Foci in untreated control. Shown are means of three independent experiments ± SEM. Asterisks represent significant differences (* p < 0.05; ** p < 0.01; *** p < 0.001; **** p < 0.0001, n.s. not significant; Student’s t-test). (C) Transmission electron microscopy shows colocalization of gold-labeled γH2AX (yellow) and RPA (green) for MDA-MB-231 BR and MDA-MB-231 SA cells in untreated and MMC treated cells (0.5 µg/mL) 24 h after treatment within nuclear ultrastructure mainly associated to heterochromatic regions.
Figure 4
Figure 4
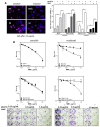
CHK1 inhibition leads to increased replication stress only in MMC-resistant TNBC. (A) Examples and frequency distribution of DNA fiber lengths (CldU) in untreated and MMC treated cells. Exponentially growing cells were sequentially labeled with CldU and IdU in the absence or presence of MMC (0.1 µM). DNA was spread and incorporated CldU and IdU was detected with appropriate antibodies. Shown are means ± SEM of DNA fiber length (CldU) frequency distributions of three independent experiments. Asterisks represent significant differences (** p < 0.01; *** p < 0.0001, Student’s t-test). (B) Immunodetection of activated intra-S phase checkpoint proteins. Cells were treated with 1.5 µg/mL MMC for 1 h and proteins were extracted 24 h later. Proteins were separated and transferred by Western blotting. Detection of proteins was performed with appropriate antibodies. HSC70 served as the loading control. Phosphorylation of the untreated control was used for standardization and ratios of phosphorylated to non-phosphorylated protein are shown. Data from three independent experiments were used for quantification. Errors are mean values + SEM. (C) DNA fiber lengths of CldU labeled tracts after treatment with MMC in the presence of the CHK1 inhibitor MK8776 (1 µM). Exponentially growing cells were incubated for 2 h with MK8776 and sequentially labeled with CldU and IdU (plus 0.1 µM MMC), DNA was spread and incorporated nucleotides were detected with the appropriate antibodies. The frequency distribution of DNA fiber lengths in the first label (CldU) of three independent experiments is shown. Asterisks represent significant differences (* p < 0.05; ** p < 0.01; *** p < 0.001; **** p < 0.0001, n.s. not significant; Student’s t-test).
Figure 5
Figure 5
CHK1 inhibition sensitizes only cells with resistance towards MMC. (A) Percentage and representative examples of cells with pan-nuclear yH2AX signal (red) after treatment with MMC alone or combined with CHK1 (MK8776) inhibition. Exponentially growing cells were treated with 0.5 µg MMC for 1 h after being incubated with 2 µM MK8776 for 2 h. The 24 h after treatment immunofluorescence staining for γH2AX was performed and nuclei were counterstained with DAPI. Cells with pan-nuclear γH2AX signal indicating replication stress were microscopically evaluated. Means + SEM of three independent experiments are shown. Asterisks represent significant differences (* p < 0.05, ** p < 0.001, *** p < 0.0001, Student’s t-test). (B) Cellular survival after treatment with MMC alone or in combination with the CHK1 inhibitor MK8776. Cells were plated, treated with MK8776 (2 µM) for 2 h and/or MMC for 1 h, fixed and stained after 14 days and the number of colonies was counted. Adding MK8776 sensitized the two resistant cell lines to MMC (p = 0.003 and 0.007 at 1.5µg/mL MMC). For the two MMC sensitive cells there was no sensitizing effect by the CHK1 inhibitor. Shown are means of three independent experiments ± SEM. Asterisks represent significant differences (* p < 0.05; ** p < 0.01, Student’s t-test). Induction of the replicative catastrophe should result in cell death, which was investigated by the colony formation assay. Figure 5B shows that adding the CHK1 inhibitor MK8776 sensitized the two resistant cell lines to MMC. The IC50 values for the two cell lines were reduced by an enhancement factor of 4.3 and 2.9. For the two MMC sensitive cells there was no sensitizing effect by the CHK1 inhibitor. Thus, only cell lines resistant to MMC could be sensitized by inhibition of CHK1 (* p < 0.05; ** p < 0.01; *** p < 0.001; **** p < 0.0001, n.s. not significant; Student’s t-test).

Similar articles

Cited by

References

    1. Bianchini G., Balko J.M., Mayer I.A., Sanders M.E., Gianni L. Triple-negative breast cancer: Challenges and opportunities of a heterogeneous disease. Nat. Rev. Clin. Oncol. 2016;13:674–690. doi: 10.1038/nrclinonc.2016.66. - DOI - PMC - PubMed
    1. Carter S.L., Eklund A.C., Kohane I.S., Harris L.N., Szallasi Z. A signature of chromosomal instability inferred from gene expression profiles predicts clinical outcome in multiple human cancers. Nat. Genet. 2006;38:1043–1048. doi: 10.1038/ng1861. - DOI - PubMed
    1. Birkbak N.J., Eklund A.C., Li Q., McClelland S.E., Endesfelder D., Tan P., Tan I.B., Richardson A.L., Szallasi Z., Swanton C. Paradoxical relationship between chromosomal instability and survival outcome in cancer. Cancer Res. 2011;71:3447–3452. doi: 10.1158/0008-5472.CAN-10-3667. - DOI - PMC - PubMed
    1. Karanam K., Kafri R., Loewer A., Lahav G. Quantitative live cell imaging reveals a gradual shift between DNA repair mechanisms and a maximal use of HR in mid S phase. Mol. Cell. 2012;47:320–329. doi: 10.1016/j.molcel.2012.05.052. - DOI - PMC - PubMed
    1. Heyer W.D., Ehmsen K.T., Liu J. Regulation of homologous recombination in eukaryotes. Annu. Rev. Genet. 2010;44:113–139. doi: 10.1146/annurev-genet-051710-150955. - DOI - PMC - PubMed

Publication types

MeSH terms